In this section, we describe the architecture and workflow in the Beeks Analytics solution in the Beeks Analytics product suite.

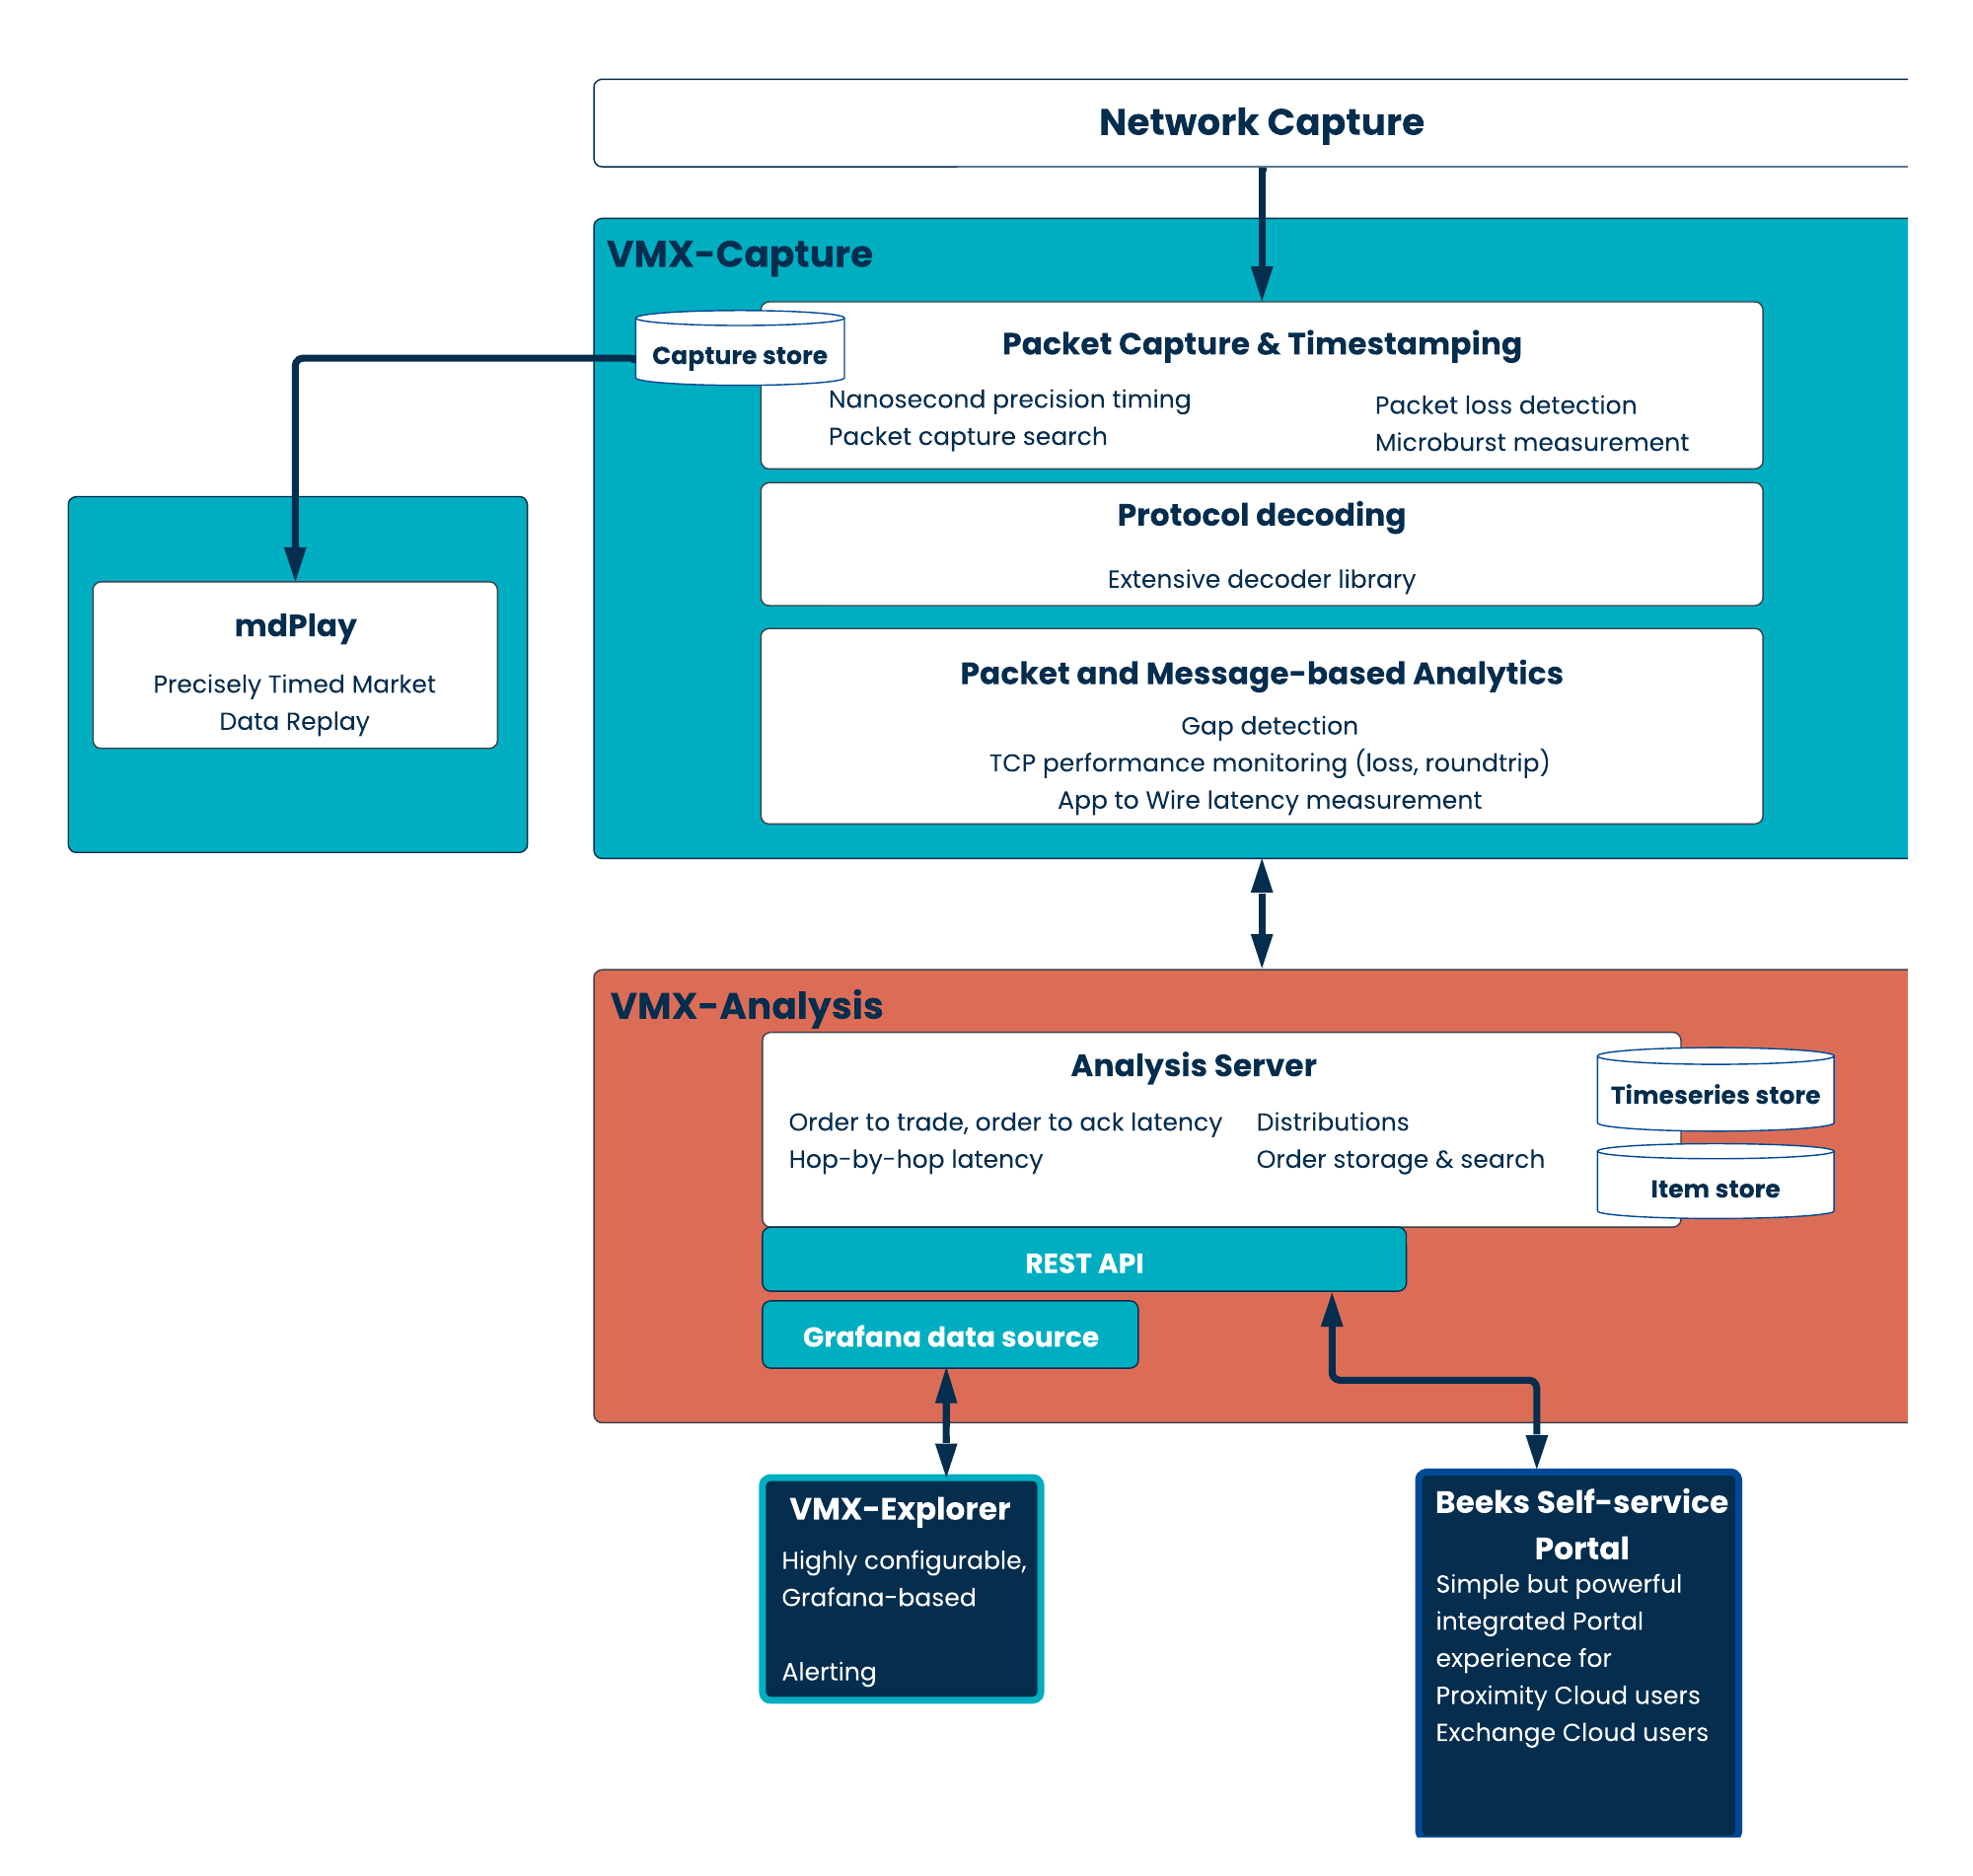
The diagram below is a high-level view of the main components and workflows in Beeks Analytics. 

Beeks Analytics components and workflows.

For a more detailed expansion of this diagram, see Appendix A: Beeks Analytics full architecture diagram.

The goals behind the Beeks Analytics architecture are threefold:

  • To operate with an open architecture, which provides the benefit of multiple high volume integration points with your organisation’s own systems.

    • This allows your organisation to fully own the data produced by the Analytics system.

    • It also allows your organisation to run the Analytics software on their own hardware if this is more efficient for them.

  • To allow open scaling, which allows the capacity of the system to handle load to scale up with commercially available server hardware improvements.

  • To be modular and licenced to support open consumption.

    • This means that, for example, if you only need the high performing VMX-Capture layer and don’t require the in-depth analytics that the VMX-Analysis layer provides, we’ll make sure the software is licensed and priced accordingly.

    • It also means that we’re transparent about the drivers of our pricing - core count required for the analysis, which we make clear in our transparent performance metrics.

Overview

In this section, we provide short descriptions of the components in the diagram and their tasks.

VMX-Capture

VMX-Capture is the data capture layer in Beeks Analytics.

How is data captured?

A Probe is a physical capture or monitoring location in your network or application. The location of the probes is called a Visibility Point.

Packet Capture probes capture and decode packets which are sent to a physical disk. VMX-Capture facilitates search of these packet captures using BPF filters, so that specific packet captures can be retrieved. The retrieved packet capture can be downloaded as a native packet capture file, or can be played through a stack probe to provide a more business or application oriented view.

Stack probes capture packets from the network or from inside an application, and decode data about business objects. Some examples of business objects are prices, orders, fills. Each Stack probe uses a filter to extract the necessary data that is needed to generate statistics and analytics for that specific business object. They may lookup lower-level information from the business object (e.g. IP addresses, UDP port numbers) into high-level attributes (e.g. feed name, server name). This mapping operation may be performed against a configuration database. They then inject the business object data, with Pre-aggregated stats and anomalies, into Agents in VMX-Analysis.

Pre-aggregated stats and anomalies are also injected by the VMX-Capture Stack probes into Agents in VMX-Analysis. These concepts are introduced later in this document.

Beeks Analytics concepts diagram

VMX-Analysis

VMX-Analysis is the layer that readies the captured data for analytics.

How is the captured data processed?

Now that VMX-Analysis has the data, it must transform it into a form that it can process in order to measure latencies, create statistics, and build analytics. This transformation is done by Agents, which map the data to a formal set of Attributes, which are then passed to VMX-Analysis.

An Agent is a logical monitoring point that receives low level events containing information about activity within an application or on a network. Each Agent emits Agent Events that are collected and analysed in real time by VMX-Analysis.

Interval timing is the measurement of time between Agent Events, which is the main way in which Beeks Analytics computes latency.

Some latency measurements are possible in VMX-Capture in simple cases, for example where you can derive the latency from information that is contained in a single packet/message. This can be a good approach to calculating latency for high-volume traffic. An App to Wire latency measurement is one example of a measurement that can be made by the VMX-Capture server.

Agents put data into Attributes for processing.
A Flow is the route that the business object takes through the network or application. Each Flow has a unique set of Attributes.

An Item is a group of Agent Events that relate to the same business object.

Correlation is the method of linking together all Agent Events that relate to the same Item in a Flow.

Association is the method of linking together multiple Items, for example, an order and a fill, so that interval timings can be built between Agents in different Flows.

How are stats produced?
Aggregation is the way in which data is sliced and diced in order to create useful statistics that are displayed in views in VMX-Explorer. Aggregated stats enable an end user to drill down through the data to view increasing levels of detail in a single view in VMX-Explorer.

VMX-Explorer

VMX-Explorer is a web-based user interface that displays analytics views via Grafana. This is a highly configurable tool that enables end users to build views and filter data to provide rich insights into your network traffic and latencies.

Beeks Analytics provides pre-configured Grafana dashboards and an easy-to-use Grafana data source to assist with accessing and navigating the analytics data, and to act as guidance for a user who wants to set up their own dashboards.