In Beeks Analytics, VMX-Capture probes capture huge quantities of data at Visibility Points in the network. The data is then mapped to a common format and used in calculations that output easily readable statistics (“stats”) that tell our customers about their network performance.
These statistics are aggregated into hierarchies, so that you can quickly see groupings of latencies at branch node level whilst also having access to the granular information at leaf node level. For example, aggregations may be provided for:
Overall latency per market data venue, across multiple different feeds
Overall latency for a client or venue, across multiple individual FIX sessions
Visualise your aggregations in VMX-Explorer, where you might choose to display root node and branch node level aggregations in your dashboards, and drill down into lower levels to view branch and leaf node data, for example, if you wanted to see which individual feed/FIX session is contributing to an outlier that has prompted an alert.
In Beeks Analytics, aggregations are performed by both VMX-Capture and VMX-Analysis.
Because aggregation is such a fundamental concept for Beeks Analytics statistics, and because it can take place in either the VMX-Capture software or in the VMX-Analysis software, we introduce it here as a ‘bridging’ topic between our discussion of VMX-Capture and VMX-Analysis.
The power of aggregation in Beeks Analytics
A key benefit of Beeks Analytics is that you don’t have to do a lot of configuration to get your required aggregations working. In fact, all you need to do is define the technical or business attributes that you want to aggregate by, and Beeks Analytics will build the aggregator structure for you.
Aggregator structures enable you to get answers about your network - fast.
How is my latency budget being used between different components of the system?
Which market data feeds are causing that spike in volume?
Some clients are reporting delays to order entry messages, is this a common problem or just specific to one client?
Unlike fixed session-based configuration, an aggregator structure provides a 'drill-down' experience which maps really well to the kind of problem-solving that clients need when analysing network data for capital markets environment.
Example business use for an aggregator
In a simple example, VMX-Analysis receives a series of interval events for an Item. Each interval event carries data about the measurement between two Visibility Points, including the time interval, start location, start host, and end host and location. Let’s say you want to view the average latency of the interval events. It’s easy in Beeks Analytics. Just add a moving average calculator to the Aggregator, that takes the time interval value from the interval event and computes the average value.
Aggregator structure
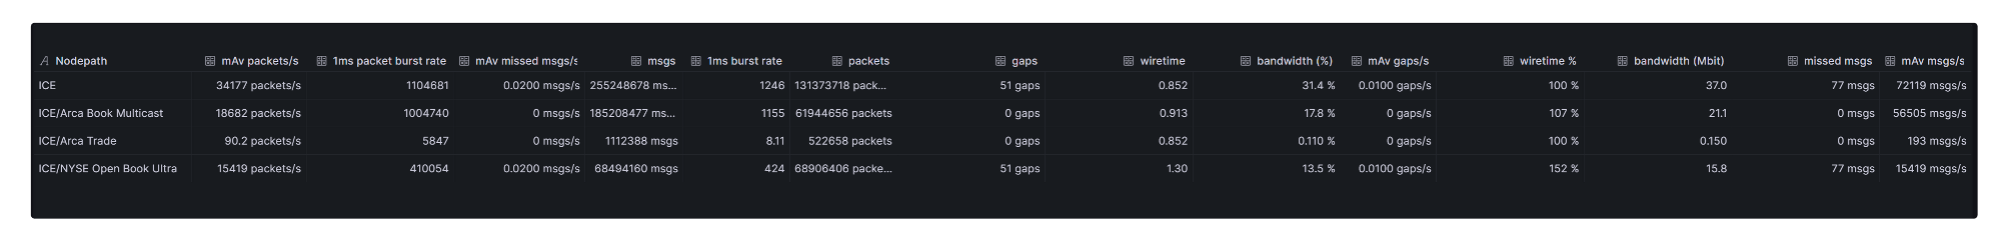
We can think of an Aggregator as a spreadsheet representing a flattened tree structure, where each cell is tracking a different stat. Each row is typically ‘something that is being measured’ and each column is typically a metric.
In the example below, the nodepath column on the far-left shows the level of the breakdown of the recorded data. There is generally a top level summary row followed by multiple levels of breakdown by technical or business attributes.
Aggregator Levels
Aggregators are very powerful in that calculations can be performed at a number of different levels, enabling you to analyse the stream in real-time by a number of different aspects. For example, you may wish to analyse the latency calculation by location and then by hostname within location. By defining the start location and start hostname properties of the interval event as levels, an aggregator can easily perform this analysis.
Aggregator columns and calculators
Each column in an Aggregator represents a calculation that is performed based on the incoming interval data. This data can be timing measurements or any captured business data. For example, you can compute average latency by averaging the interval time property or the total quantity of orders for a given stock. As well as the pre-defined calculators provided out-of-the-box, advanced users can also define their own calculators.
Calculators can also be linked together. For example, you can use the output from a moving average latency calculation as the input to a best or worst calculation before recording the highest or lowest average latency seen over time.
What Aggregators are provided in Beeks Analytics for Markets?
See https://guides.beeksgroup.com/BKDA002/Beeks-Analytics-for-Markets-Aggregators.html in the Beeks Analytics Data Guide.