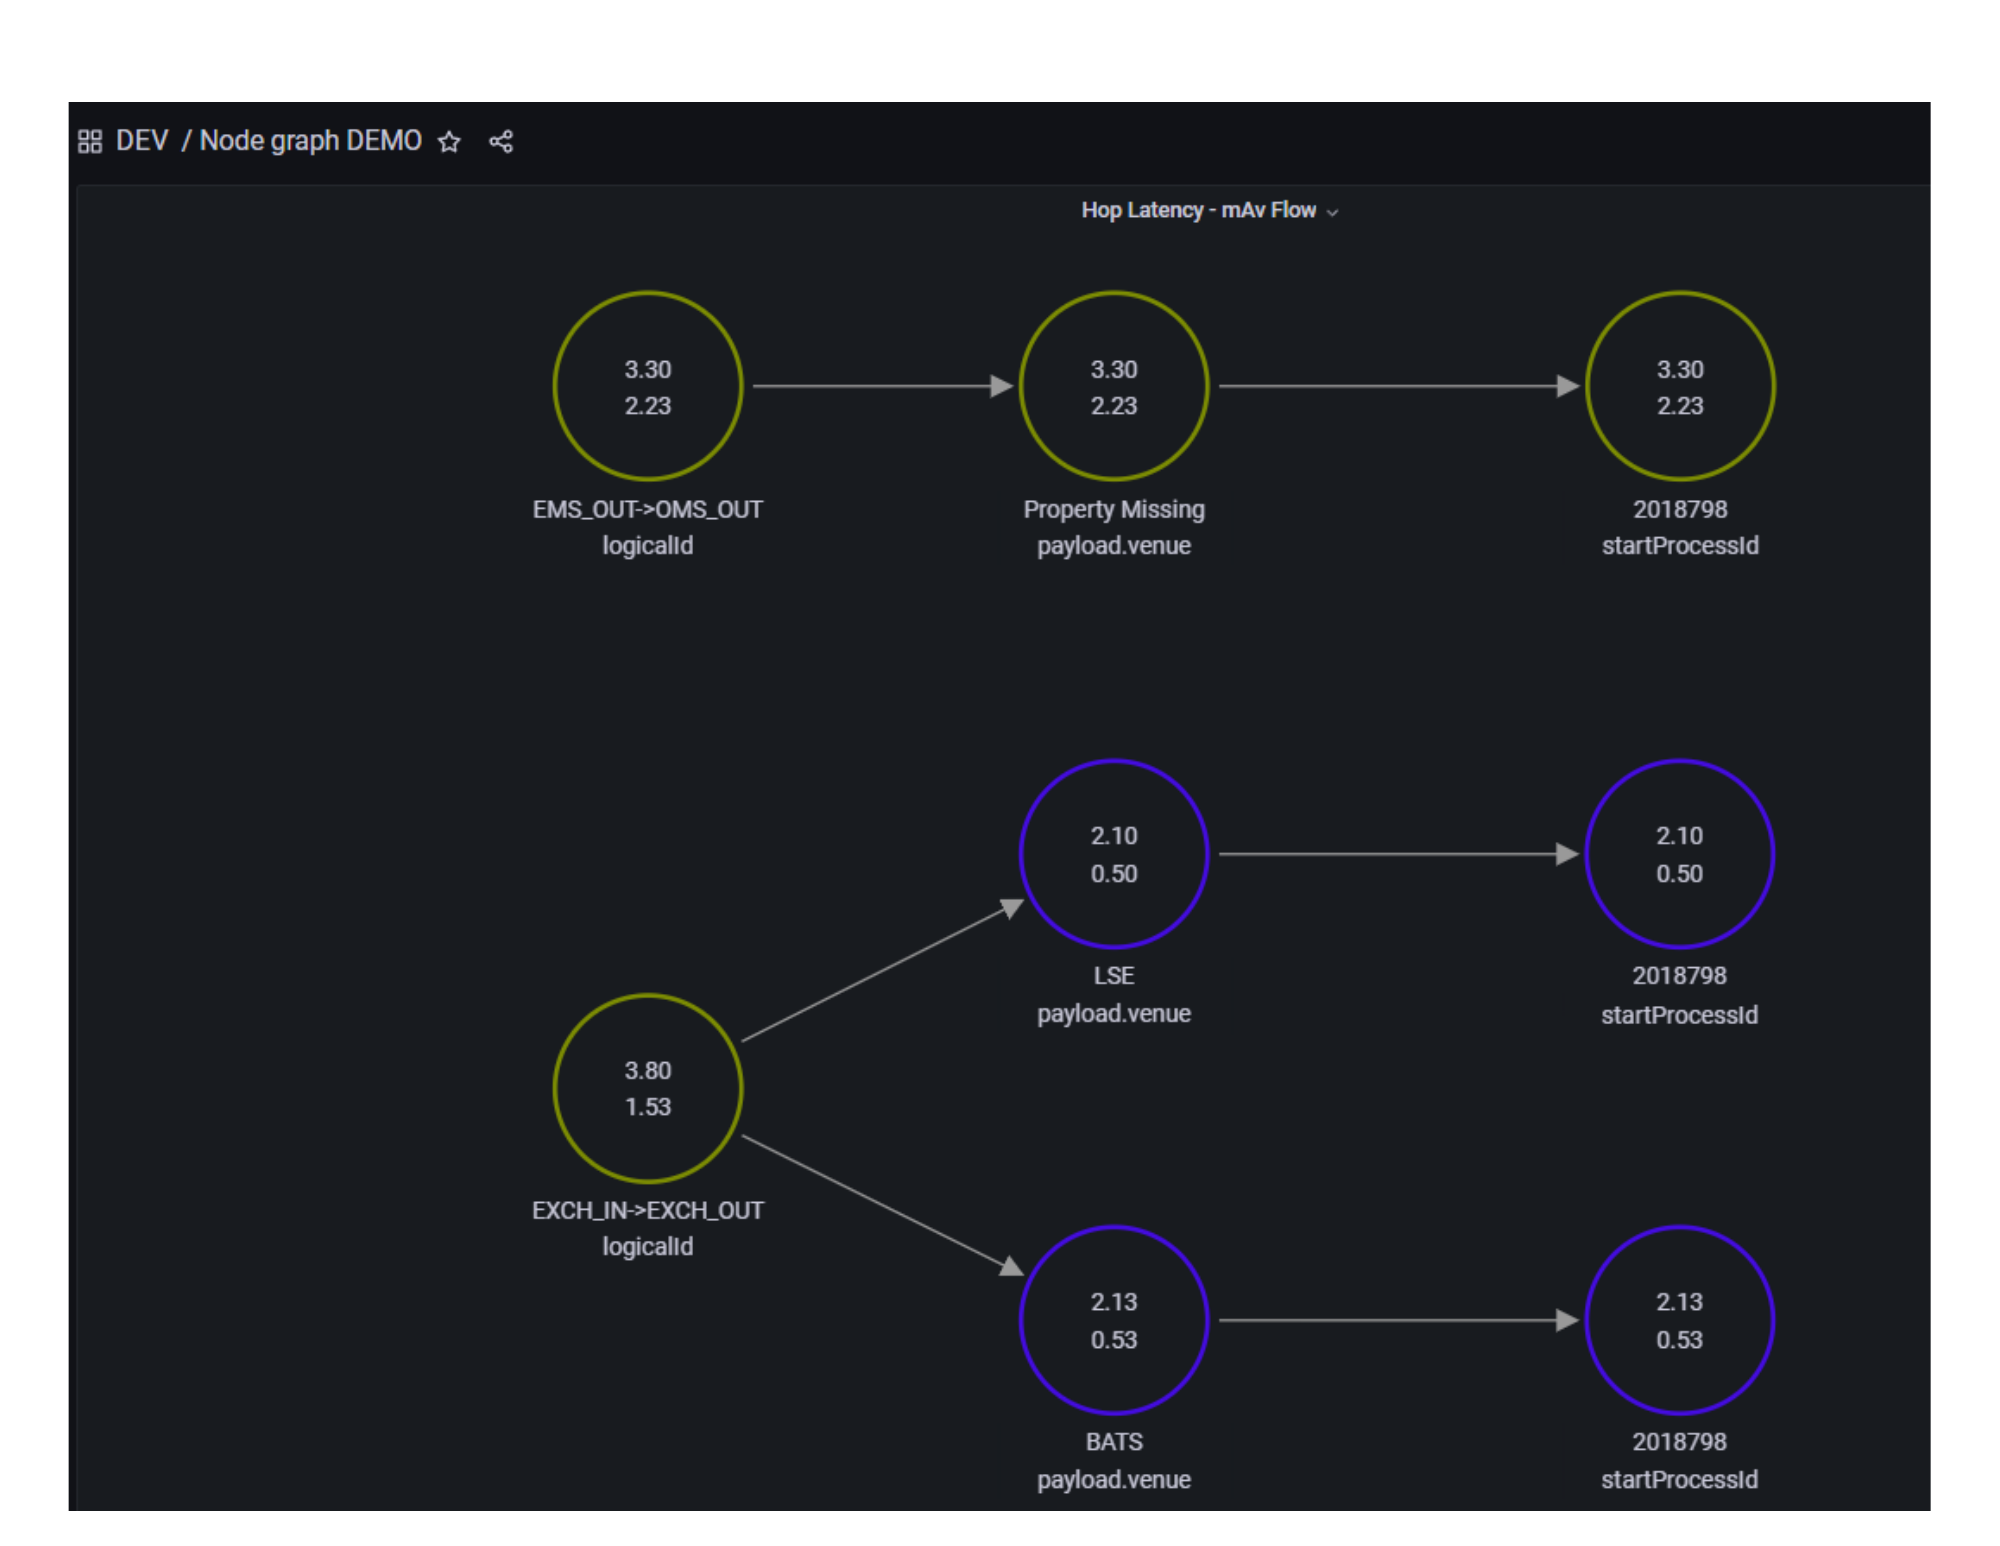
The Aggregator Nodegraph endpoint allows you to query all aggregators in the analytics appliance within a given time-frame, and display them as a Nodegraph.
The following steps assume that you have previously created a panel and added the Beeks Analytics data source.
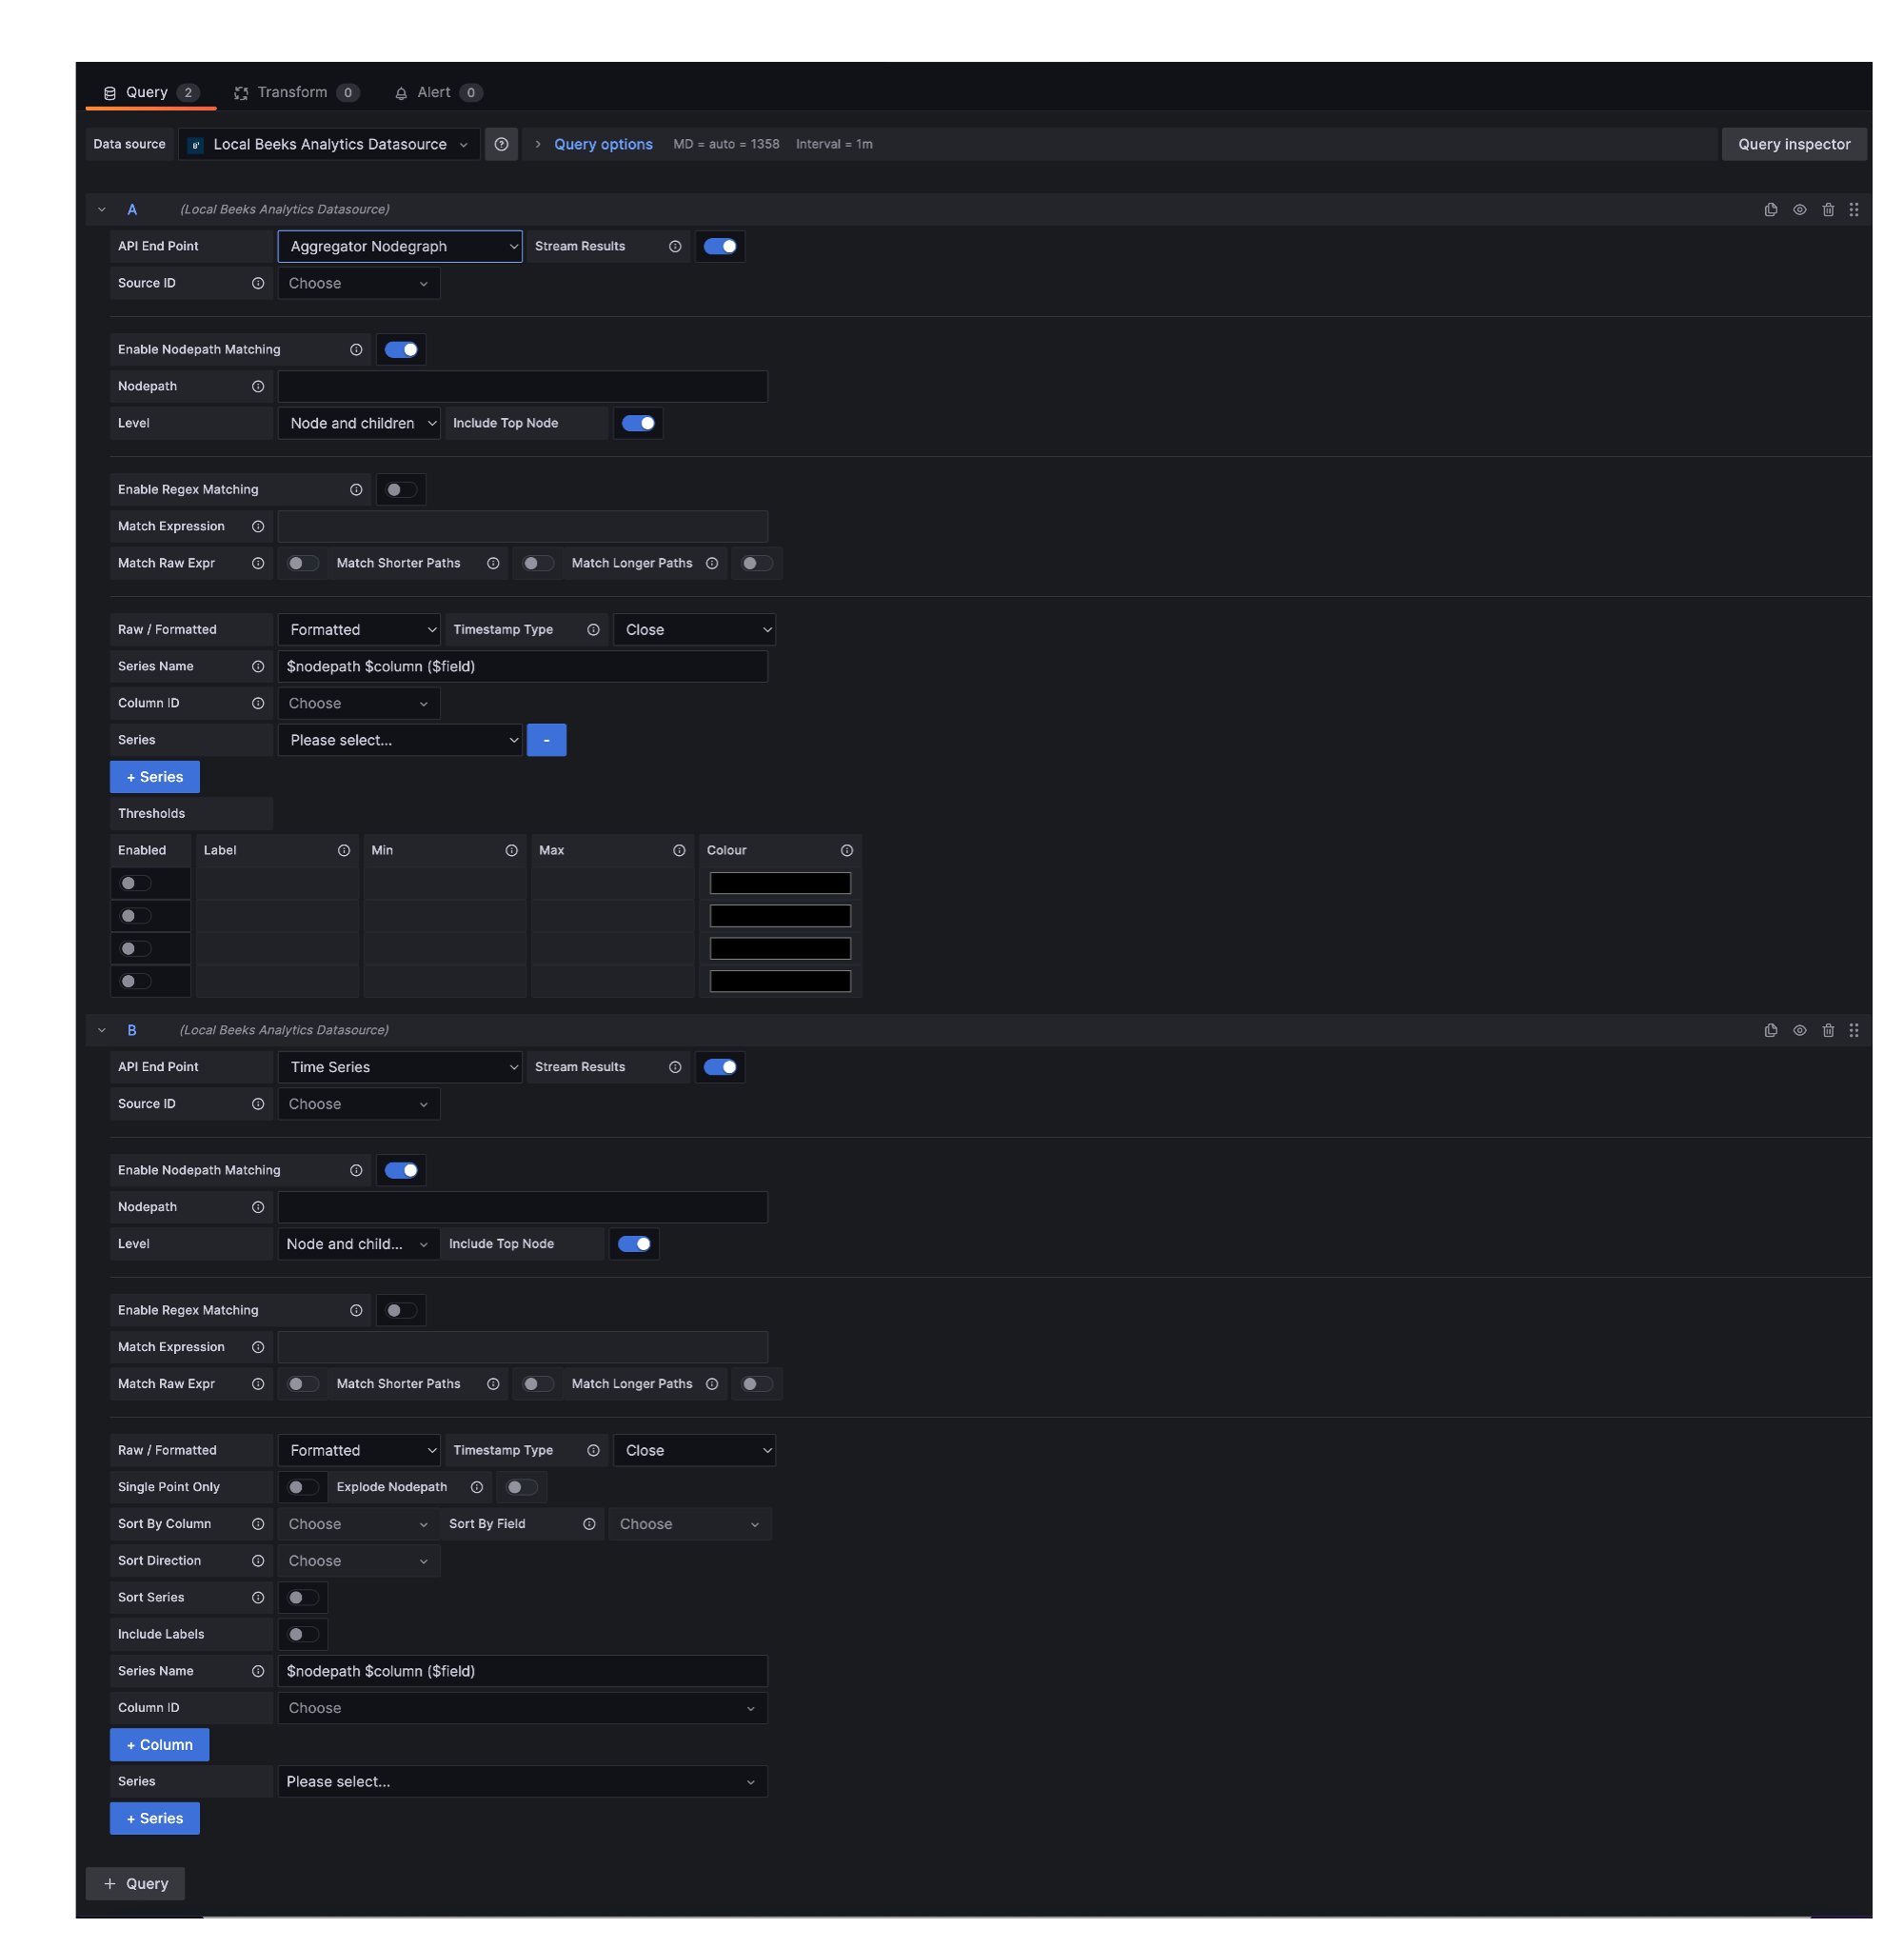
Complete the following fields:
API End Points: Select Aggregators.
Stream Results: See Configuring query results section.
Source ID: [Optional] Select a source ID to filter the data by the definition. Supports variable values.
Enable Nodepath matching: [Optional] Enable to use nodepath matching to retrieve aggregator regions.
Nodepath: If checked, the query will use the supplied codepath to retrieve aggregator regions. NOTE: Use when codepath is fixed, or you can use a variable. Wildcards are not supported but you can work around this by using regex matching (see below).
Level: Select the number of levels to include.
Include Top node: Enable if you want to include the Top node.
Enable Regex Matching: Enable to use regex matching to retrieve aggregator regions.
Match Expression: Enter the regex to match the node path.
Match Raw Expression: Match node path with raw (standard) regex. Default is VMX-specific regex, which recognises “/“ as node path separator.
Match Longer Paths: If not raw regex, match shorter paths.
Match Shorter Paths: If not raw regex, match longer paths.
Raw / Formatted: [Optional] Select Raw to display raw data, or Formatted to display formatted data in the panel. Note that formatted numbers may contain commas and therefore will not be treated as numbers by Grafana.
Series name: A template to be used to build the series name. Available values are $field and $column.
Column ID: The column ID.
+Series: Add a new series.
Thresholds: This table is where you’ll set up how the thresholds are displayed here.
Table: Enabled: Select to enable this threshold.
Table: Label: The label for the colour key in this dashboard.
Table: Min: The minimum threshold value for the node to be displayed in this colour.
Table: Max: The maximum threshold value for the node to be displayed in this colour.
Table: Colour: Select the colour to use for this threshold range via the Colour Picker.
+Query: Add a new query.
See Using dashboard variables in queries for more information about using variables.
The panel will refresh and display the alerts that correspond to the options you've selected. If you have used variables, any changes will trigger a re-run of the query with the new value.