Once you have created a panel, the Edit Panel page opens.
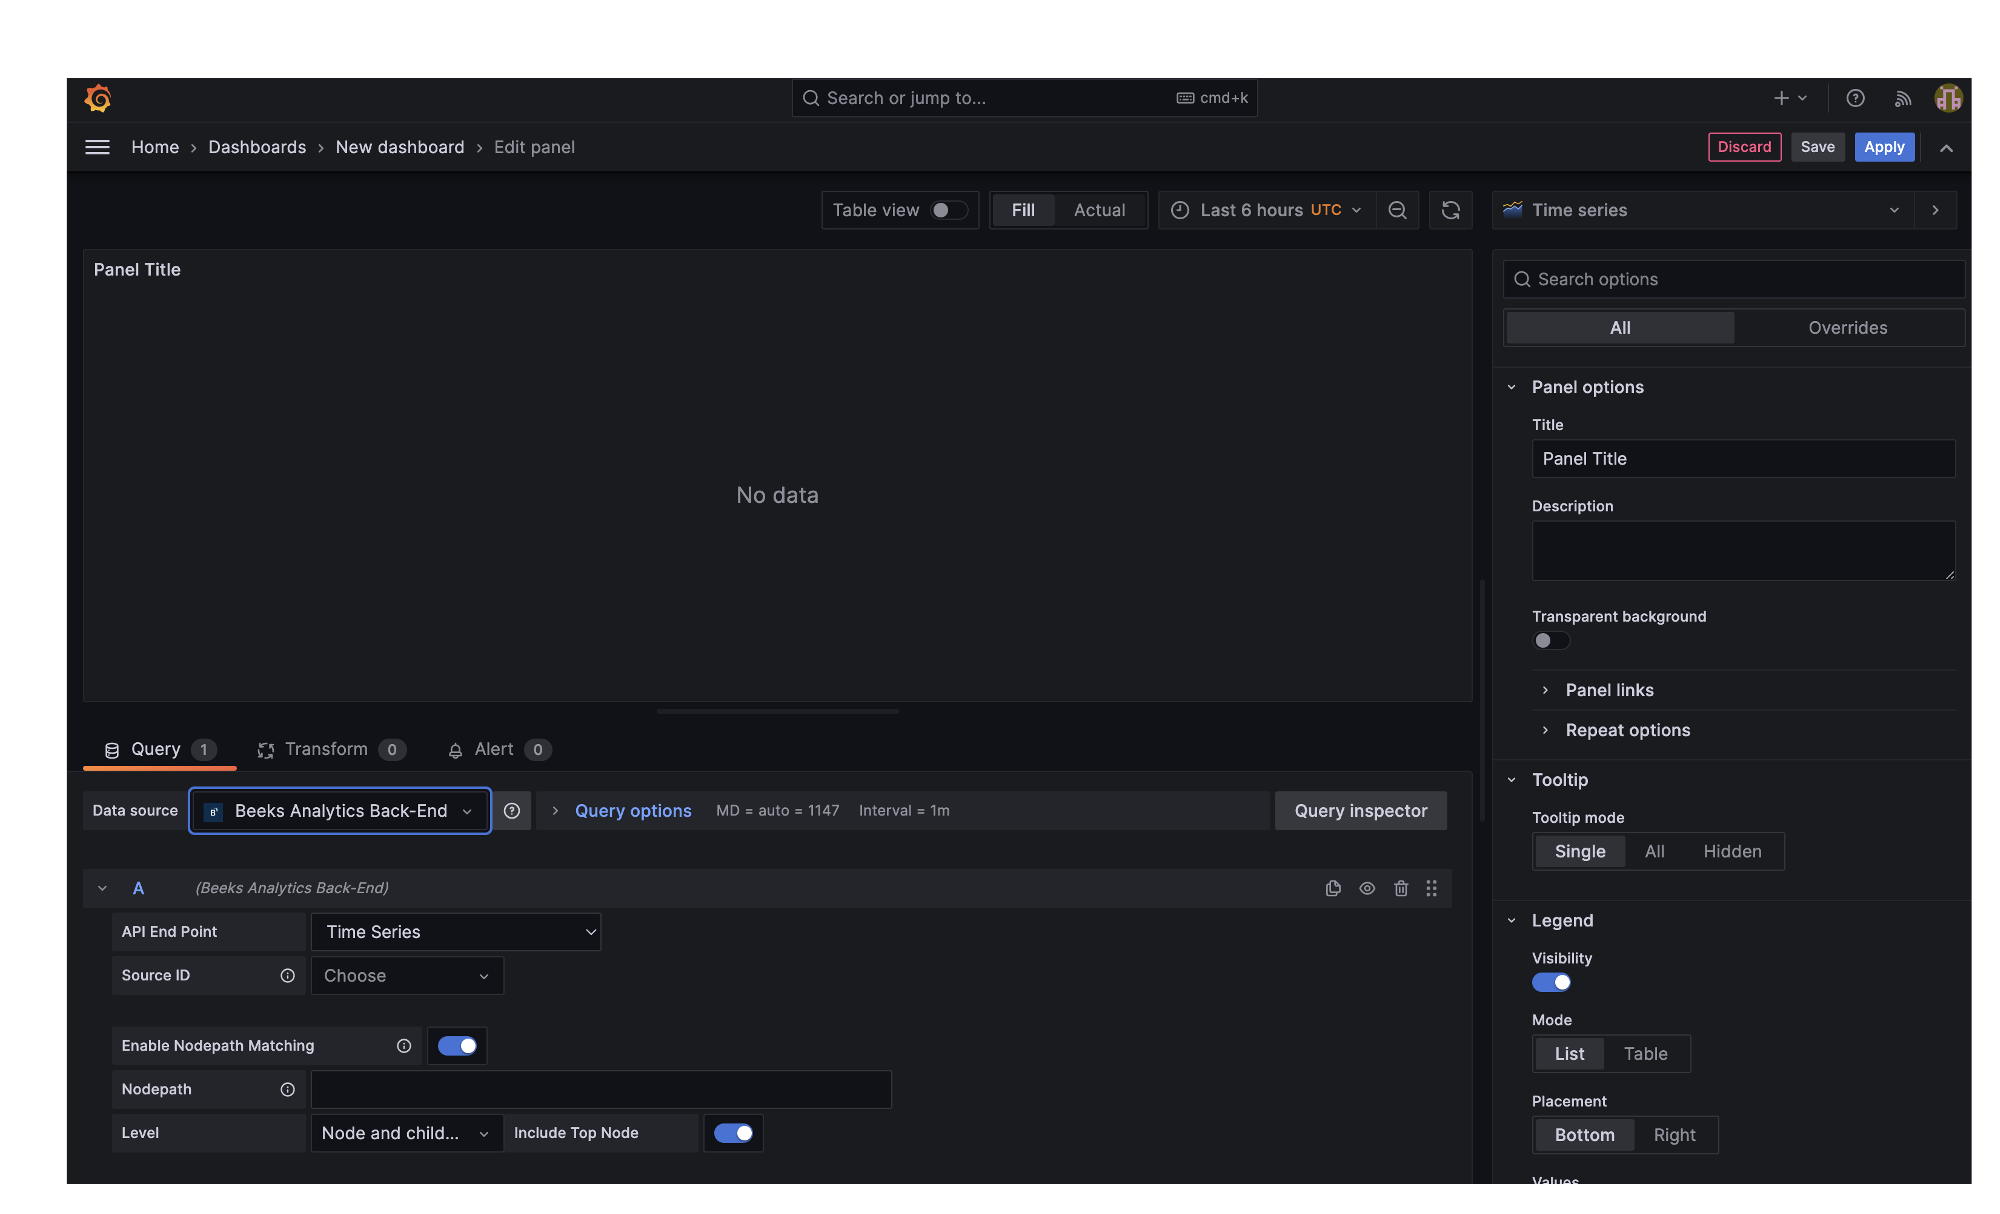
On this page, you’ll set up the queries that will retrieve the data from the Analytics server, which will then be visualised on this panel. To do this, you’ll point the panel at an available datasource and then in the Query Editor section, select endpoints and criteria to filter the results. Finally, you’ll configure the visualisation in the section on the right.
Take the following steps:
In the Query tab, select the data source to use with the panel from the Data source field.
Available Beeks data sources are:Beeks Analytics Datasource
The front-end data source.Beeks Analytics
The back-end data source.
Below the Data source field is the Query Editor. This is where you’ll set up the query by selecting an endpoint and applying criteria to filter the results. In the Query Editor, each query is denoted alphabetically. Query “A” is displayed automatically and has the Time Series endpoint selected by default in the API Endpoint field. If you create a second query, it will be Query “B“.
In Query “A“, select the API Endpoint field to select your chosen endpoint from the menu. The Query Editor will update to display the fields necessary for configuring a query for that endpoint.Complete the fields in the Query Editor for the selected endpoint.
The fields for each endpoint are described in the next sections of this document.
You can drag the separator bar up to expand the query definition section of the screen.
Endpoints and Query Types
As part of the data source, Beeks Analytics for Markets provides some Query Types to make it easier to marshal the data from the endpoints, in addition to providing direct access to the endpoints themselves.
Why do we need Query Types?
Like most visualisation tools, Grafana views the raw data in two-dimensional data frames. This presents some challenges for displaying rich analytics data, which can be highly variable in its nature.
For example: Variable message cardinality
Consider the multiple ways in which different messages in a trade workflow can relate to one another; sometimes multiple prices may be returned in response to an individual Request For Quote (RFQ) message.
For example: Variable fields per message type
There are challenges with the columns of the dataframe format as well: different message types will likely have different fields, but it’s important to display all of them.
To help you address these challenges, VMX-Explorer provides a set of query types with the Beeks Analytics data source that provide useful shortcuts to finding and displaying rich data within Grafana data frames.
Both the endpoints and the query types are displayed in the dropdown in the API Endpoint field.