There are a number of ways to configure the results you get back when a query is run.
Setting Item Batch size at Data Source level
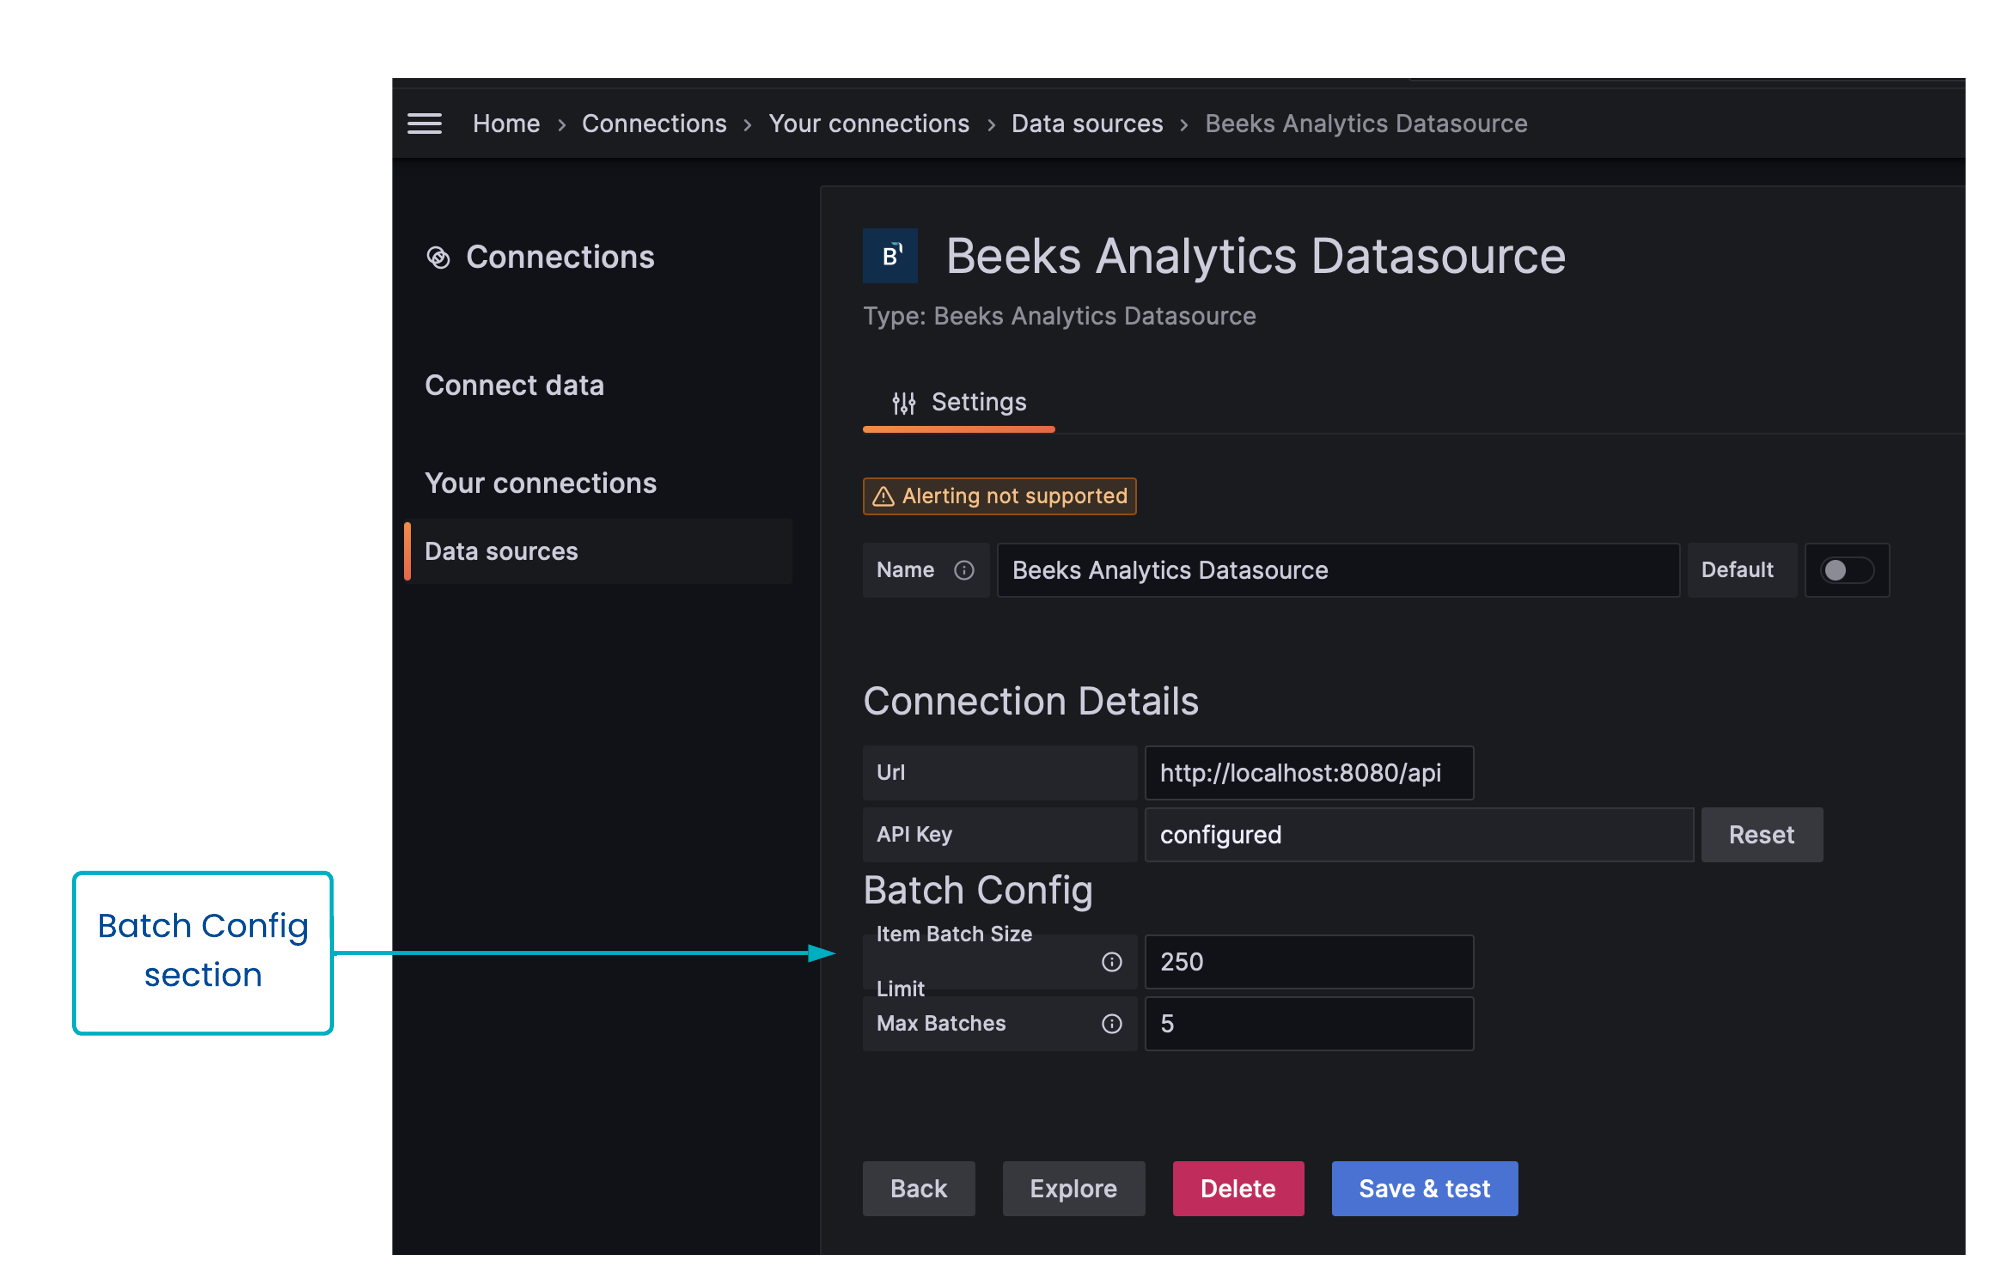
Some API endpoints return batched data. This is most notably true of endpoints which return Items. As a safeguard to prevent the API server being overwhelmed, you can set a maximum Item batch size and maximum number of batches in the Batch Config section of the Data sources configuration page.
To configure Item batch size:
1. Open Home > Connections > Your connectors > Data sources and select the data source for which you want to set Item batch size.
The fields are:
Limit
Enter a maximum size for a batch.
The data source will automatically retrieve batches containing X items, where X is the Limit.Max Batches
Enter a maximum number of batches returned.
The data source will automatically retrieve up to Y batches, where Y is the Max Batches.
The Max Batches value will override any panel-level limits that you set in Query Options.
Guidelines:
For a faster response but more server load, set a higher value in Limit field to increase items rather than batches.
For a slower response but less server load, set a higher value in Max Batches field to increase batches rather than Items.
Panel-level Query Options
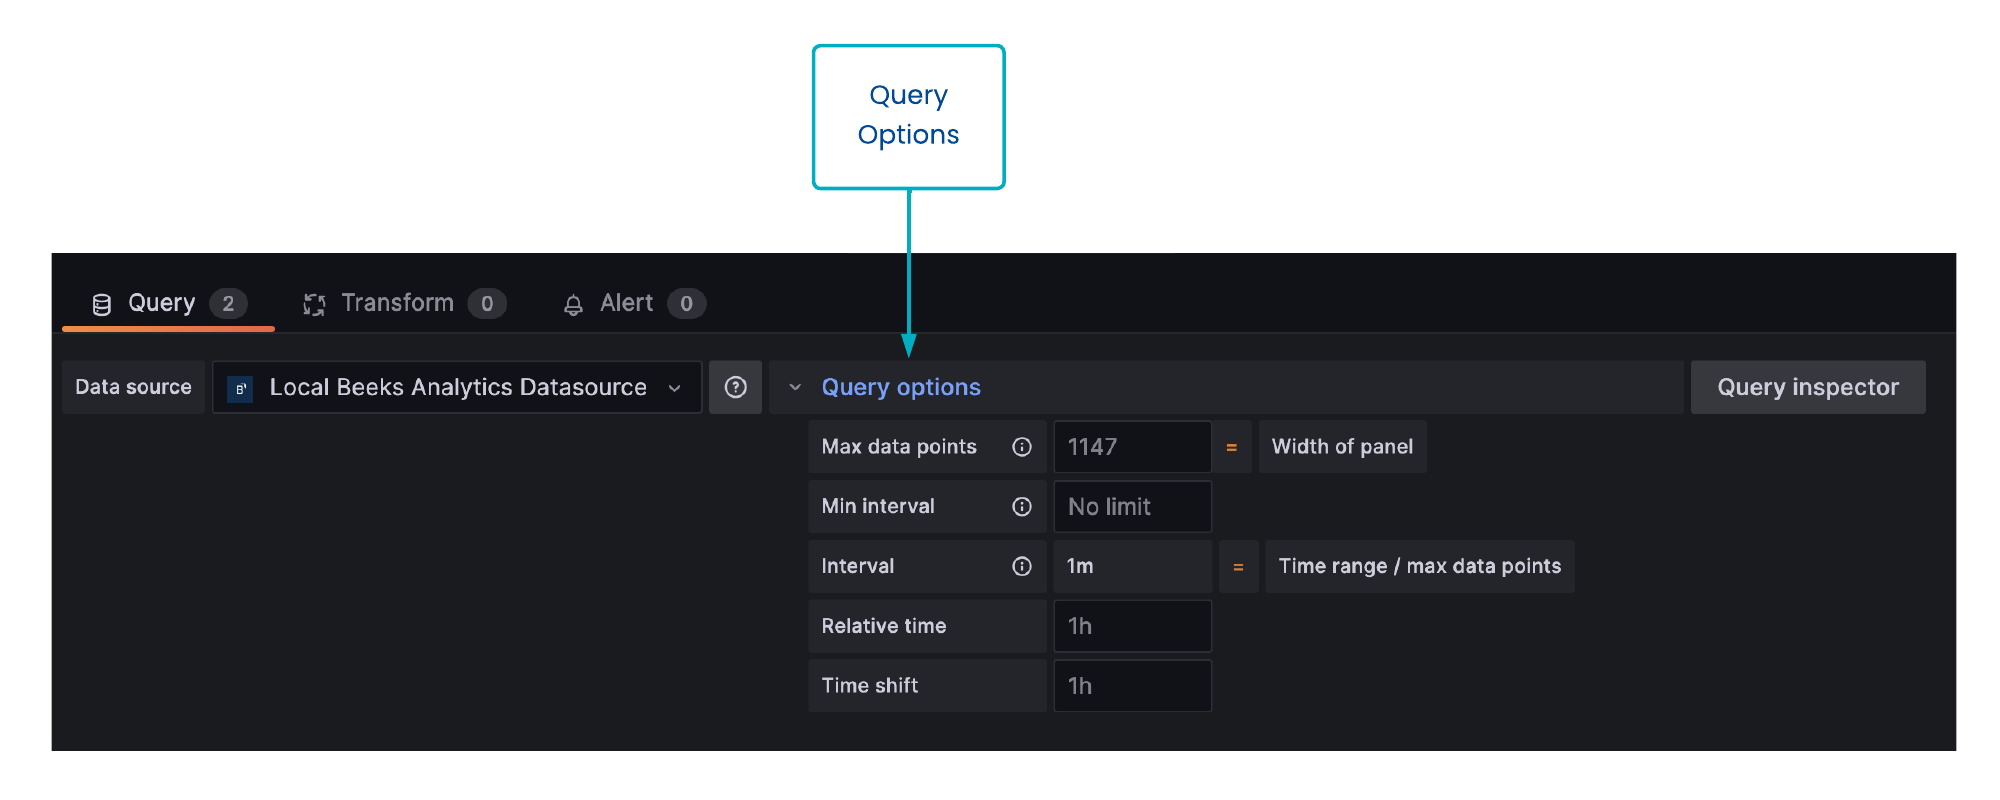
In the Query Editor for a panel, you can also control the batch size and apply other query limits.
To edit or view the Query Options for a panel:
Open the Query Editor in the relevant panel.
Select Query Options to expand this section to display the Query Options fields.
The fields are:
Max data points
The maximum data points per series. You can use this value to impose a panel-level limit on Item batch size, however large values will be overridden by whatever is set as the Item Batch Size in the Data sources configuration page.Min interval
The minimum level for the interval. We recommend you set this to the write frequency, e.g. 1m if your data is written every minute.Interval
Sets a time span that you can use when aggregating or grouping data points by time.Relative time
The time period for which the queries are run. For example, enter 12h to query the last 12 hours.
Overrides the time period selected in the Time Picker in the top-right corner of the dashboard. This enables you to display metrics from different time periods or days on the same dashboard.Time shift
Another time setting that overrides the time period selected in the Time Picker. Set X hours to shift the start and end time period by X hours relative to the time selected in the Time Picker. For example, you can shift the time range for the panel to be two hours earlier than the Time Picker.
Read the Grafana documentation for further information about Query Options.
Streaming results
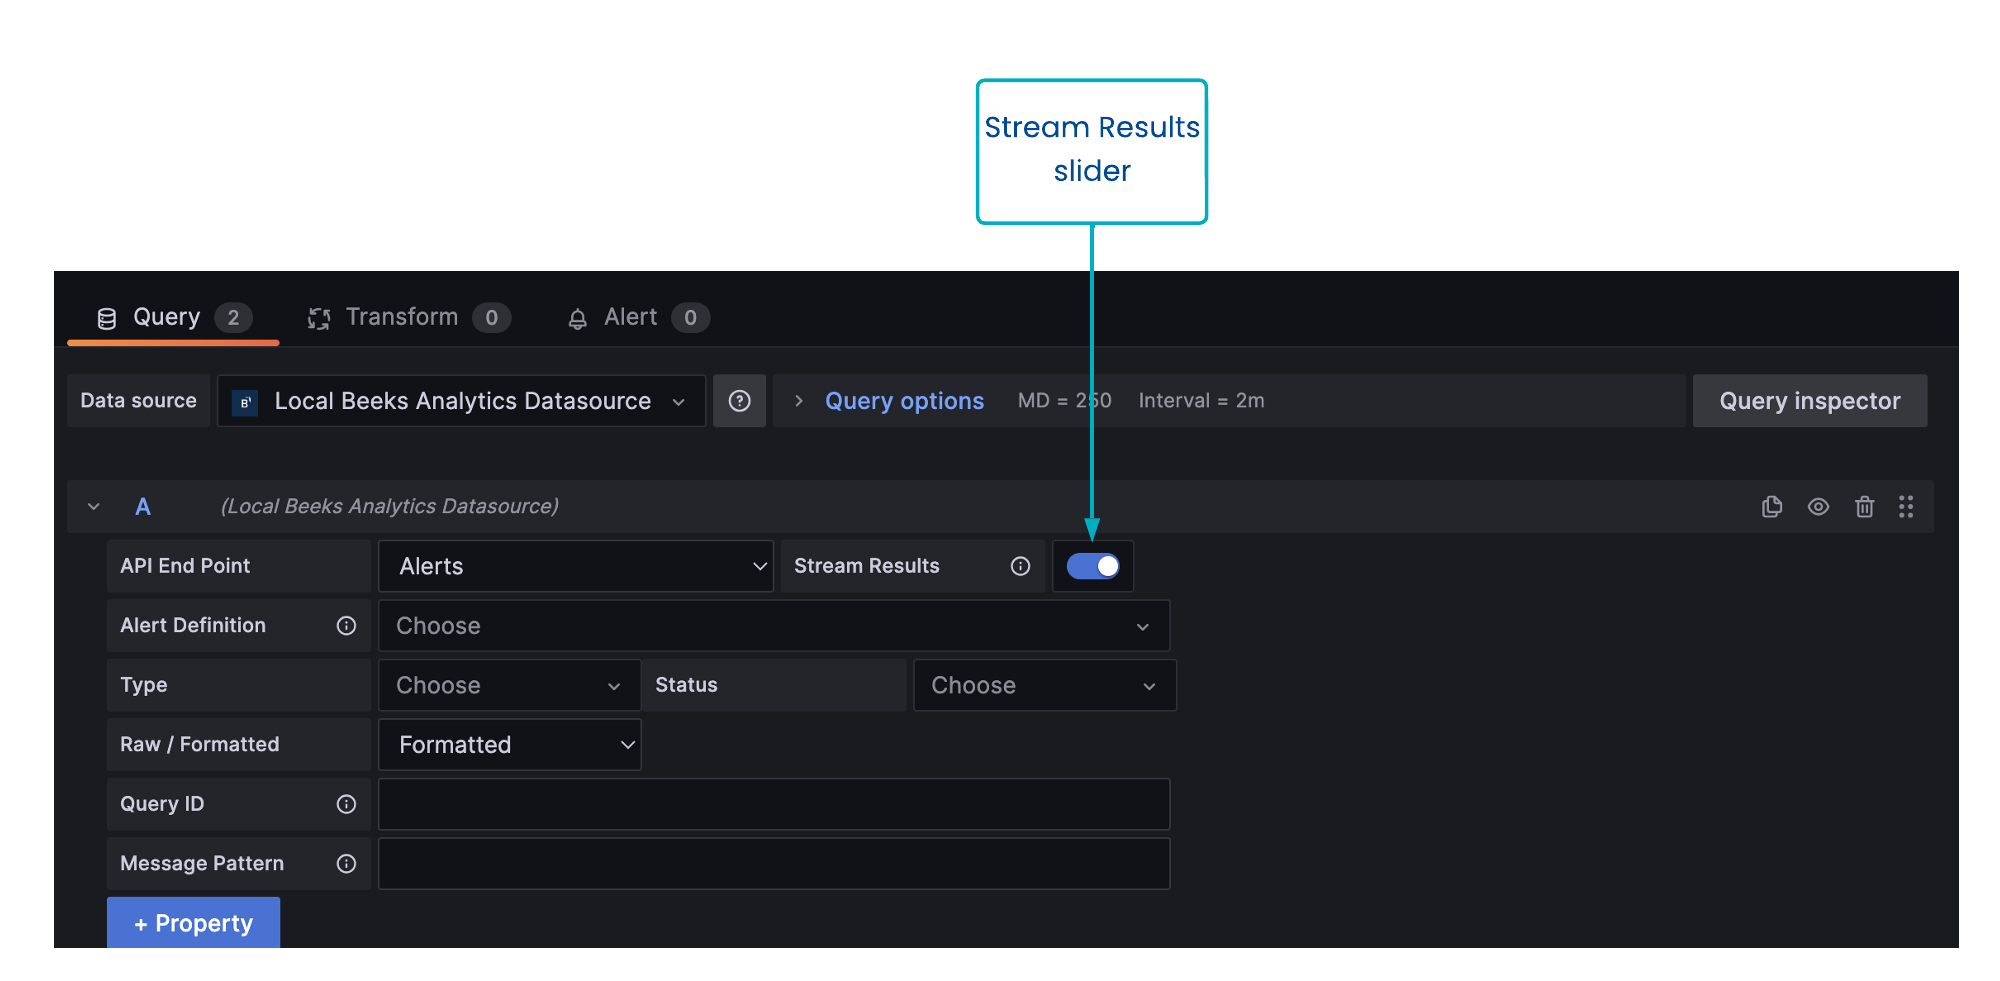
The Query Editor for all endpoints includes a Stream Results slider. If enabled, the query results are returned as they arrive (stream). If disabled, Beeks Analytics will wait for all queries to finish before returning anything.


