The Analytics Details view allows you to select an individual Dedicated Server or External Group and view analytics for it.
Metric Settings
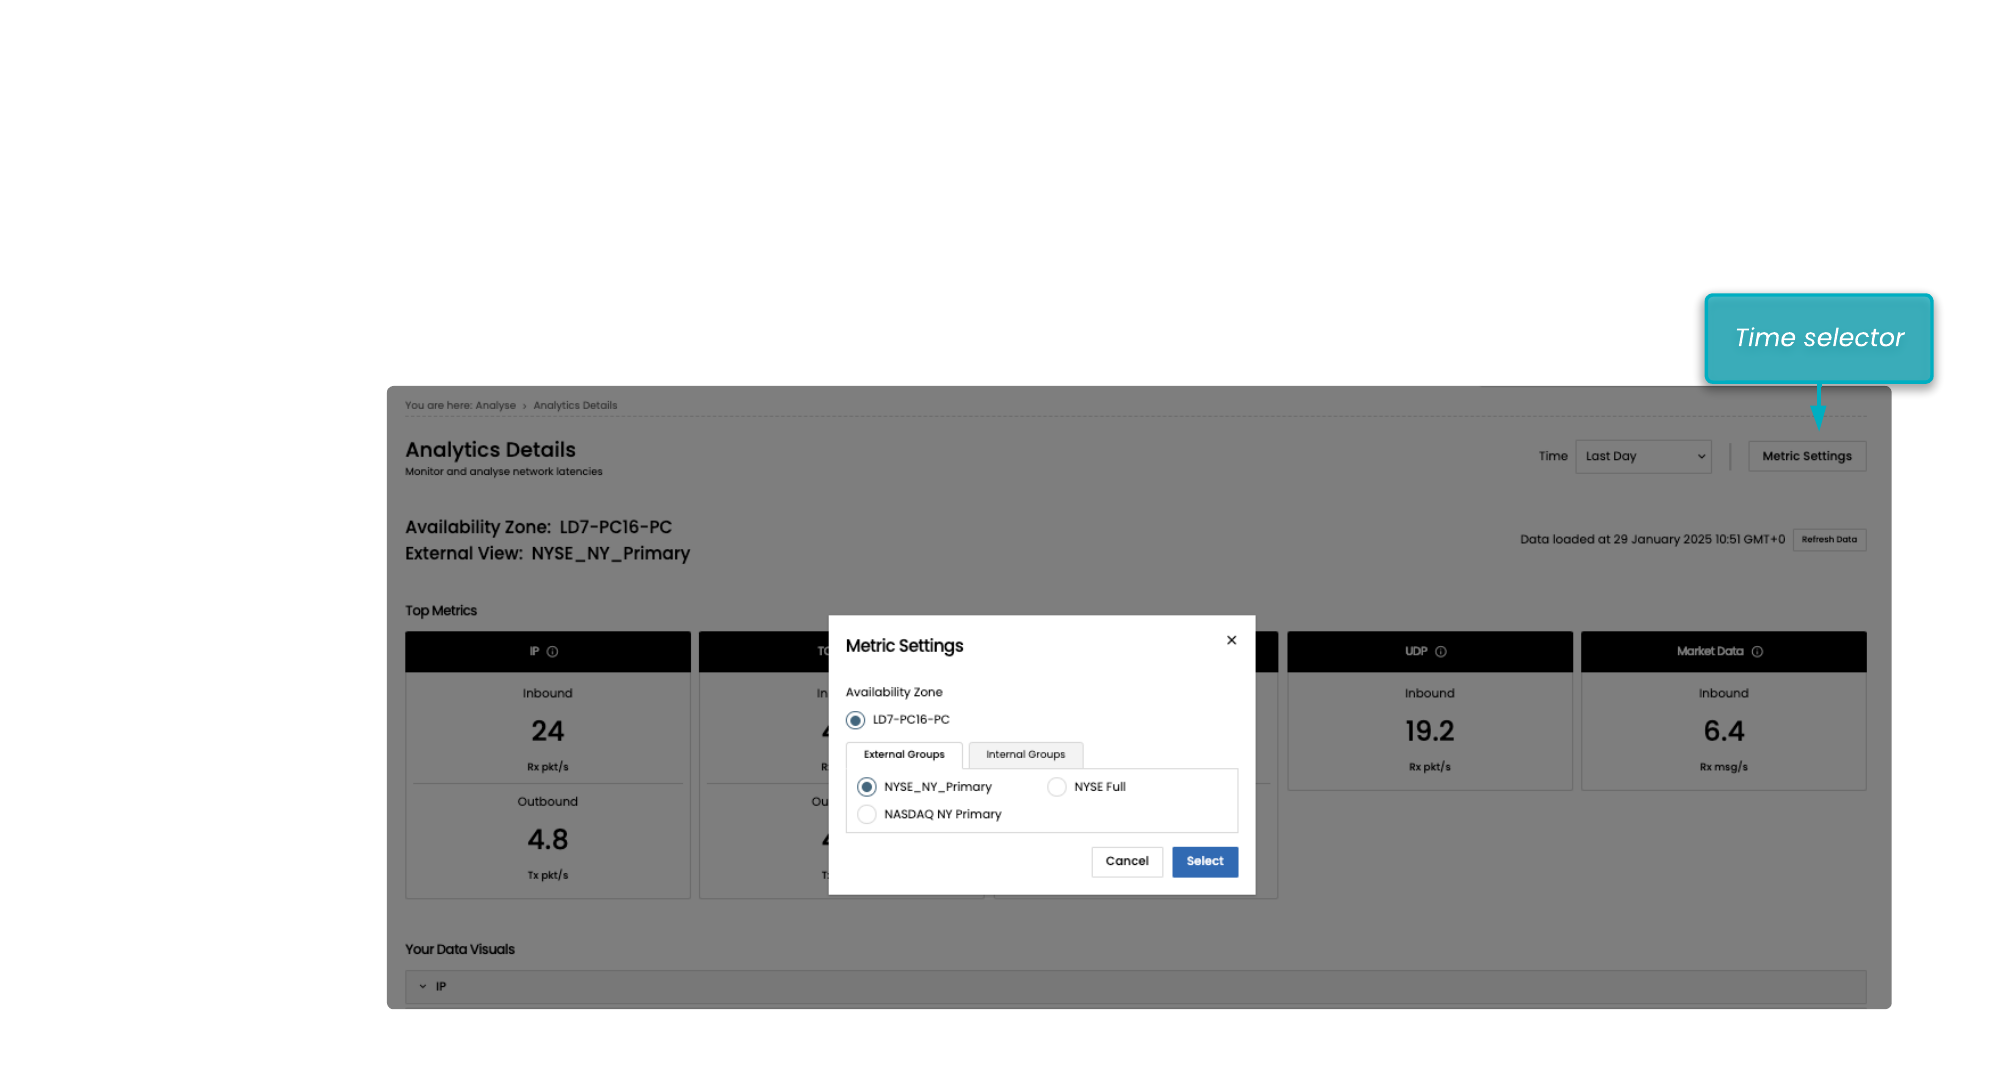
Select the Metric Settings button at the top-right of the screen to filter on the particular focus to view analytics for. This will be a combination of:
The Availability Zone where the Compute Item or External Group is located.
The focus of your Analysis. This can be either:
An External Group, to review your different external connections
A particular Dedicated Server. You can choose from all of the viewable Dedicated Servers in a particular Availability Zone by selecting the Internal Groups tab of the Metric Settings modal window.
External Groups can be defined globally across multiple Availability Zones. However, at present you can only view analysis for one Availability Zone at a time.
For example, you may have connections to a foreign exchange ECN from your LD4 availability zone and your NY4 availability zone. The External Group ‘FXECN’ (for example) can be defined to cover all of these connections. However, the Analytics Details page at present will require you to choose a specific Availability Zone (either NY4 or LD4 in this example) to analyse on any one screen.
Contact the Portal support team if you want to change the naming or definition of your External Groups.
You can use the time selector at the top right to adjust the time period to view a different time period for the metrics.
Select Refresh Data in the top right, to display the most recent data in the graphs and visualisations. The text beside it will update to indicate the time at which the table was refreshed.
The analytics-data/aggregators/groups endpoint can be queried to discover which External Groups are setup for your portal, and which Dedicated Servers on your portal are currently being monitored for Analytics.
Top Metrics for Analytics
The top of the page displays a summary (by protocol) of the current traffic that the Analytics system has visibility of, for the group selected. This can be useful for gauging which protocols are being analysed, and the packet/message volumes for each protocol. The big numbers are updated when you change the time range, but these will always display the latest values for the time range that you have chosen.
If no data is available at all, you will get a hyphen. If there is data historically, but there is no data at present you will get a 0.
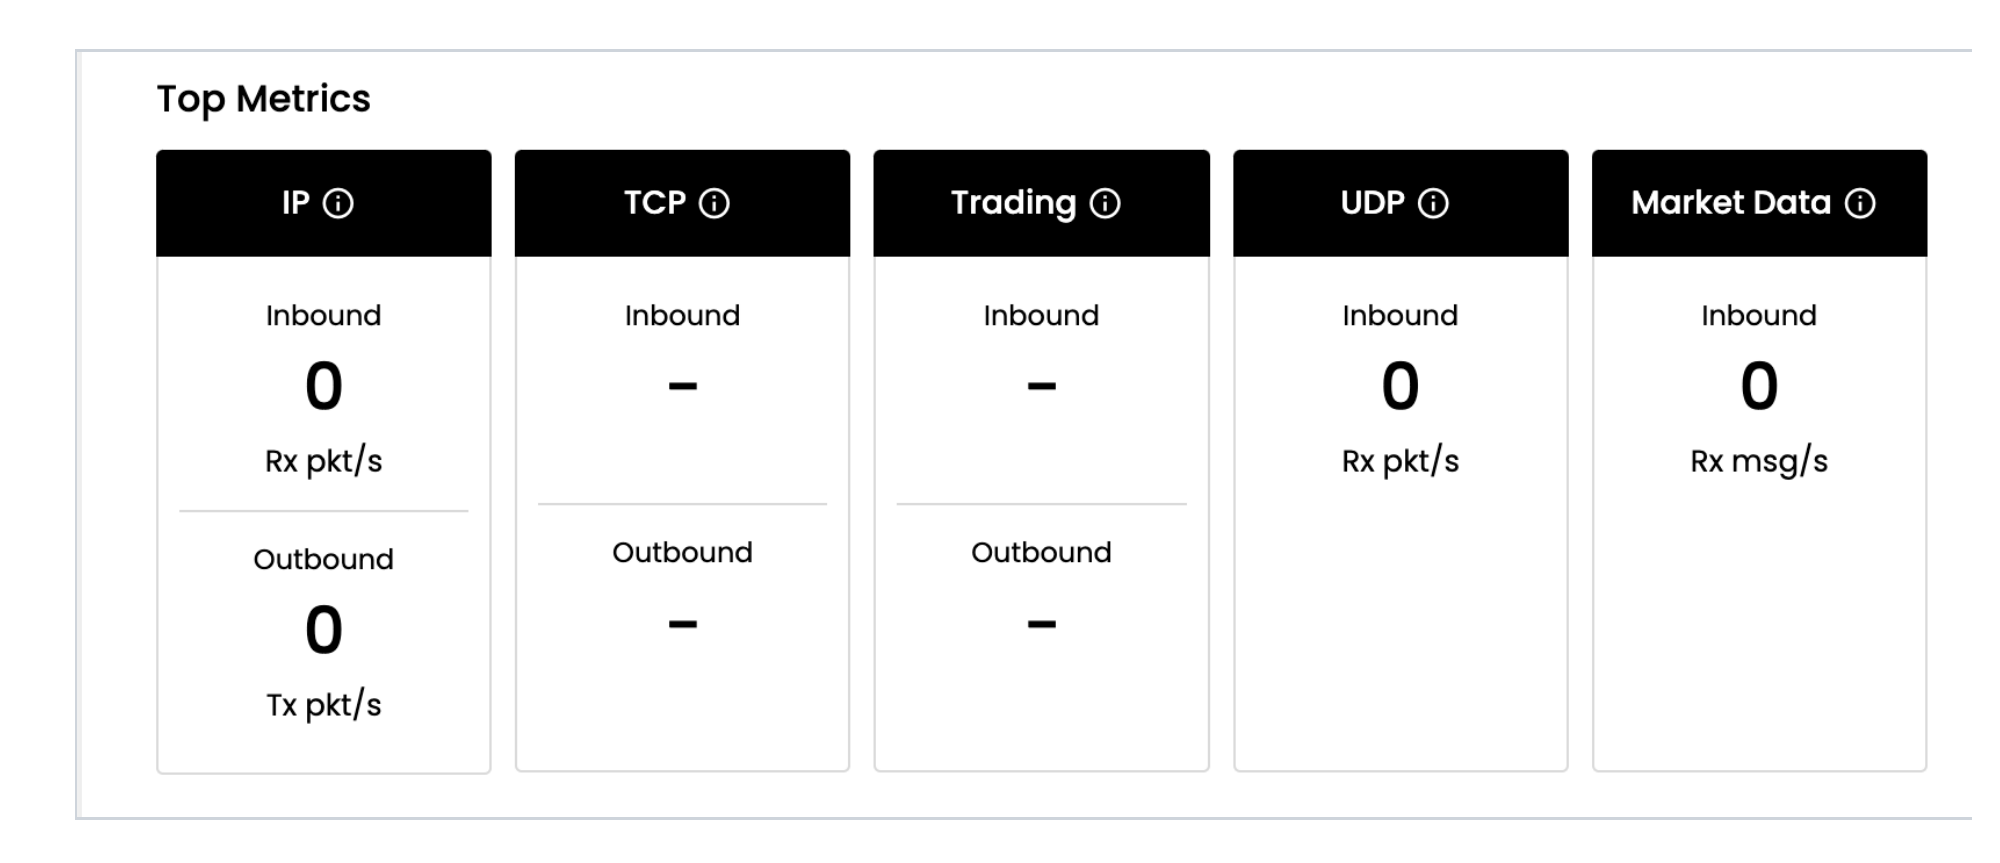
For example, in the screenshot above showing a week’s worth of data taken while the market is closed, you can see that this Group has had IP traffic inbound and outbound during that time, as well as UDP and Market Data traffic inbound. However, no TCP or Trading traffic has been seen during the time period selected.
Analytics information for a particular Availability Zone is stored in a data structure known as an Aggregator. Multiple aggregators store different types of data. The analytics-data/aggregators endpoint can be queried to discover which Aggregators are available to query for any Availability Zone that your current Portal has access to. For more information about Analytics Aggregators and the flexibility that they can provide, please review the Analytics Concepts Guide.
Tooltips
At the top of each metric in the Top Metrics section and within the Your Data Visuals below, there is a tooltip icon. Select this tooltip icon to open a modal with useful information about how that metric is captured, analysed, and calculated.
Your Data Visuals for Analytics
For each of the protocols that are monitored, you can expand to view a timeseries chart for that metric.
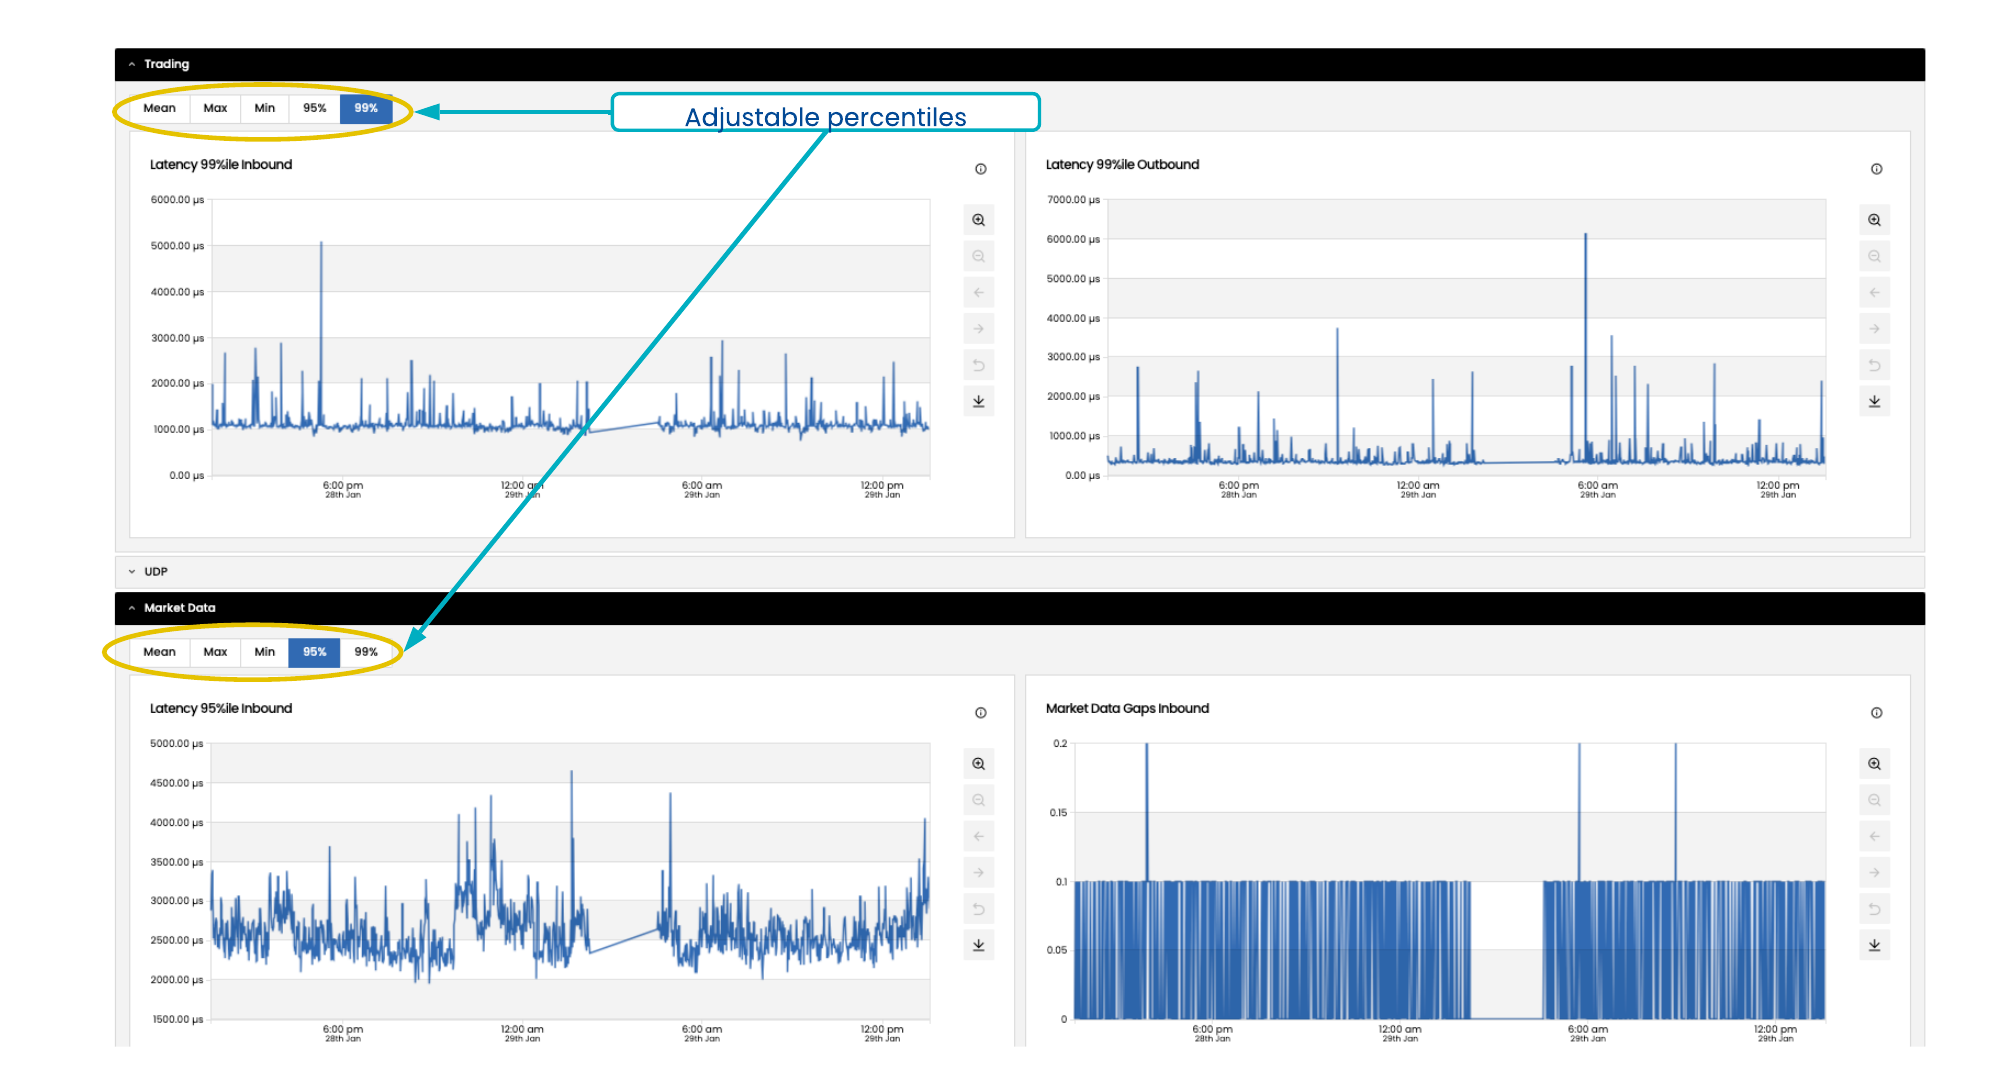
There is a separate section of the page for each different protocol. You can expand and contract these individually. This allows you to, for example, ignore Trading protocol charts if you are viewing a server that does not generate any trading traffic.
The Inbound and Outbound charts are lined up in alignment with each other (with the exception of the Market Data metrics). This allows easy visual correlation between different metrics, to help to reach the root cause for any particular issue.
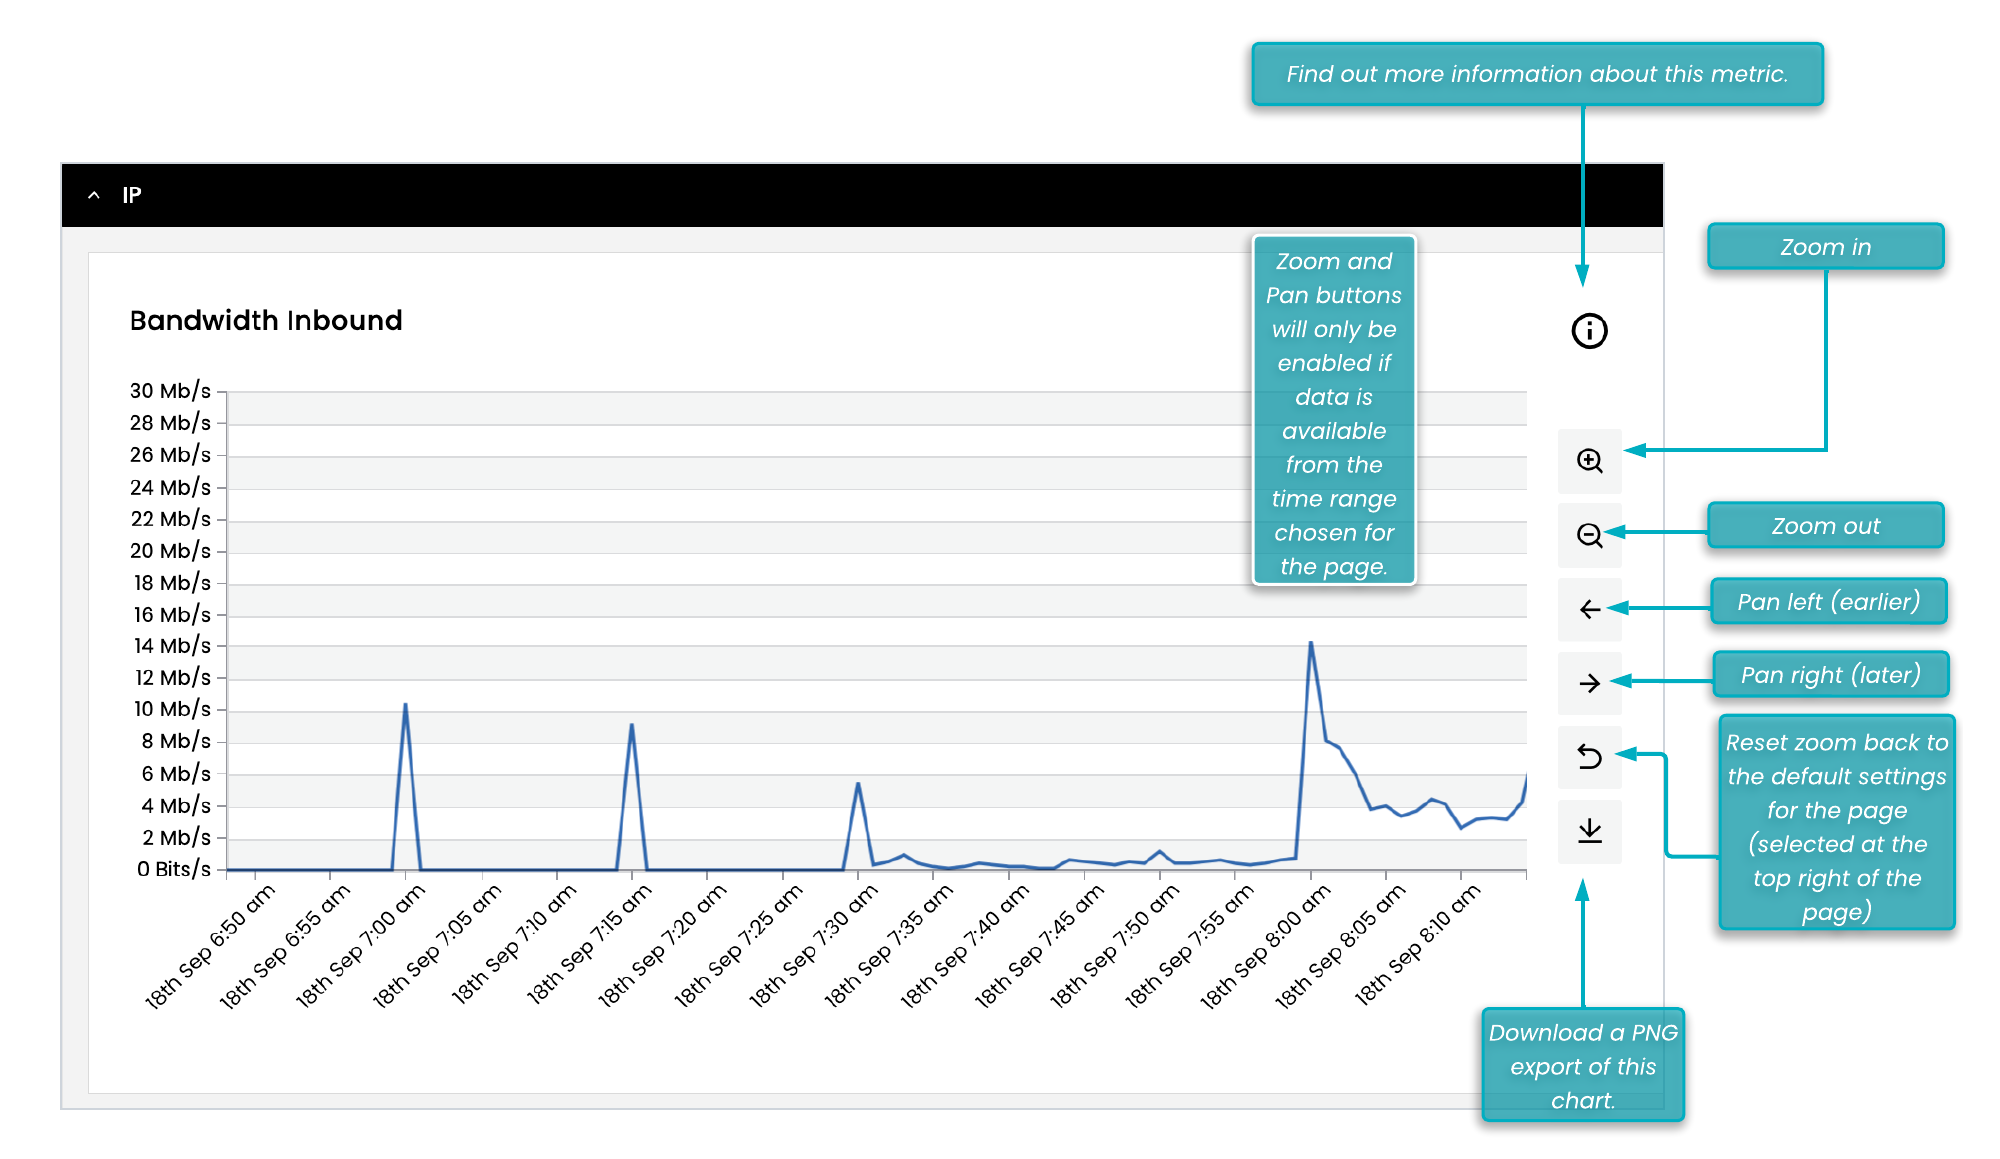
The zoom and pan buttons will only be enabled if there has been data downloaded in your current query that covers that timeframe. If you find these buttons are inactive, readjust the overall time period for the page (top right) or view the data in the Grafana UI.
If you have multiple charts open within the same section of the page, The zoom and pan operations will synchronise the timeframe chosen will be synchronised between all charts in the section.
The Trading and Market Data data visuals have a set of Percentile buttons at the top: Mean, Max, Min, 95%ile, and 99%ile. Selecting one of these updates the chart to display the selected latency percentile.
Analytics metrics are retrieved from a particular aggregator with a query like this one: analytics-data/aggregators/{aggregator_uuid}/ . A specific time period should be stated. You can choose to query an External group or Internal group (although not all Aggregators support both types of query). You can also pass the particular columns that you want to retrieve data for (you can think of these as particular metrics and the particular Aggregator fields you want (e.g. high, low, mean of each column) for each of these columns. You can also specify the Aggregator levels that can be returned. Note that the Analytics system can also be queried directly, and that querying Analytics gives you more flexiblity with the type of query that you can make.
Additional Analytics Links
Depending on your system setup, the left-hand side menu may contain additional analytics links. These may include access to download packet capture information, or to access the more granular VMX-Explorer Analytics user interface.
In Beeks Analytics, VMX-Explorer is a Grafana-based web user interface, and is where Beeks Analytics visualises the analytics provided by VMX-Analysis. VMX-Explorer is fed by the Beeks Analytics REST API.
For more information about the metrics available in Proximity Cloud and Exchange Cloud for Beeks Analytics, see the Beeks Analytics Data Guide.
For more information about VMX-Explorer, see the User Guide for VMX-Explorer.