In addition to the host-based performance metrics, the Portal can provide analytics of the wire data. This provides extra insight into the performance of your Compute Items and is available for clients that have analytics enabled for one or more Proximity Cloud or Exchange Cloud Availability Zones or for clients with Analytics as a Service. In the Portal, these users will see an Analyse item in the main menu that provides access to their analytics tools.
Our analytics are designed to enable you to see clearly and quickly if issues exist in your compute or network. For example, if you have issues with a particular Dedicated Server or trading application.
Importantly, this can also provide insight into the performance of external counterparties or datafeeds, which you are connecting to from your Portal-managed systems.
The Beeks Analytics Data Guide provides in-depth information about the Analytics that are available in Proximity Cloud.
Uses of Analytics
The Analytics information can be used to, for example:
identify whether a performance problem affecting order connections is occurring within your Portal-managed infrastructure, or outside your Portal-managed infrastructure with your trading counterparty or venue.
identify whether multicast market data that you are receiving is being received without issues, or is suffering from issues such as unexpectedly high delays or missing price updates.
draw attention to issues that are delaying trade messages from your application to your counterparties.
provide accurate measurement of microbursts. Microbursts are concentrated bursts of traffic on the wire that an application itself cannot detect but which can cause data delays or loss if left unmanaged. Measurement of microbursts can also inform application scaling decisions (can an existing host be allocated more traffic, or do extra hosts need to be added in order to spread the traffic out across multiple hosts).
Accessing Analytics
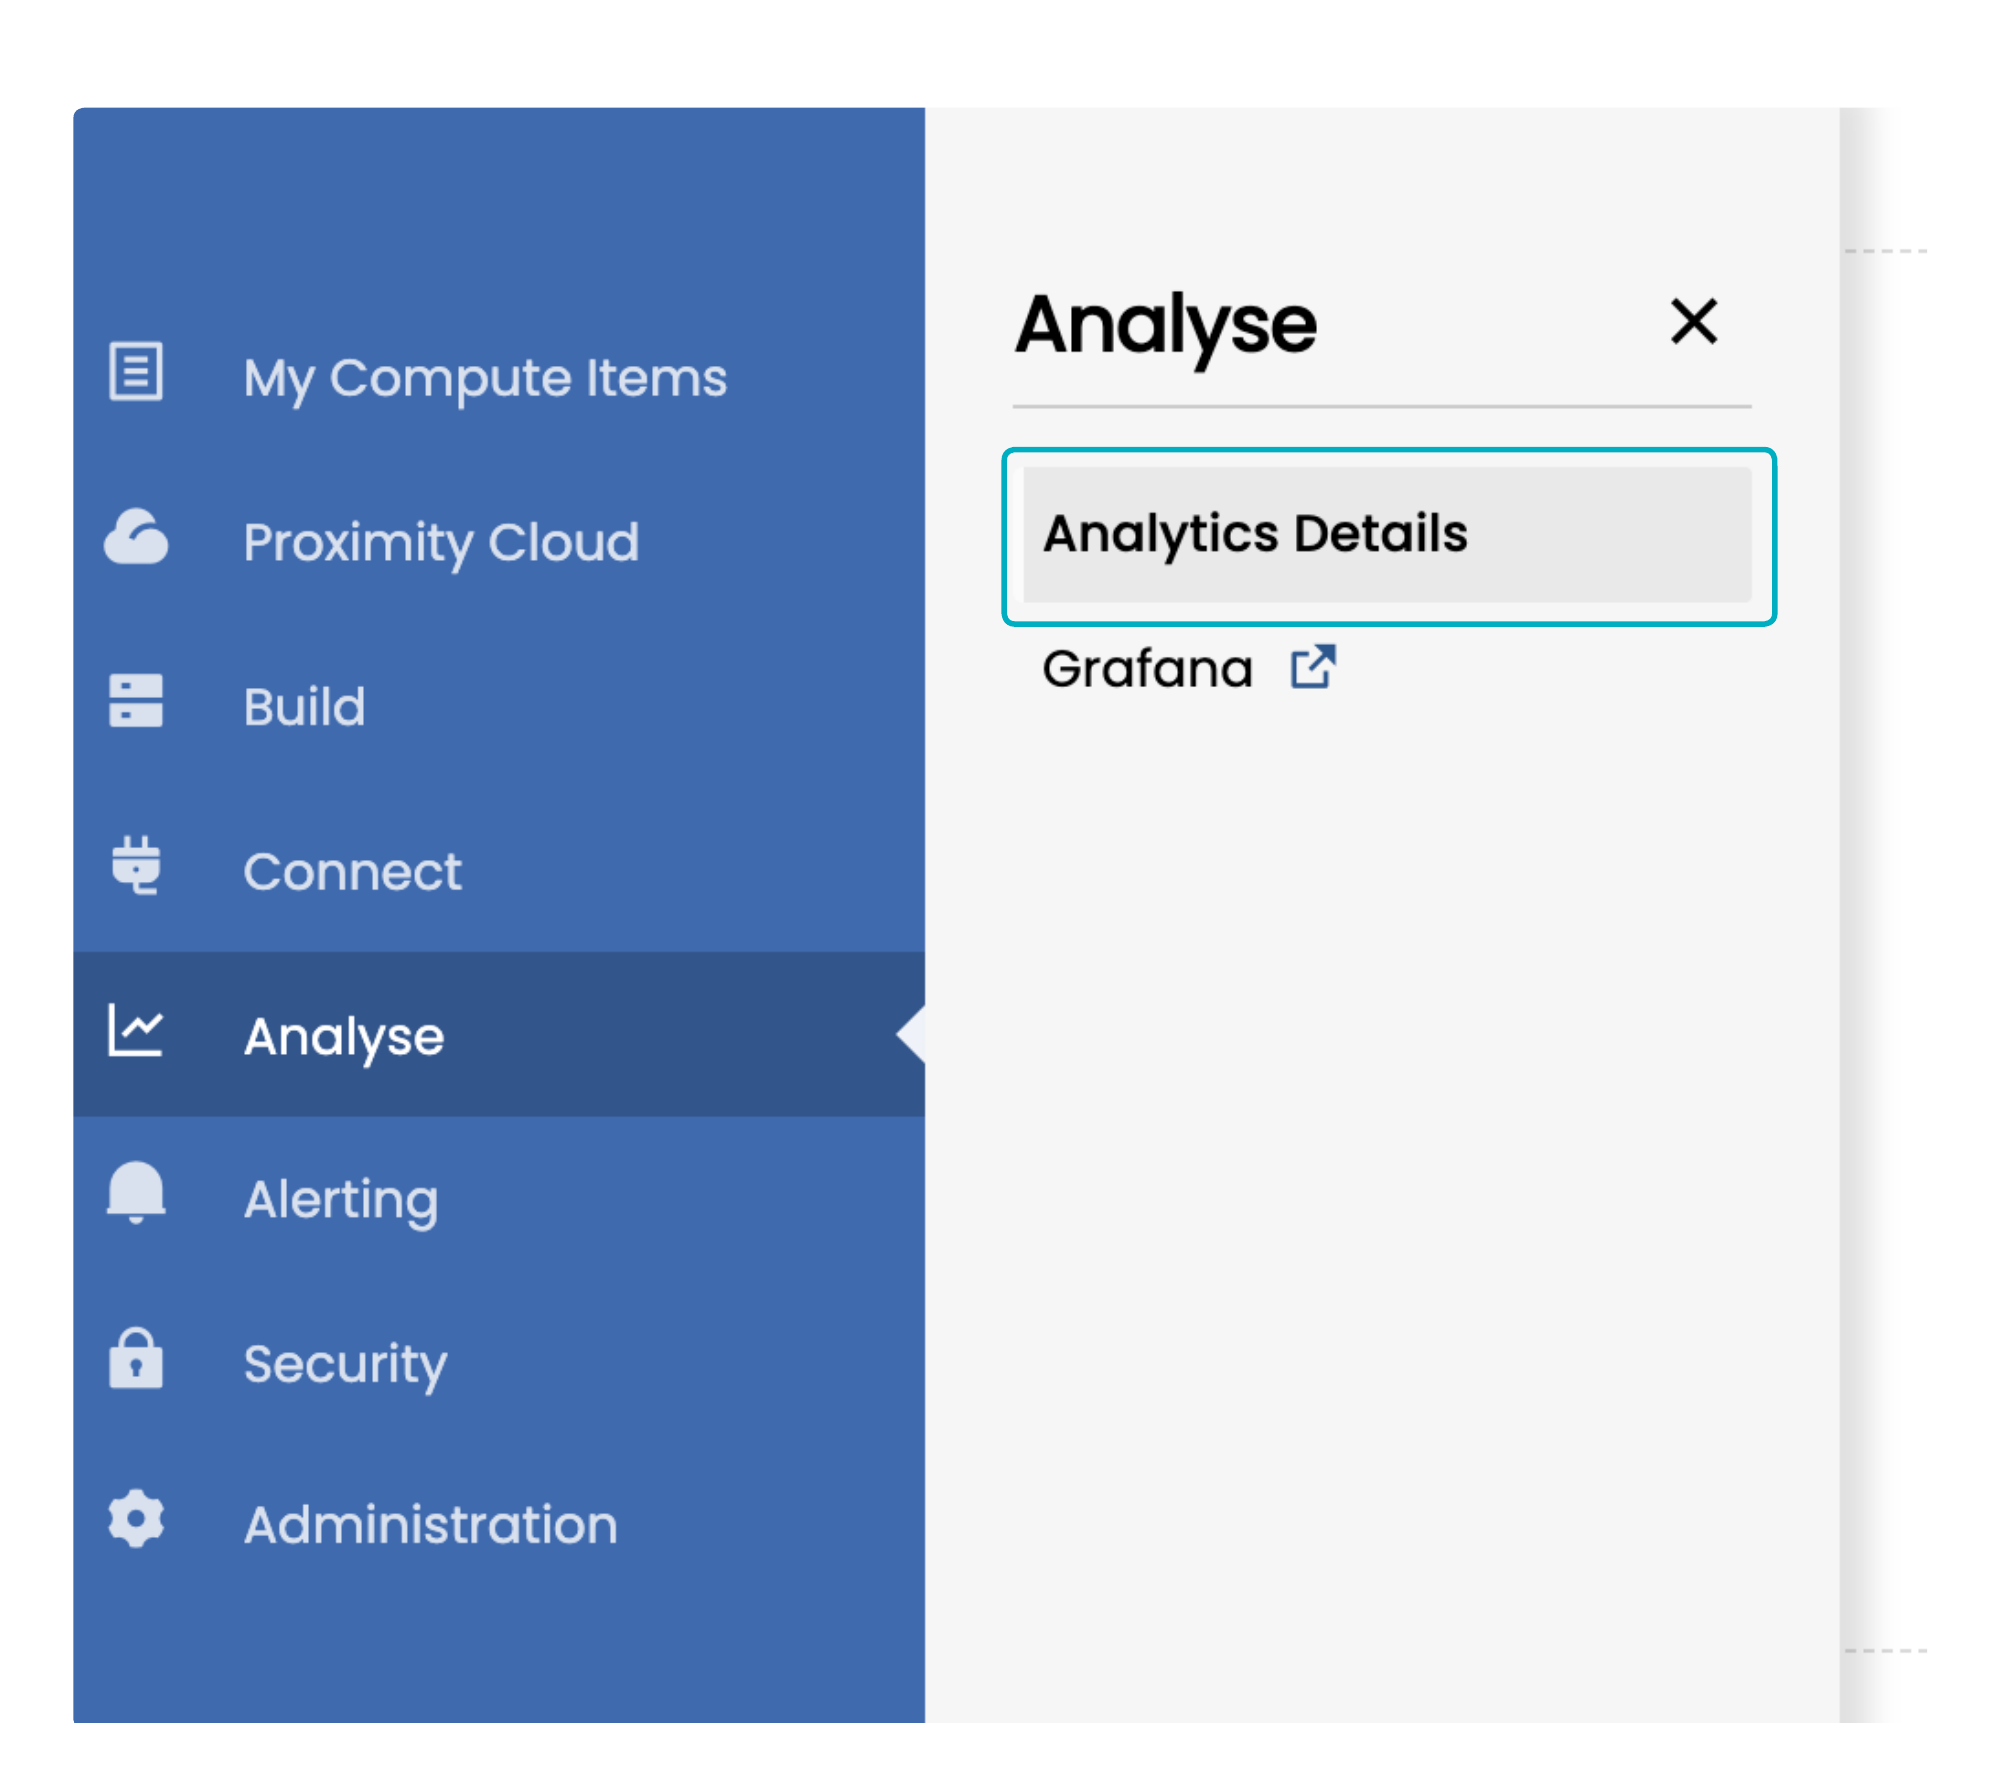
If Analytics are enabled for any of the devices in your Portal, you will have an Analyse menu option on the left hand side.
If you do not have the Analyse option displaying in your Portal menu, but you wish to have Analytics enabled for some of your Compute Items, contact your Portal Support team to discuss enabling Analytics.
The Analytics Details menu item in the Analyse menu means that you have Analytics enabled within the Portal for one or more Proximity Cloud or Exchange Cloud Availability Zones.
You can view Proximity Cloud/Exchange Cloud Analytics in three ways:
The Analytics Details page in the Portal. To access, select Analyse > Analytics Details in the main menu.
The Performance Metrics page for a Dedicated Server in the Portal.
Direct access to VMX-Explorer. VMX Explorer is Beeks Analytics' sophisticated analytics, monitoring, and visualisation tool. VMX Explorer provides access to packet captures, increased display flexibility, and access to more metrics than are available in the Portal.
If required, the Beeks team can include a link to VMX-Explorer in the Analyse menu in the Portal. For example, the Grafana link in the screenshot above.
User accounts on VMX-Explorer are managed by Beeks. Please raise a support ticket with Beeks using the portal to add or remove VMX-Explorer user accounts.
To learn more about VMX Explorer, please read the Beeks Analytics for Markets User Guide. In particular, the Traffic Stats dashboards provide equivalent data to the analytics information that you can view in the portal. But you can also view packet captures as well as more granular information on the other metrics.
Some clients will have access to Analytics as a Service which is a separate application dedicated to displaying client analytics at a particular location. If you have access to Analytics as a Service, you’ll be able to access the analytics for your locations via links in the Analyse menu in the Portal. For more details of the Analytics as a Service functionality, contact the Portal Support team. This guide covers use of Analytics for Dedicated Servers and for market data connections within Proximity Cloud Availability Zones.
The table below summarises the metrics available in the Performance Metrics view that is accessible from My Compute Items, the Analyse > Analytics Details page, and in VMX-Explorer for Beeks Analytics for Markets.
Note that:
Metrics for External Groups are in the Analytics Details page in the Portal or in VMX-Explorer.
Metrics for Market data or UDP for a specific Dedicated Server are in Analytics Details in the Portal or VMX-Explorer.
Category | Metrics | Performance Metrics (for a DS) in Portal | Analytics tab for a Compute Item in Portal | Analytics Details in Portal | VMX-Explorer (Beeks Analytics for Markets) |
|---|---|---|---|---|---|
Network | % CPU Utilisation | YES | |||
% Memory Utilisation | YES | ||||
Disk Throughput (Total Mbps) | YES | ||||
Disk IOPS (Total) | YES | ||||
Network traffic in (Mbps) | YES | ||||
Network traffic out (Mbps) | YES | ||||
Packet Capture | YES | ||||
Bandwidth | YES | YES | |||
Packets per second | YES | YES | |||
TCP loss measured by retransmissions | YES | YES | |||
Microburst | YES | YES | |||
TCP zero window | YES | ||||
TCP round trip time | YES | ||||
TCP & UDP conversion count | YES | ||||
Trading protocol | App to Wire one-way latency (inbound and outbound) | YES | YES | ||
Messages per second | YES | YES | |||
Trading protocol conversation count | YES | ||||
Order-to-Ack round trip latency | YES | ||||
Market Data protocol | App to wire one-way latency (measured inbound into the Proximity Cloud rack) | YES | |||
Market data sequence gaps | YES | ||||
Messages per second | YES | ||||
Market data conversation count | YES | ||||
Out of sequence message count | YES |