As mentioned, you can view Analytics for a Dedicated Server from the Analytics Details page.
This can be done by selecting the Internal Group tab of the Metric Setting dialog. All Dedicated Servers with Analytics in that Availability Zone will be available for display.
The only significant different between Dedicated Server metrics and External Group metrics is that UDP and Market Data statistics are not broken down per Dedicated Server - these are only broken down by External Group. (In VMX-Explorer, you can access even more detailed breakdowns, by market,
Another easy way to access analytics for a particular server is from the Analytics tab on the My Compute Items page.
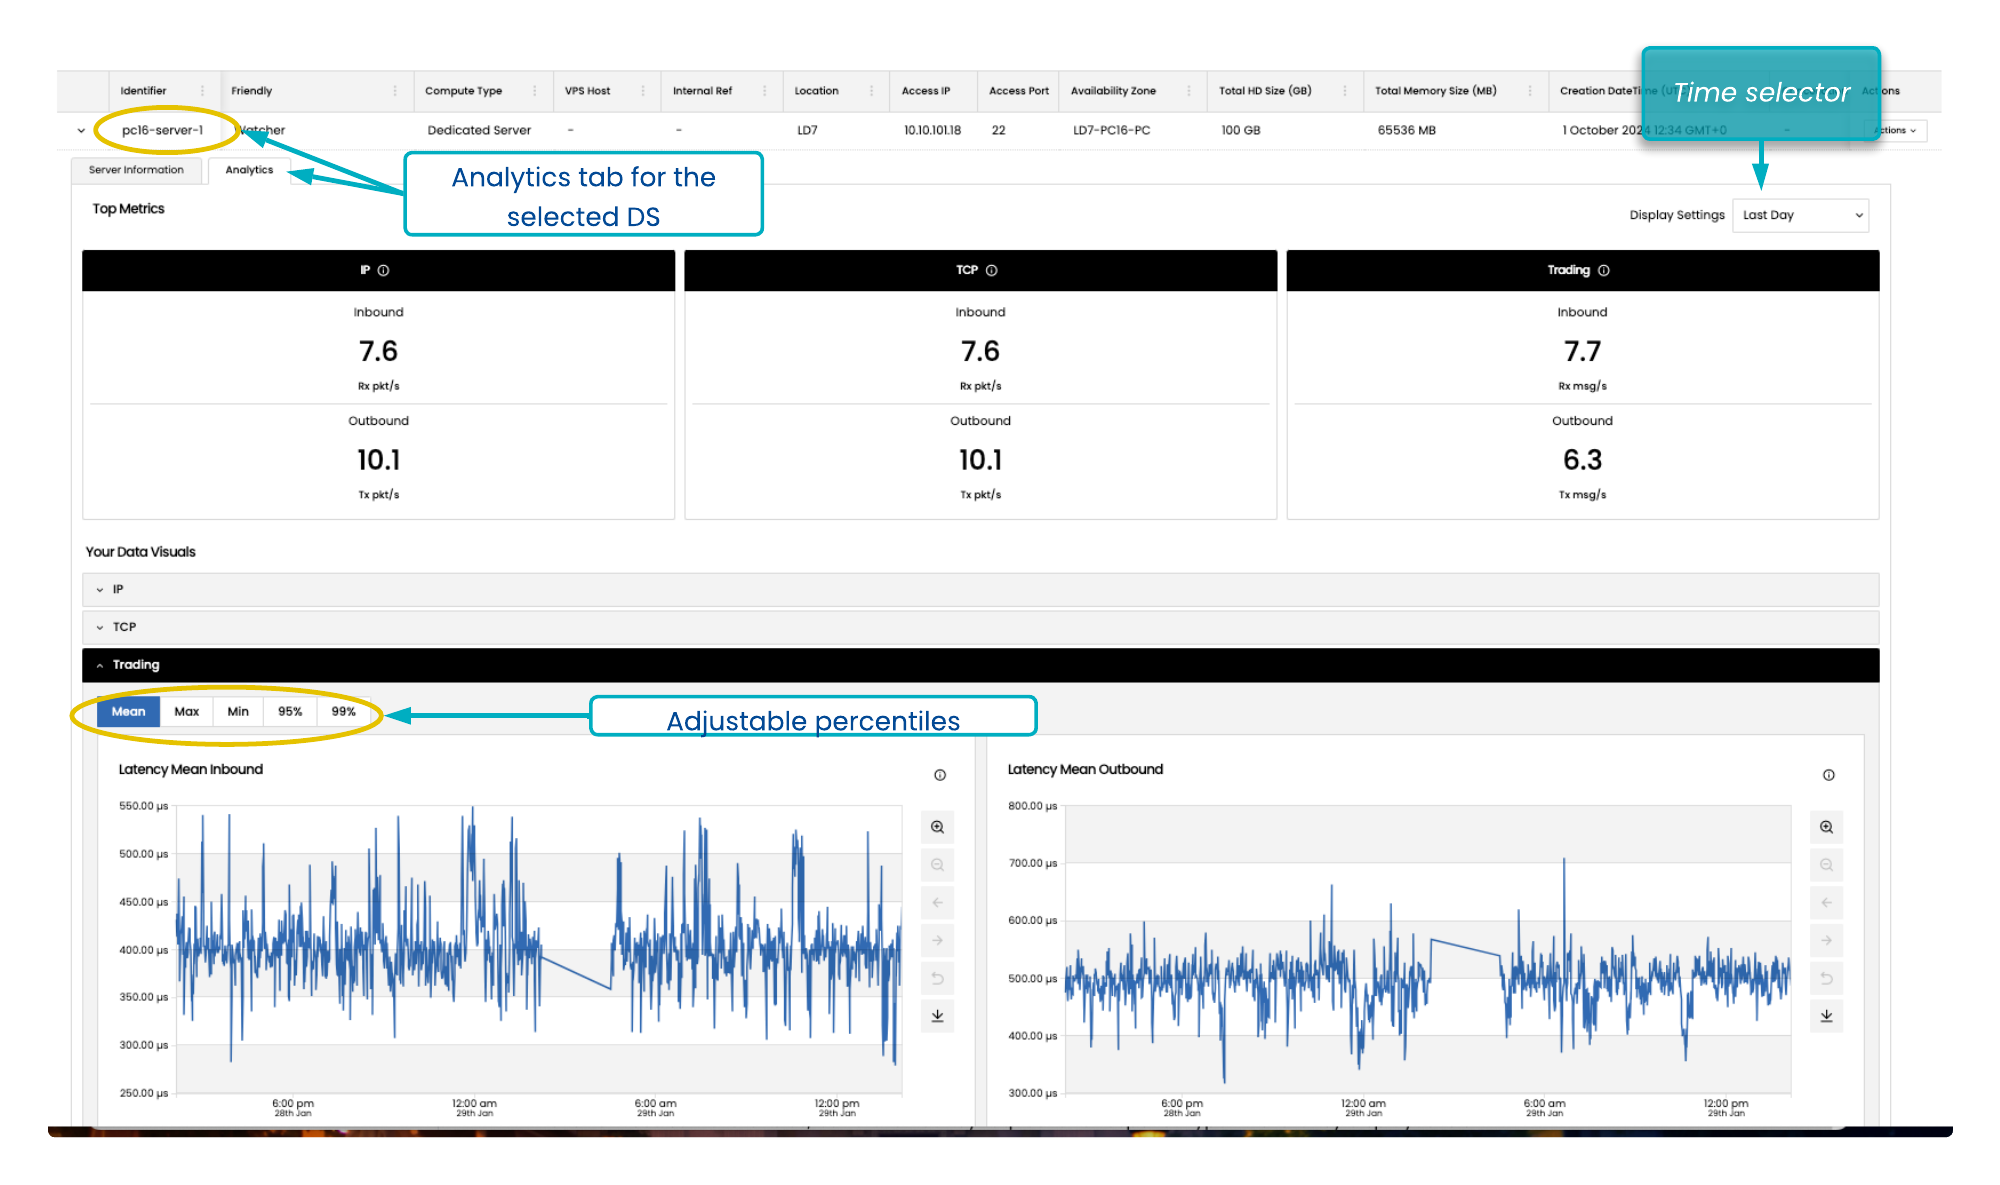
You can use the time selector at the top right to adjust the time period to view a different time period for the metrics.
See Analytics Details for more details of the Analytics metrics that are available and how to use the charts on this page.