Analytics systems have the concept of one or more Visibility Points. These are the points in your network at which traffic is observed and captured.
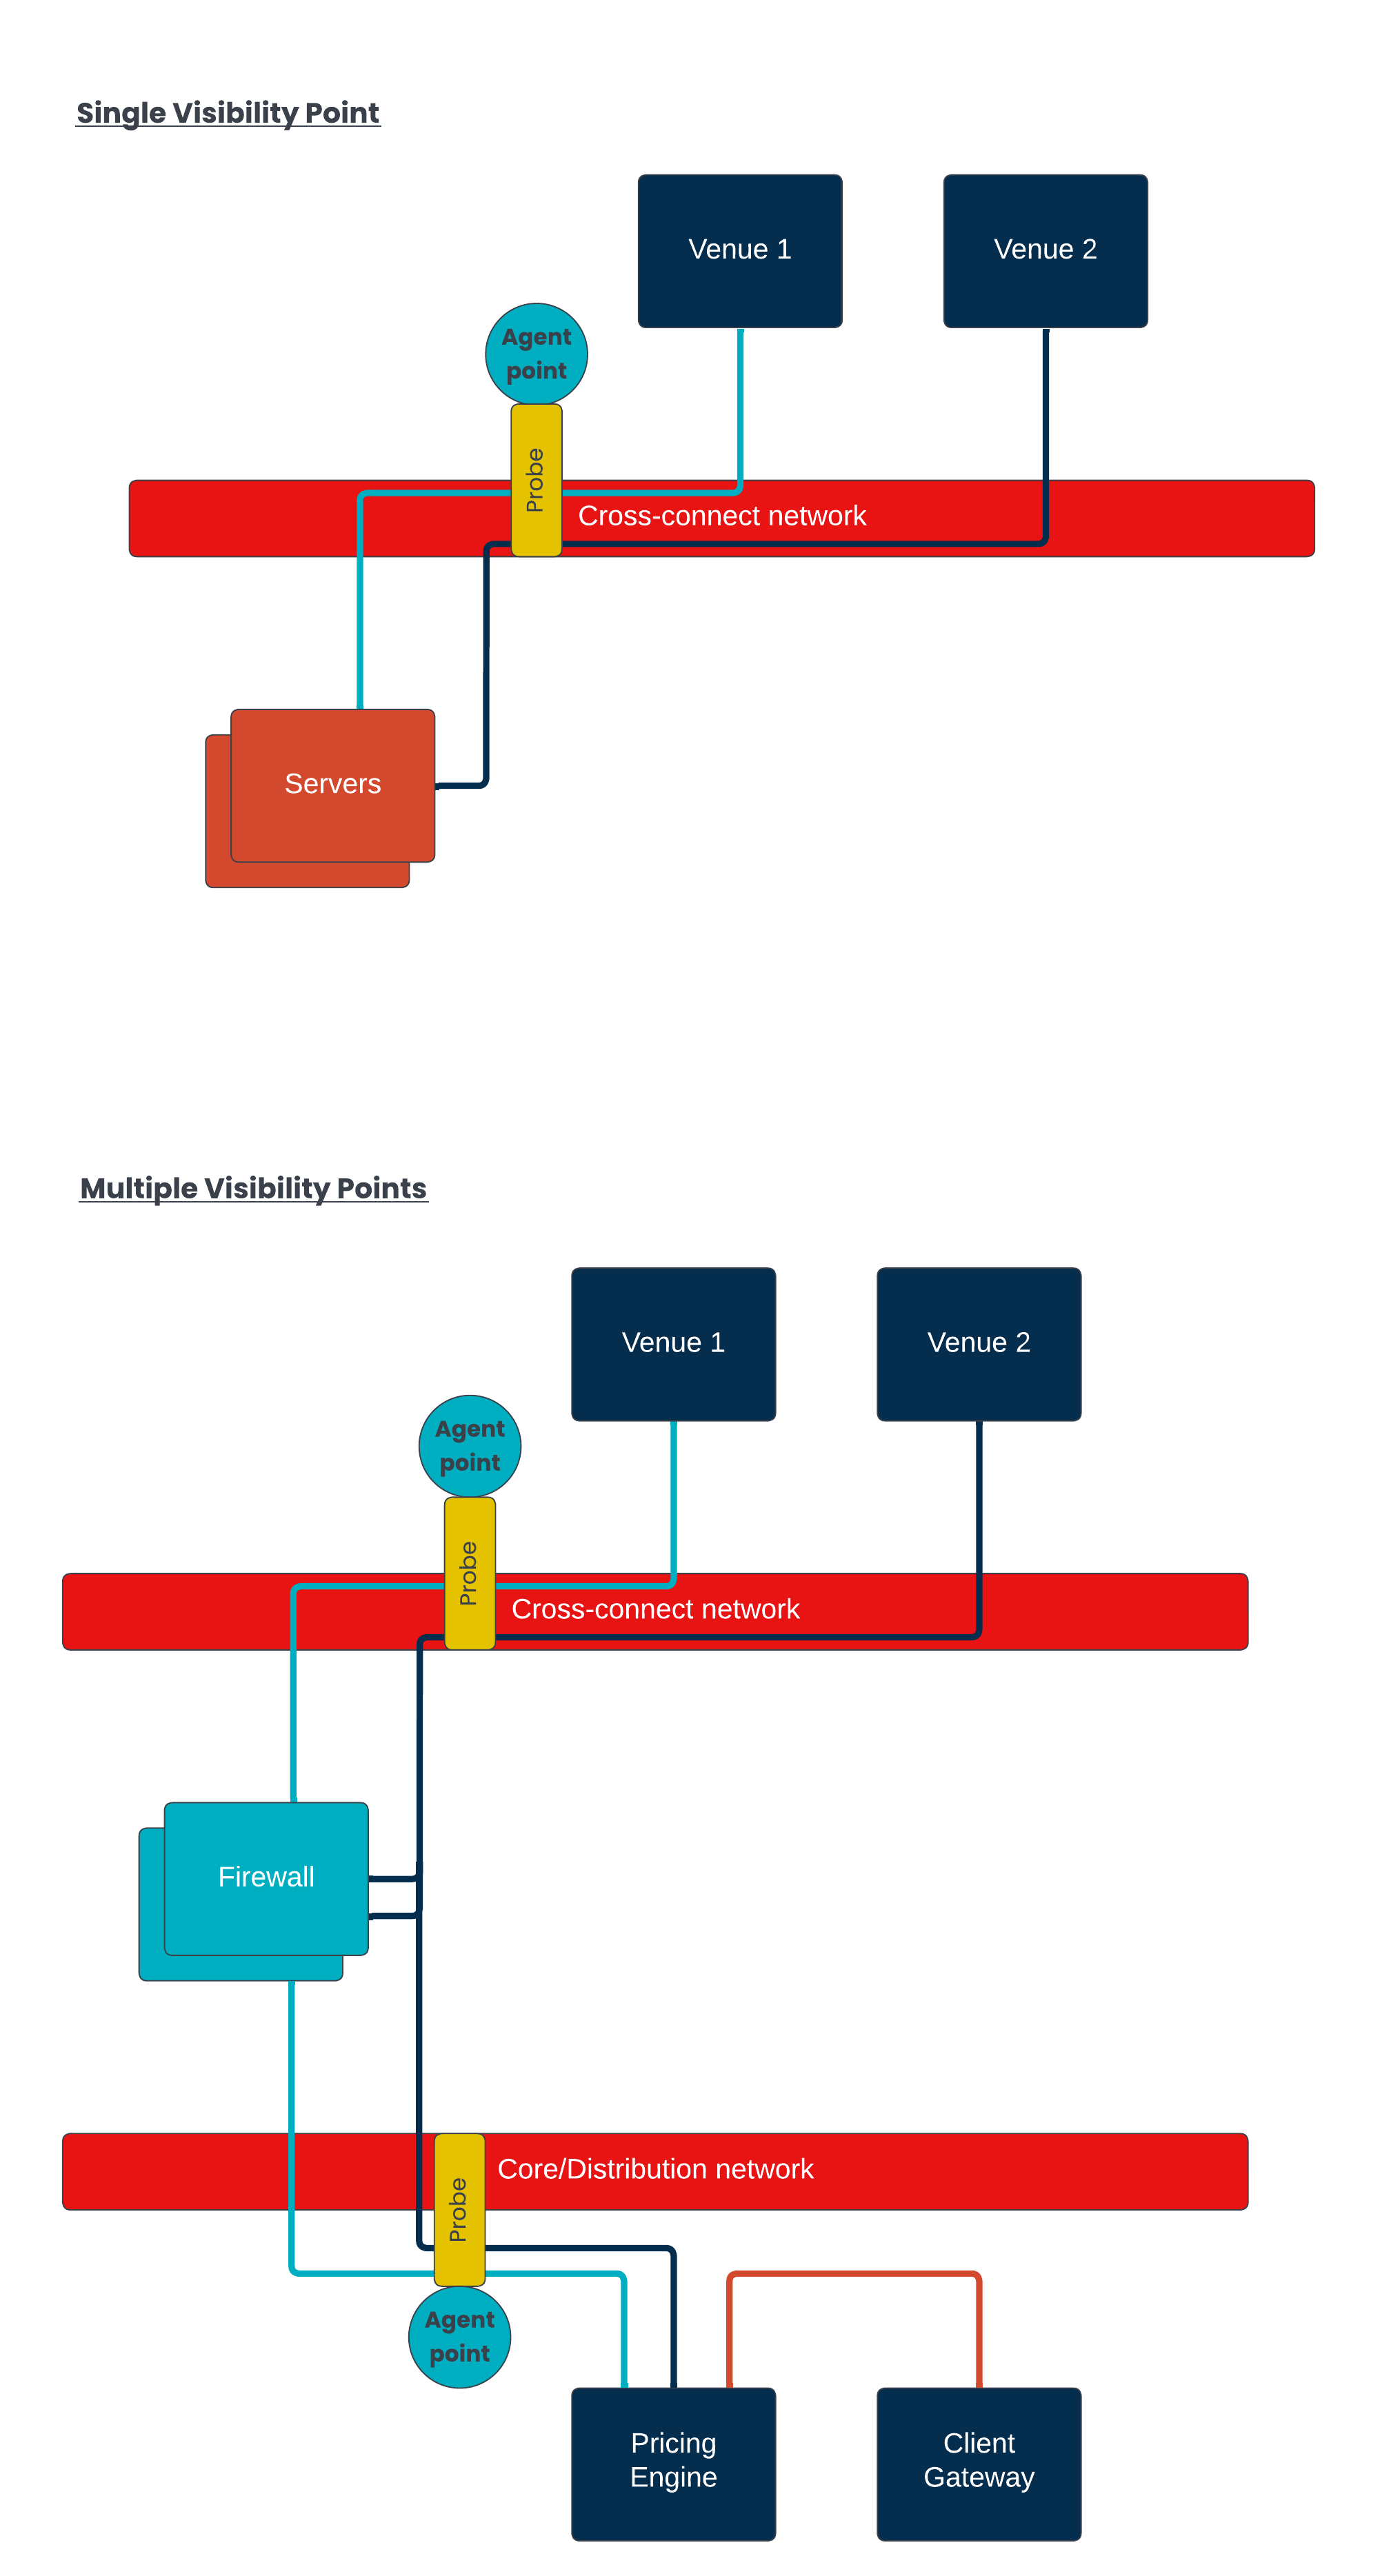
The standard Proximity Cloud deployment of analytics is a Single Visibility Point system. This means there is a single place in your Proximity Cloud network where this data is captured.
Portal analytics can be scaled up to provide a full multiple visibility point customisable analytics system in a more heavily tailored Beeks Analytics Enterprise system. Talk to your Portal Support team and/or Sales contacts directly to learn more about how you can extend the Portal’s Analytics solution.
The Proximity Cloud low latency trading switch is the single visibility point that is used to capture and analyse data for the Analytics system. Specific ports on this switch are configured to mirror traffic to the Analytics server. The application interfaces of the Dedicated Servers are cabled directly to the low latency switch. The virtualisation servers are cabled to this switch indirectly.
The exact placement of the visibility point may vary for different Proximity Cloud deployments, depending on a number of factors. Contact your Portal Support team for exact information that is tailored to your deployment.
Deploying Analytics as a single visibility point system makes the analytics simpler to configure and deploy, and also easier to understand in order to inform business decisions.
For example, by providing a consistent framework that enables us to understand where in the network a particular analytics metric is recorded, we can reliably organise conversation endpoints into either an Internal Group or an External Group. A conversation endpoint is typically an IP address.
The benefit of this kind of grouping is that is provides an easy reference point for understanding multiple wiretime (and other) metrics.
Which metrics are available in Analytics for Proximity Cloud
The following diagram shows a typical Analytics deployment for a Proximity Cloud. This shows that some metrics are captured bidirectionally, and some metrics are captured unidirectionally.
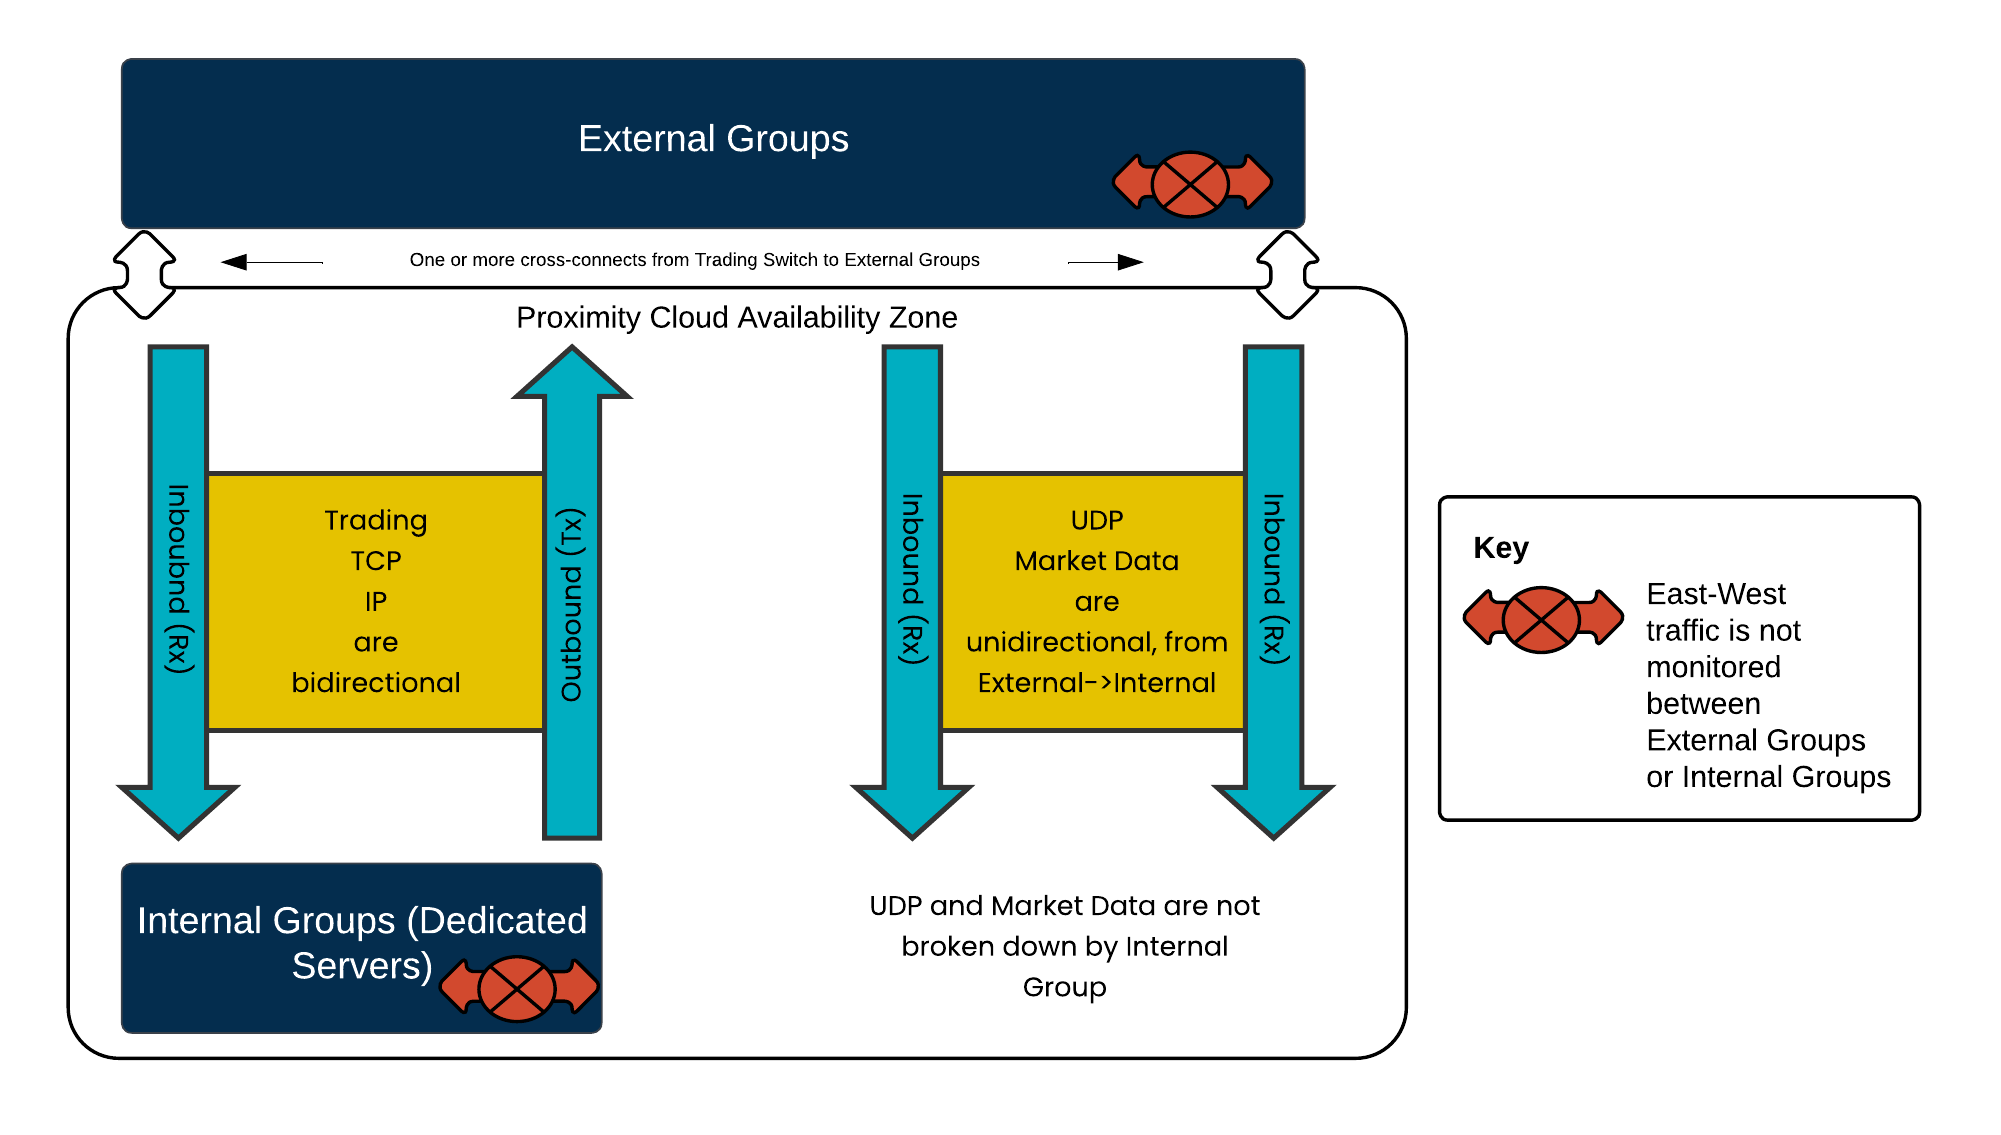
Note that for multicast market data, we cannot capture exactly which Dedicated Servers are receiving this data. As a result, Market Data metrics are only broken down by External Group. UDP statistics are treated the same way as the majority of UDP in a trading environment is often multicast traffic. Market Data and UDP metrics cannot be broken down by Internal Group.
For more detailed information on Internal Groups, External Groups, and on which metrics are available as part of the Analytics for Proximity Cloud, Exchange Cloud or Beeks Analytics as a Service, please see the Beeks Analytics Data Guide.