Purpose
The Market Data Gap Stats - Anomaly Expansion dashboard provides a breakdown of gaps and gap alerts in Market data feeds.
This dashboard complements the Market Data Gap Stats dashboard by providing an overview of gaps across all Visibility Points and External Groups.
Dashboard overview
Get an overview of all gaps occurring on your monitored infrastructure, and get granular information about which specific gaps.
Usage instructions
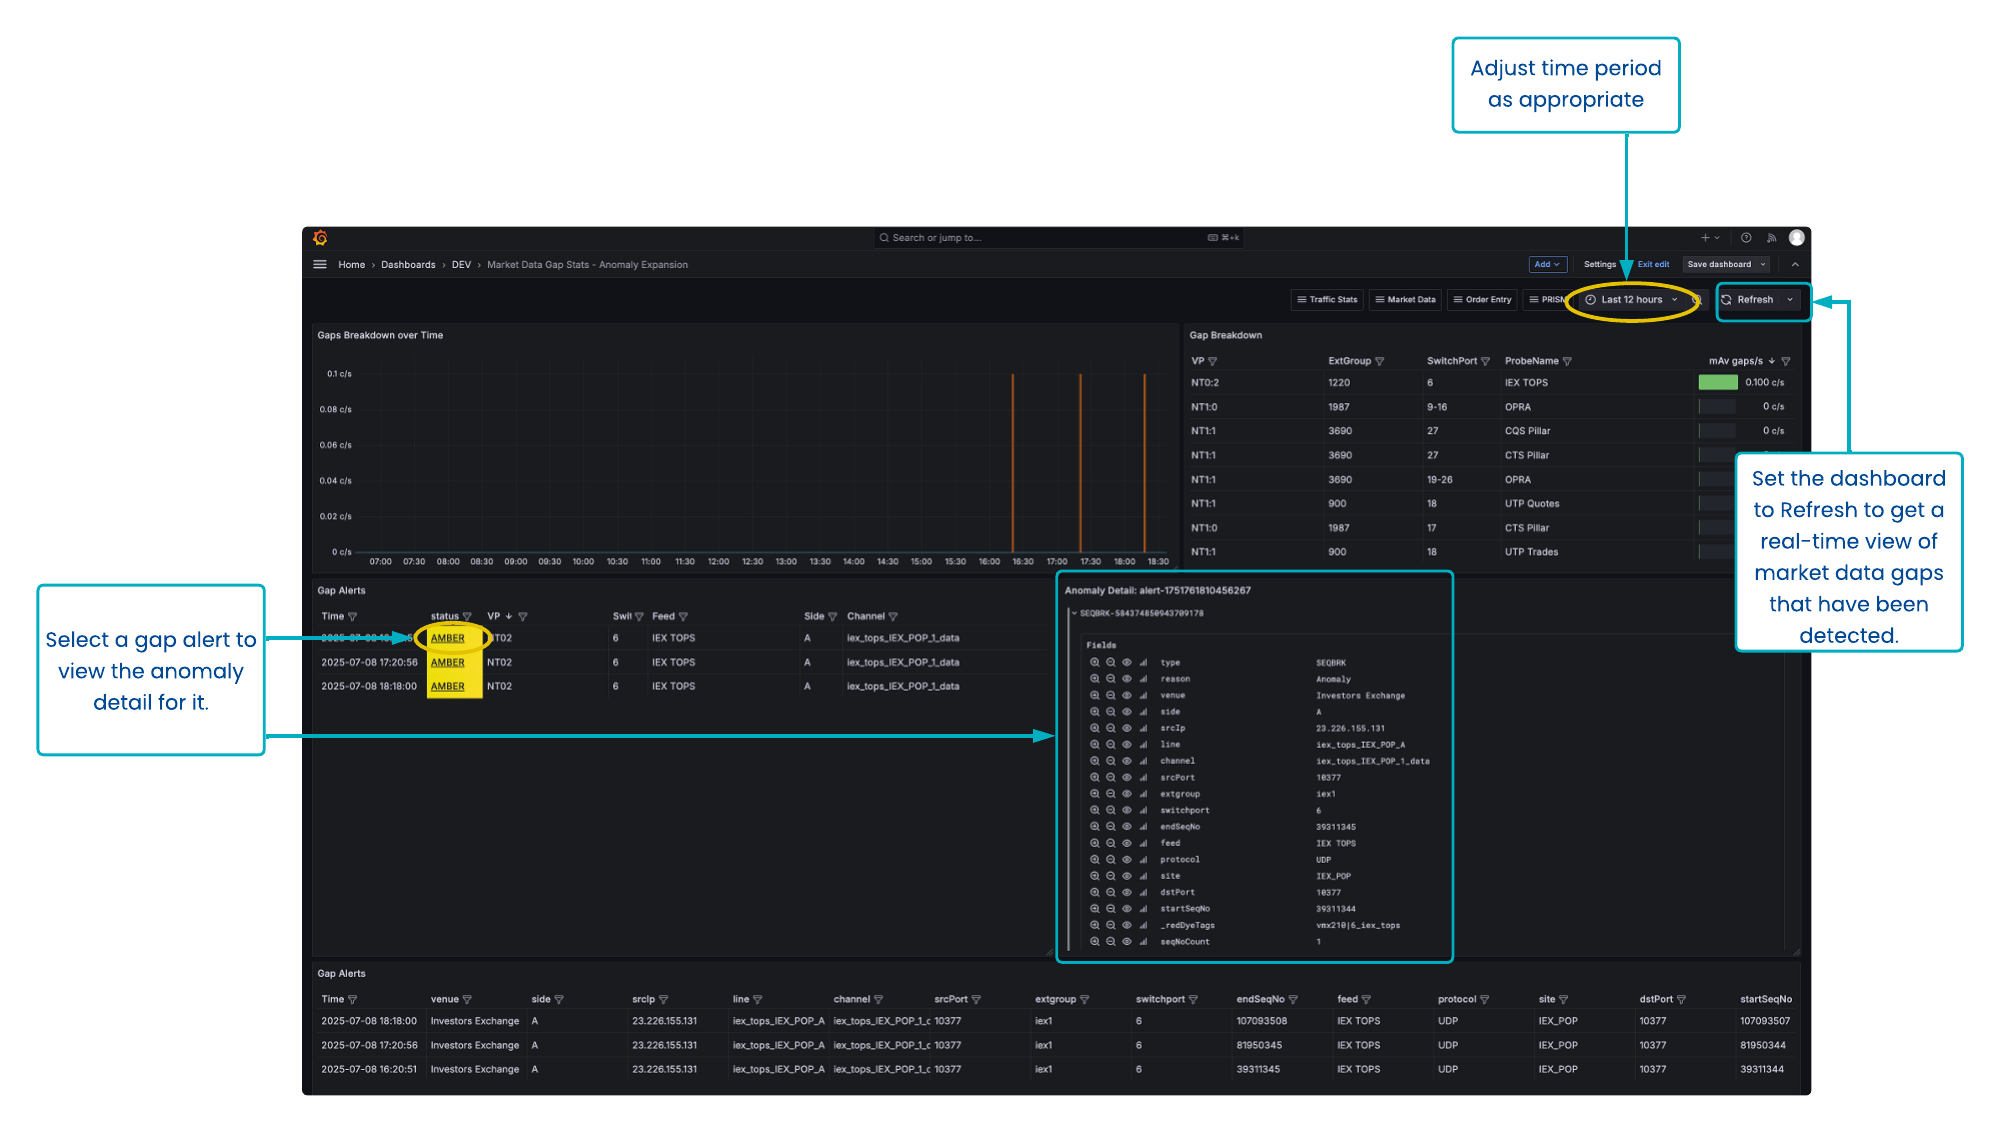
Select the time period from the Time Picker at the top.
Set the Time Picker to ‘Last X [period of time]’ and set the dashboard to regularly refresh in order to have an operational alerting dashboard which shows all market data gaps that are occurring on the infrastructure.
If gaps are displayed in the Gaps Breakdown over Time chart, mouseover the series to confirm which feed is affected, or cross-reference the value on the y-axis with the ‘mAv gaps/s’ column in the adjacent Gap Breakdown table.
Expand or maximise the Gap Alerts panel at the bottom to view details of all gaps that are occurring in the given time period.
To view the specific sequence information about gaps, click on the status of that alert in the middle Gap Alerts table. The granular information for that gap will be displayed in the Anomaly Detail panel.
Alternatively, all granular information about all gaps is displayed in the bottom Gap Alerts table.
Customisation options
In the table panels, use the panel filter and sort options to display information just for the feeds/channels/sides you are interested in.
Panel overview
The panels represent:
Gaps breakdown over time.
Gap breakdown.
Gap Alerts.
Anomaly Detail - will display specific sequence information about a gap alert that is shown in the middle Gap Alerts panel.
Gap Alerts - will display granular information about all gaps detected in the dashboard time period.