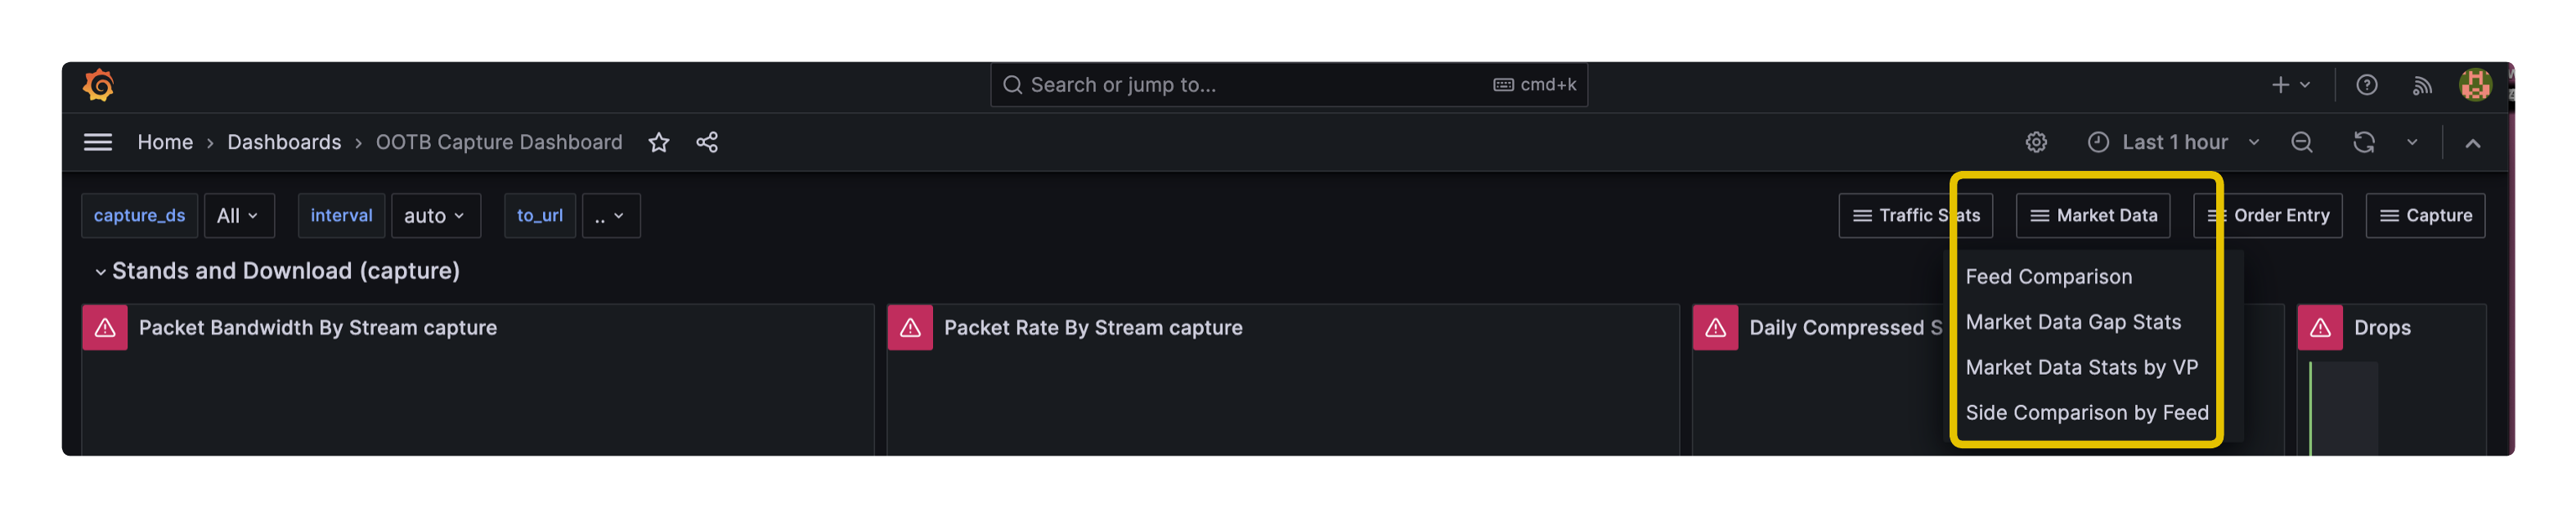
To access the Market Data dashboards in VMX-Explorer, open any dashboard, select Market Data from the shortcuts, and choose a dashboard from the list (there are alternative ways to access dashboards here).
Market Data dashboards have the following fields:
Field name | Description |
|---|---|
All | Show all options on the dashboard. |
Convs | For TCP, this is the total number of TCP conversations observed at the Visibility Point is calculated and recorded every 10 seconds. |
mAv packets/s | The average rate at which packets are being observed at the Visibility Point. The rate is calculated and recorded every 10 seconds. |
1ms Burst Packet Rate | Average rate at which packets are observed at the Visibility Point in 1ms burst rate. |
10ms Burst Packet Rate | Average rate at which packets are observed at the Visibility Point in 10ms burst rate. |
100ms Burst Packet Rate | Average rate at which packets are observed at the Visibility Point in 100ms burst rate. |
1s Burst Packet Rate | Average rate at which packets are observed at the Visibility Point in 1 second burst rate. |
bandwidth (Mbit) | Bandwidth in Mbit. |
1ms Burst Bandwidth | Moving average bandwidth observed at the Visibility Point in 1ms burst rate. |
10ms Burst Bandwidth | Moving average bandwidth observed at the Visibility Point in 10ms burst rate. |
100ms Burst Bandwidth | Moving average bandwidth observed at the Visibility Point in 100ms burst rate. |
1s Burst Bandwidth | Moving average bandwidth observed at the Visibility Point in 1s burst rate. |
mAv msgs/s | Moving average message rate per second. |
mAv gaps/s | Moving average gap rate per second. |
mAv oos/s | Moving average of out-of-sequence packets per second. |
mAv wiretime | Moving average wiretime in microseconds. |
50% Wiretime | 50th percentile wiretime in microseconds. |
95% Wiretime | 95th percentile wiretime in microseconds. |
99% Wiretime | 99th percentile wiretime in microseconds. |
mMin wiretime | Moving minimum wiretime in microseconds. |