For more details of how the Stack Probe performance affects the Performance Benchmarks, and the assumptions behind each benchmark, please see the following sections:
This section introduces the key concepts of the Stack Probe, for readers who aren’t familiar yet. This knowledge is useful to understand the different benchmarks in more depth.
Stack probe introduction
Stack probes are probes that run decodes of packets. They contain a series of modules that form the decoder stack. They can also transform the data, and publish it as derived statistics from the data that is decoded or as individual messages.
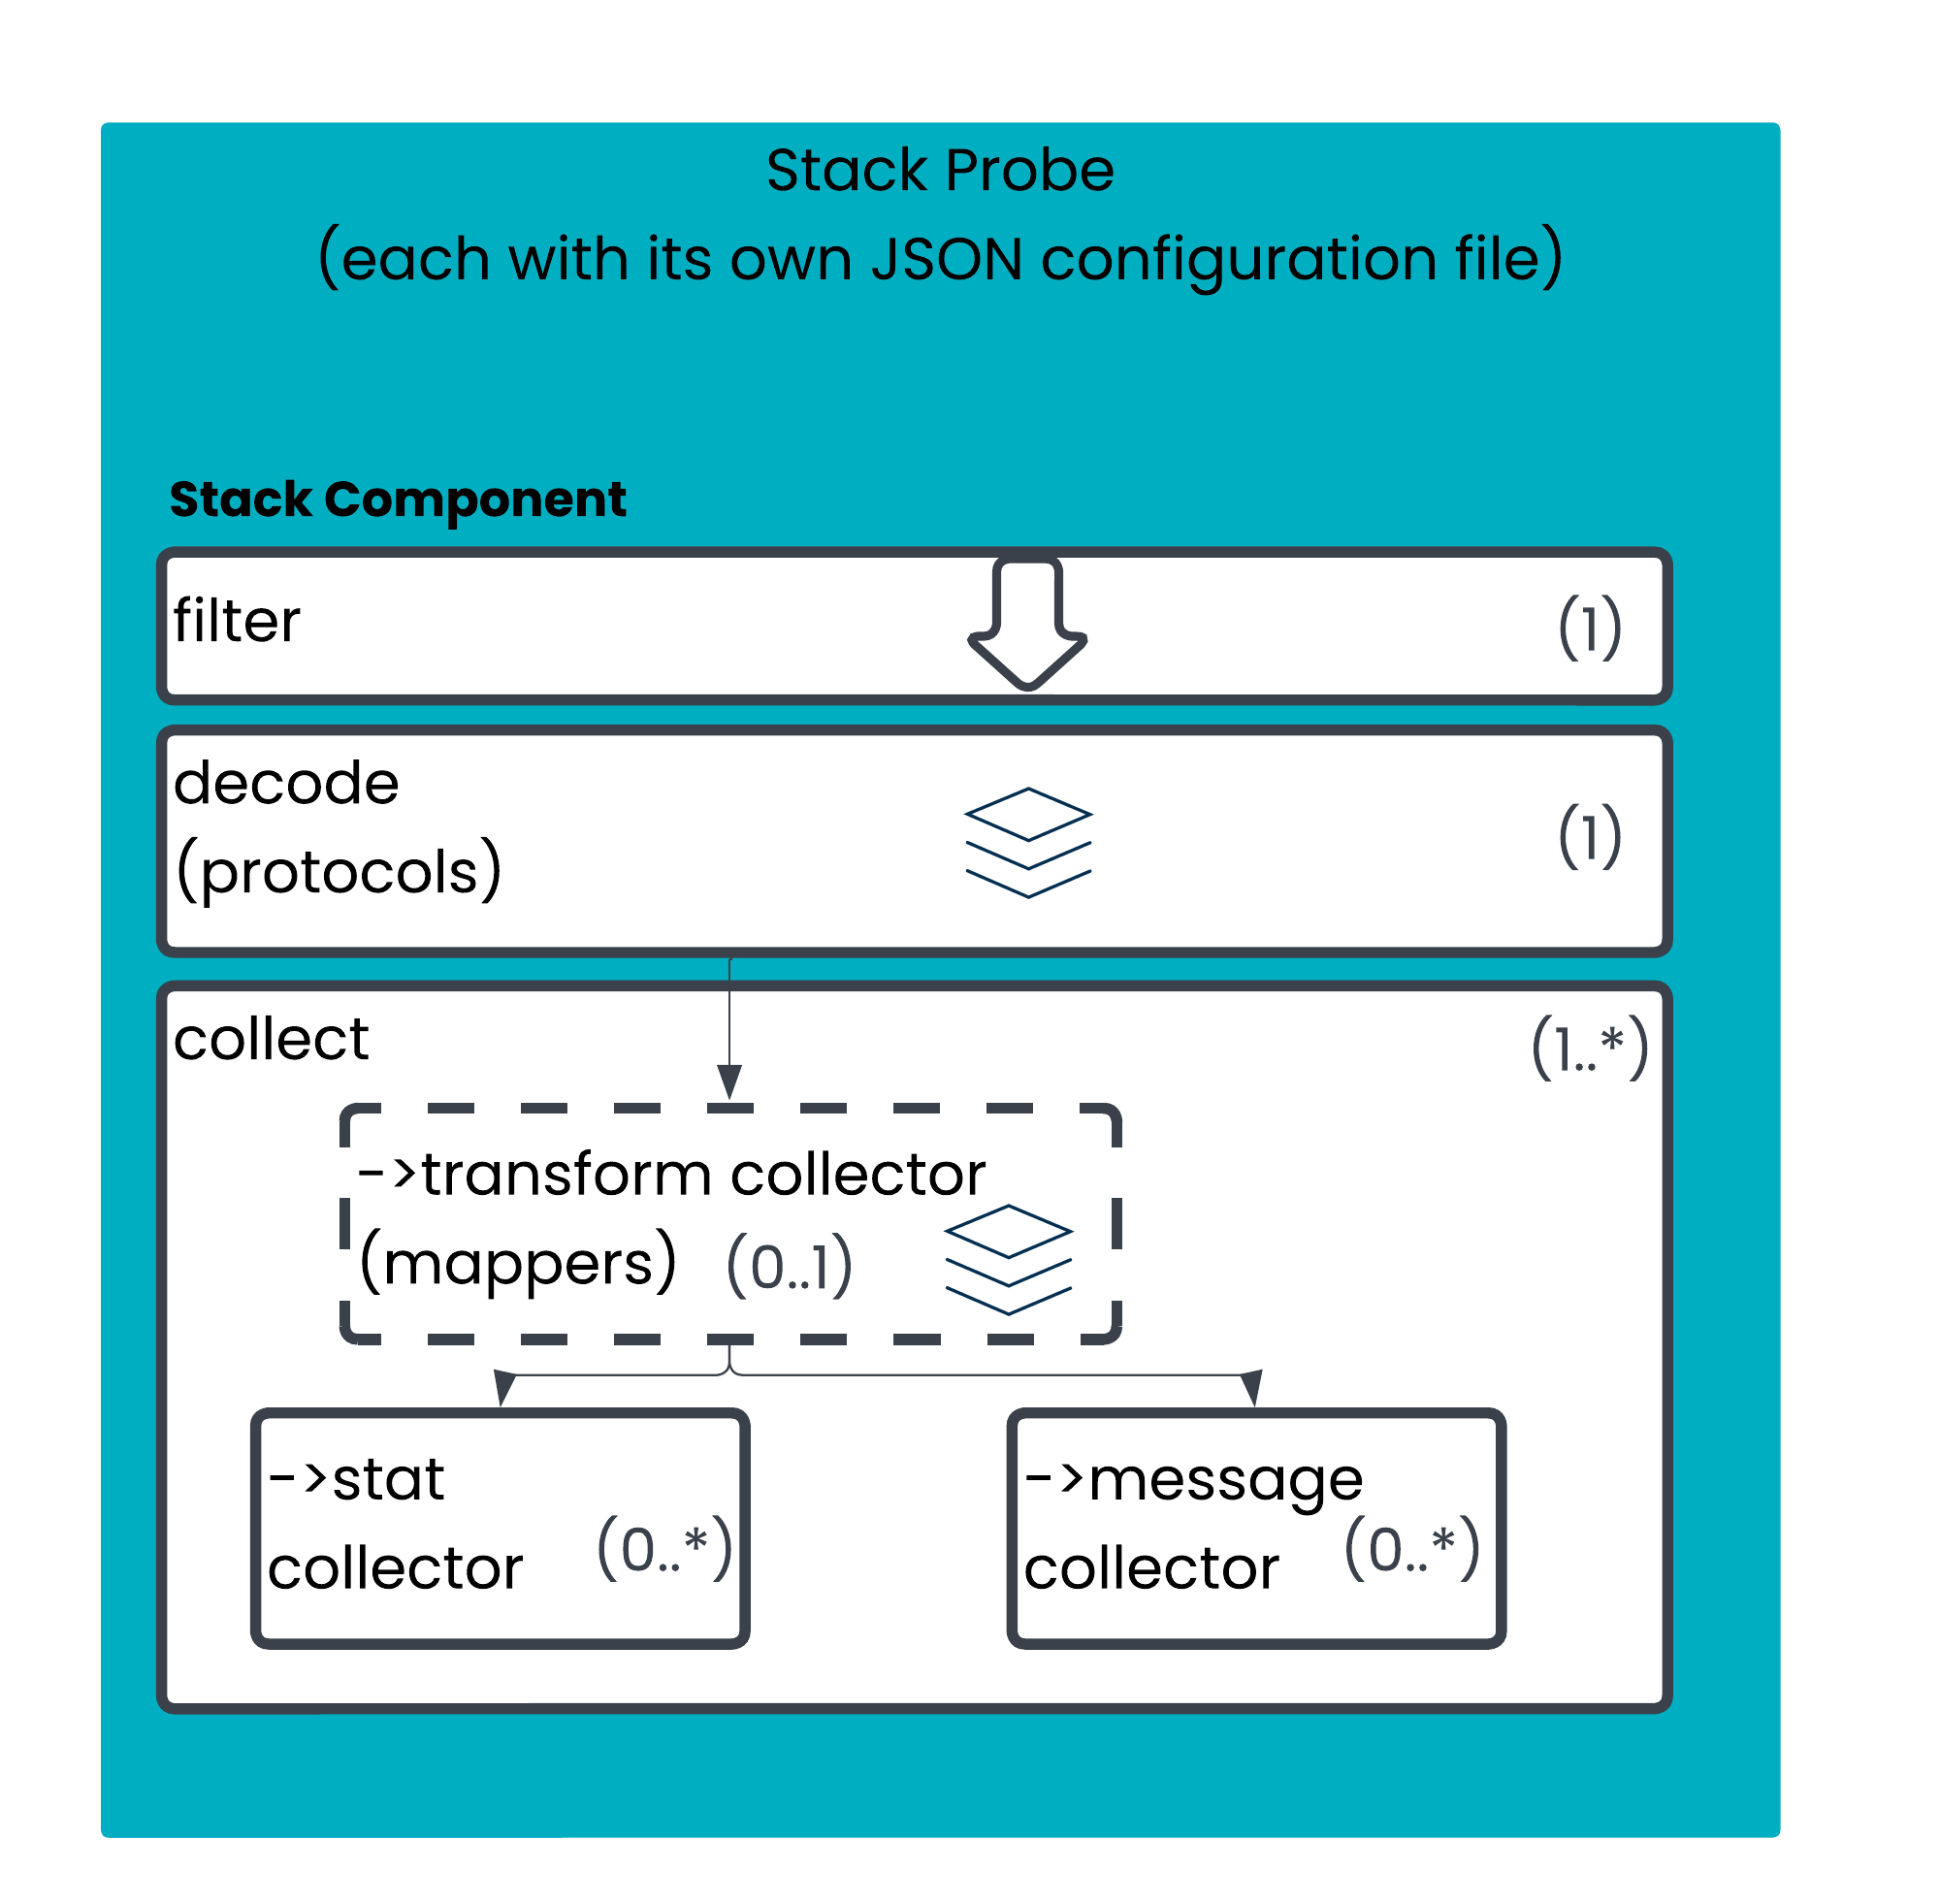
The diagram below provides an overview of how packets pass through the stack probe and are processed.
The ‘stack’ icon for the decode and mappers section shows that these parts of the configuration are stacked. The stack operates similar to the OSI network stack - the lower levels of the stack process data, and they progressively ‘unwrap’ the packet (in the case of the protocol layer).
Each Stack Probe will always have a filter and a decode/protocols section (the configuration labels this ‘protocols’, for clarity when learning about the configuration we use the more specifically understood term ‘decode’).
Each Stack Probe will need to provide its output somewhere. In most cases this is performed via one or more Collectors. There are two types of collector - stats collectors and message collectors. You can have multiple statistic or message collectors within the same stack probe, but these are not layered; they all take the same input.
There are some niche cases where a Collector is not required by a stack probe. For example, there is a capture protocol module that will produce write PCAP files, or transcoding protocol modules that can output information via the Napatech card (e.g. for the mdPlay use case).
See the Configuration Guide for VMX-Capture for more information about stack probes.
Stack probes are extremely high performance, and implementing multiple stack probes across different PMUXes allows extremely high volumes of data to be processed by a single appliance.
In the diagram above, the (1) indicates that the filter and decode elements are mandatory for every stack probe. The ‘stack’ icon for the ‘decode’ indicates that different protocols can be processed by the same stack probe.
Our testing measures the operation of the stack and the output of aggregated metrics via the stat collector.
Besides the efficiency of the VMX-Capture code itself and the performance of the hardware that the stack probe is running on, the two biggest drivers of performance are:
The type of data being processed by the stack (i.e. the data that is being analysed).
The amount of processing being performed by the stack probe. This is defined in the stack probe configuration.
Stack Probe performance, assumptions and configurations
This following sections provide more details of these across the different stack probe performance benchmarks.
You can find the specific stack probe configurations that were used to run the tests in Appendix: Stack Probe Configurations . These can be read in conjunction with the Configuration Guide for VMX-Capture, if you want to understand Stack probe configuration in more detail.
The stack probe performance benchmarks assume that only VMX-Capture components are running on the hardware.