Stack probes are probes that run decodes of packets. They contain a series of modules that form the decoder stack. They can also transform the data, and publish it as derived statistics from the data that is decoded or as individual messages.
In this section, we outline the stack workflow at a high level. In the next sections, we will then explore each of these areas in turn and reference some example configuration showing how these can be implemented.
Because of the greater complexity (compared to a Capture Probe), stack probes are configured using JSON-based configuration. The filename takes a stack.json filename suffix, and is usually stored in the <confdir>/agent/pmux/<PMUX_NAME> directory.
The more complex parts of the stack operation may reference other files to provide additional configuration information. Refer to VMX-Capture Directory Structure for an overview of the VMX-Capture directory structure.
Overview - Stack Layers
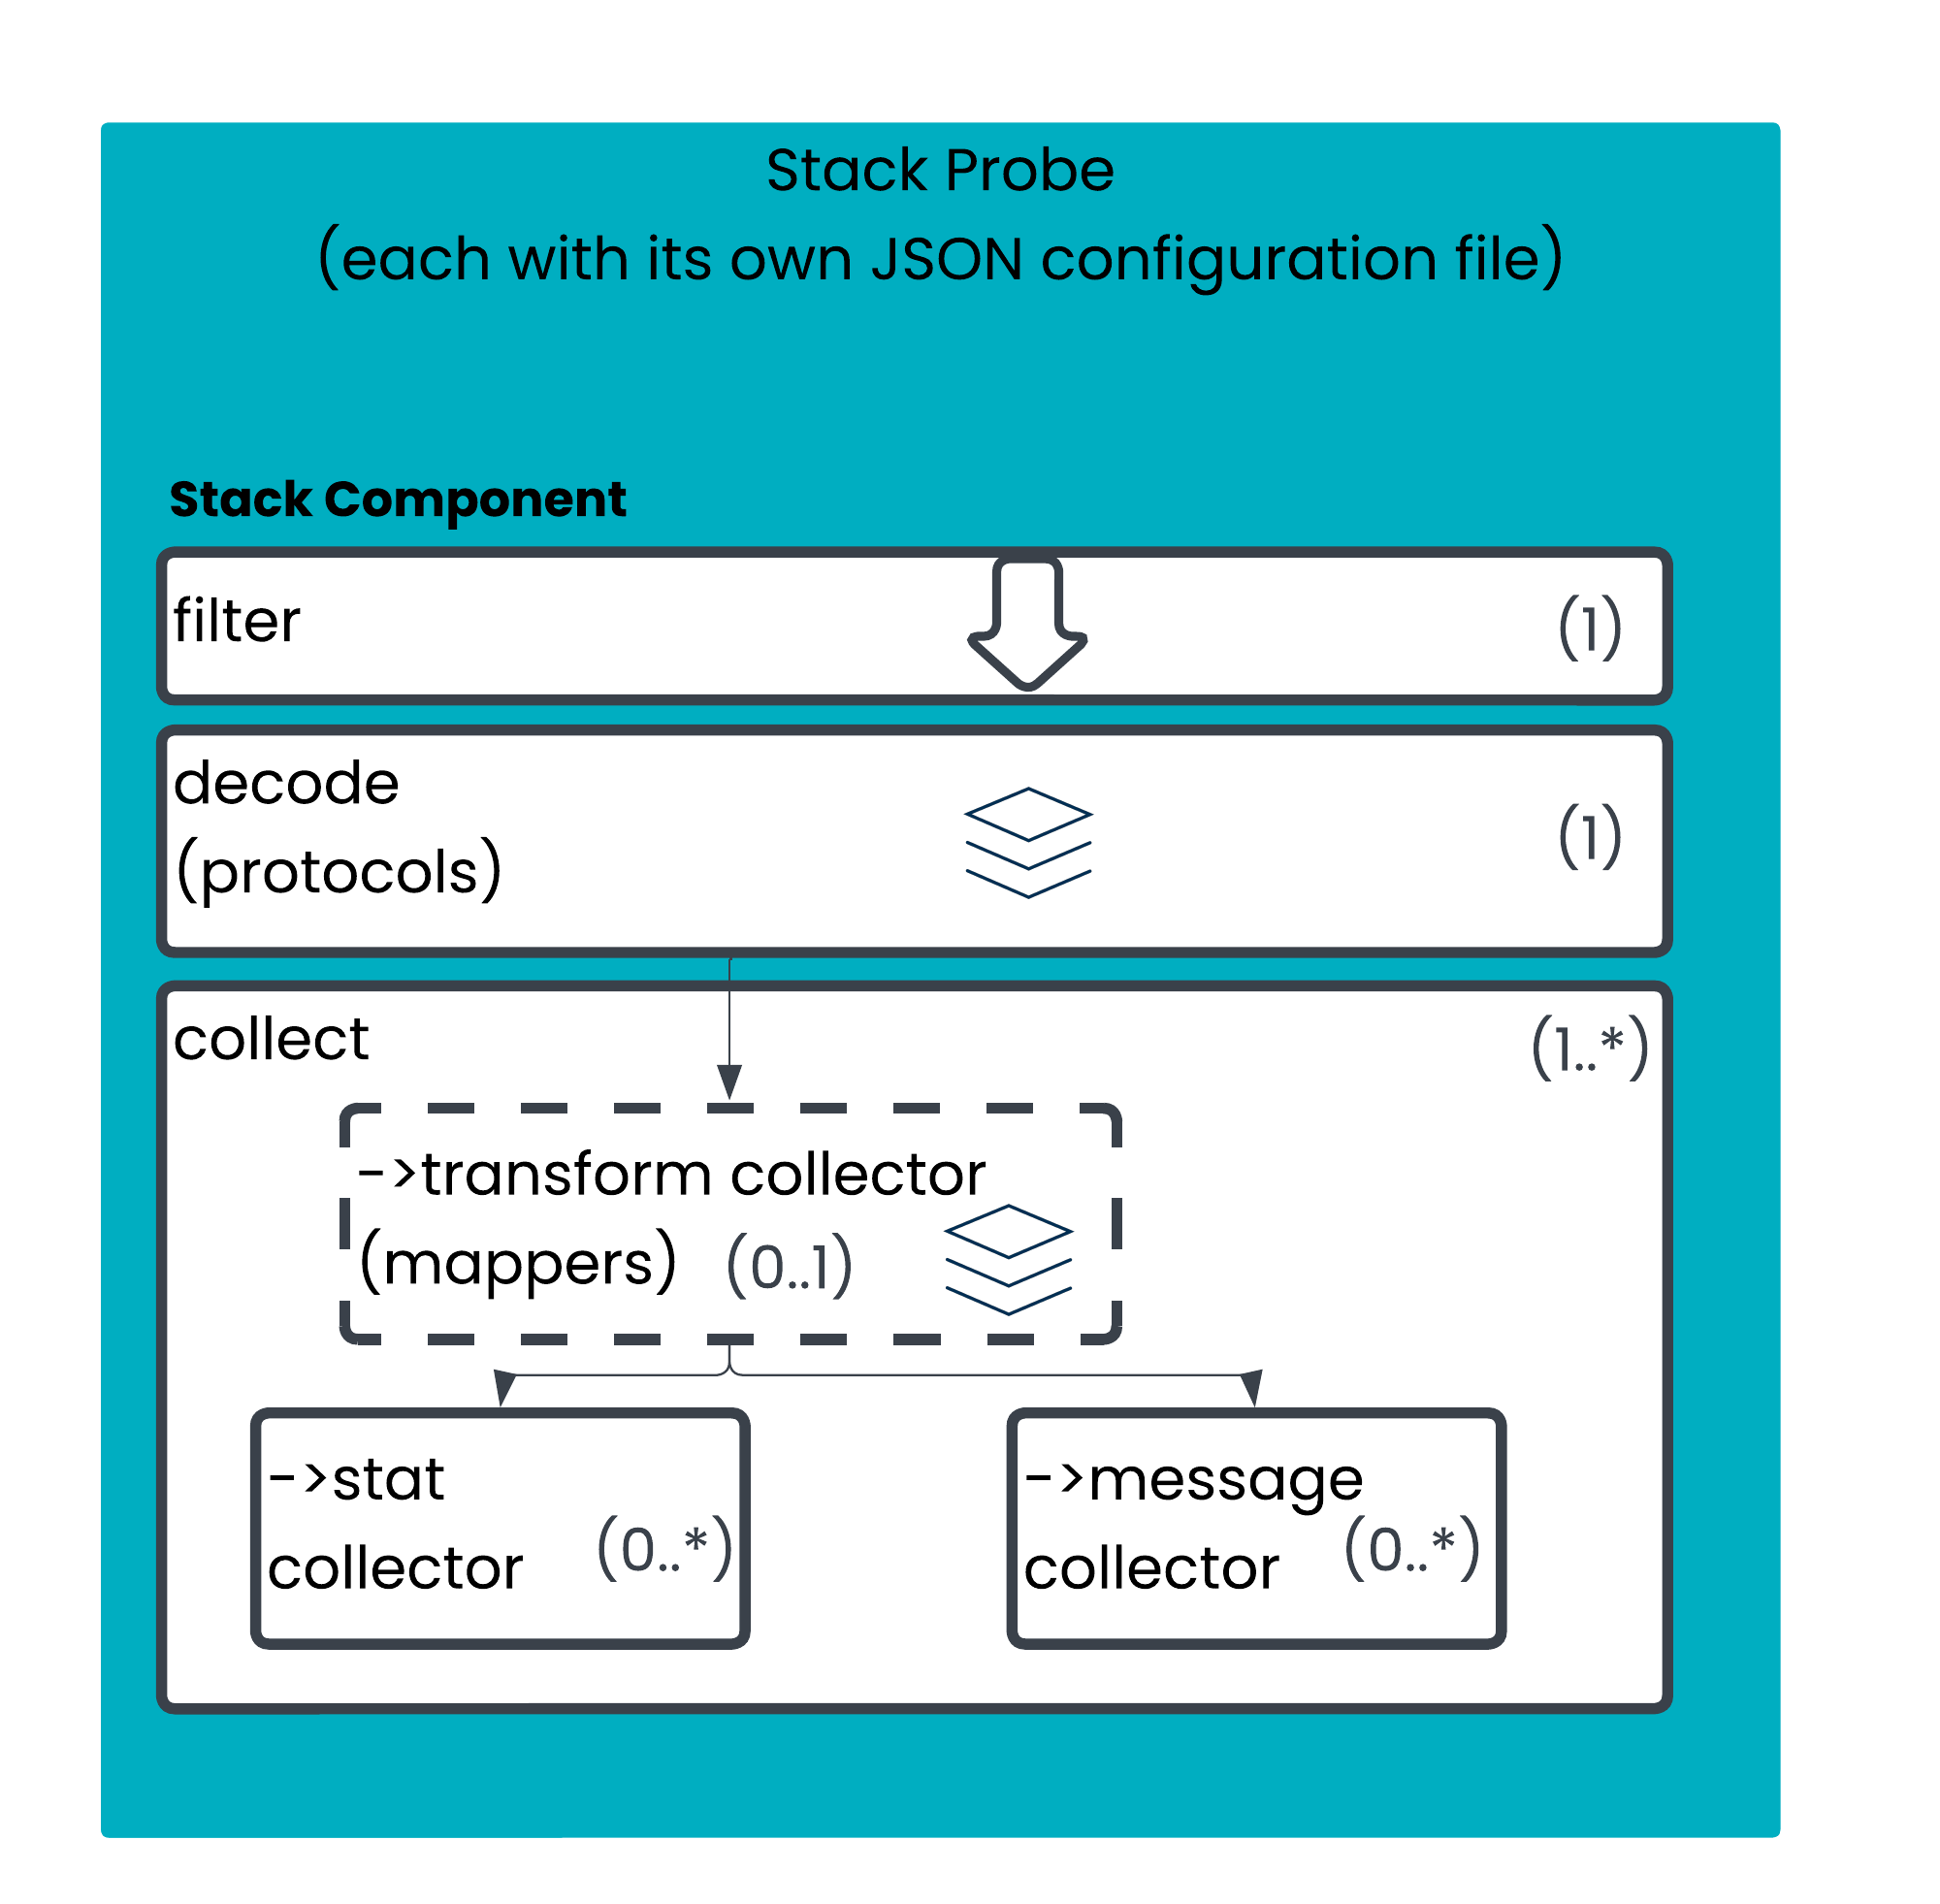
The diagram below provides an overview of how packets pass through the stack probe and are processed.
The ‘stack’ icon for the decode and mappers section shows that these parts of the configuration are stacked. The stack operates similar to the OSI network stack - the lower levels of the stack process data, and they progressively ‘unwrap’ the packet (in the case of the protocol layer).
Each Stack Probe will always have a filter and a decode/protocols section (the configuration labels this ‘protocols’, for clarity when learning about the configuration we use the more specifically understood term ‘decode’).
Each Stack Probe will need to provide its output somewhere. In most cases this is performed via one or more Collectors. There are two types of collector - stats collectors and message collectors. You can have multiple statistic or message collectors within the same stack probe, but these are not layered; they all take the same input.
There are some niche cases where a Collector is not required by a stack probe. For example, there is a capture protocol module that will produce write PCAP files, or transcoding protocol modules that can output information via the Napatech card (e.g. for the mdPlay use case).
Each part of the stack is described in brief within this section. They are then explained in more detail in the subsequent sections:
You can then see the different elements of the stack probe illustrated in two worked examples:
Worked Example: Market Data Gap Detection in Beeks Analytics for Markets (BAM)
Worked Example: Order Entry Stack Probes in Beeks Analytics for Markets
A third worked example ( Worked Example: TCP Round-trip time stats in Beeks Analytics for Markets ) outlines how TCP statistics are calculated. The TCP round-trip statistics are calculated with the help of the P3 process, which has other possible uses for high volume correlations, filtering, or preaggregation which can involve processing the outputs of multiple stack probes.
Packet Filtering and Decoding
The very first thing a stack does is Filter the packets it sees from the PMUX using a BPF (Berkeley Packet Filter) or similar packet filter. Beeks have developed an alternative filter protocol for cases where BPF syntax is not sufficient to define the traffic of interest, or to simplify cases where the BPF syntax is overly complex.
Then the stack decodes the packet according to the set of protocols defined in the decoding layer. If the message does not decode using the defined stack, then an error is thrown and the processing of that packet ends.
Data Transformation
Transformation is done via Mappers. A mapper defines a fixed set of rules containing conditional statements for transforming the data. If the payload of the data matches the condition, then the associated transformation will occur, such as:
data enrichment (adding fields)
data update (editing fields)
mapping of values (a translation table)
simple arithmetic (performing subtraction on timestamps to compute wiretime)
Metrics Aggregation
Stat Collectors are designed to compute metrics depending on a predefined set of aggregations and statistics. For example, a wiretime field might have been calculated in the transformation layer, you can then use a Stat Collector to compute percentiles on the value of the wiretime field. These statistics can then be aggregated and passed to VMX-Analysis, or output via the Core Data Feed (typically a Stat Collector would output via the CDF-T).
Message Publishing
The Message Collector is used to define an output of the processed data, once the data has been transformed it will be sent to a specified output:
Agent events will be sent to VMX-Analysis using vmxconnector
Other example outputs include text output, the P3 process, or the Core Data Feed (typically a Message Collector would output via the CDF-M).
For more details on the Core Data Feed, and CDF-T and CDF-M in particular, see the Core Data Feed Guide for more detail.