The Alerts Status endpoint allows you to query the latest alerts generated by Beeks Analytics for one or more specific alerts.
The following steps assume that you have previously created a panel and added the Beeks Analytics data source.
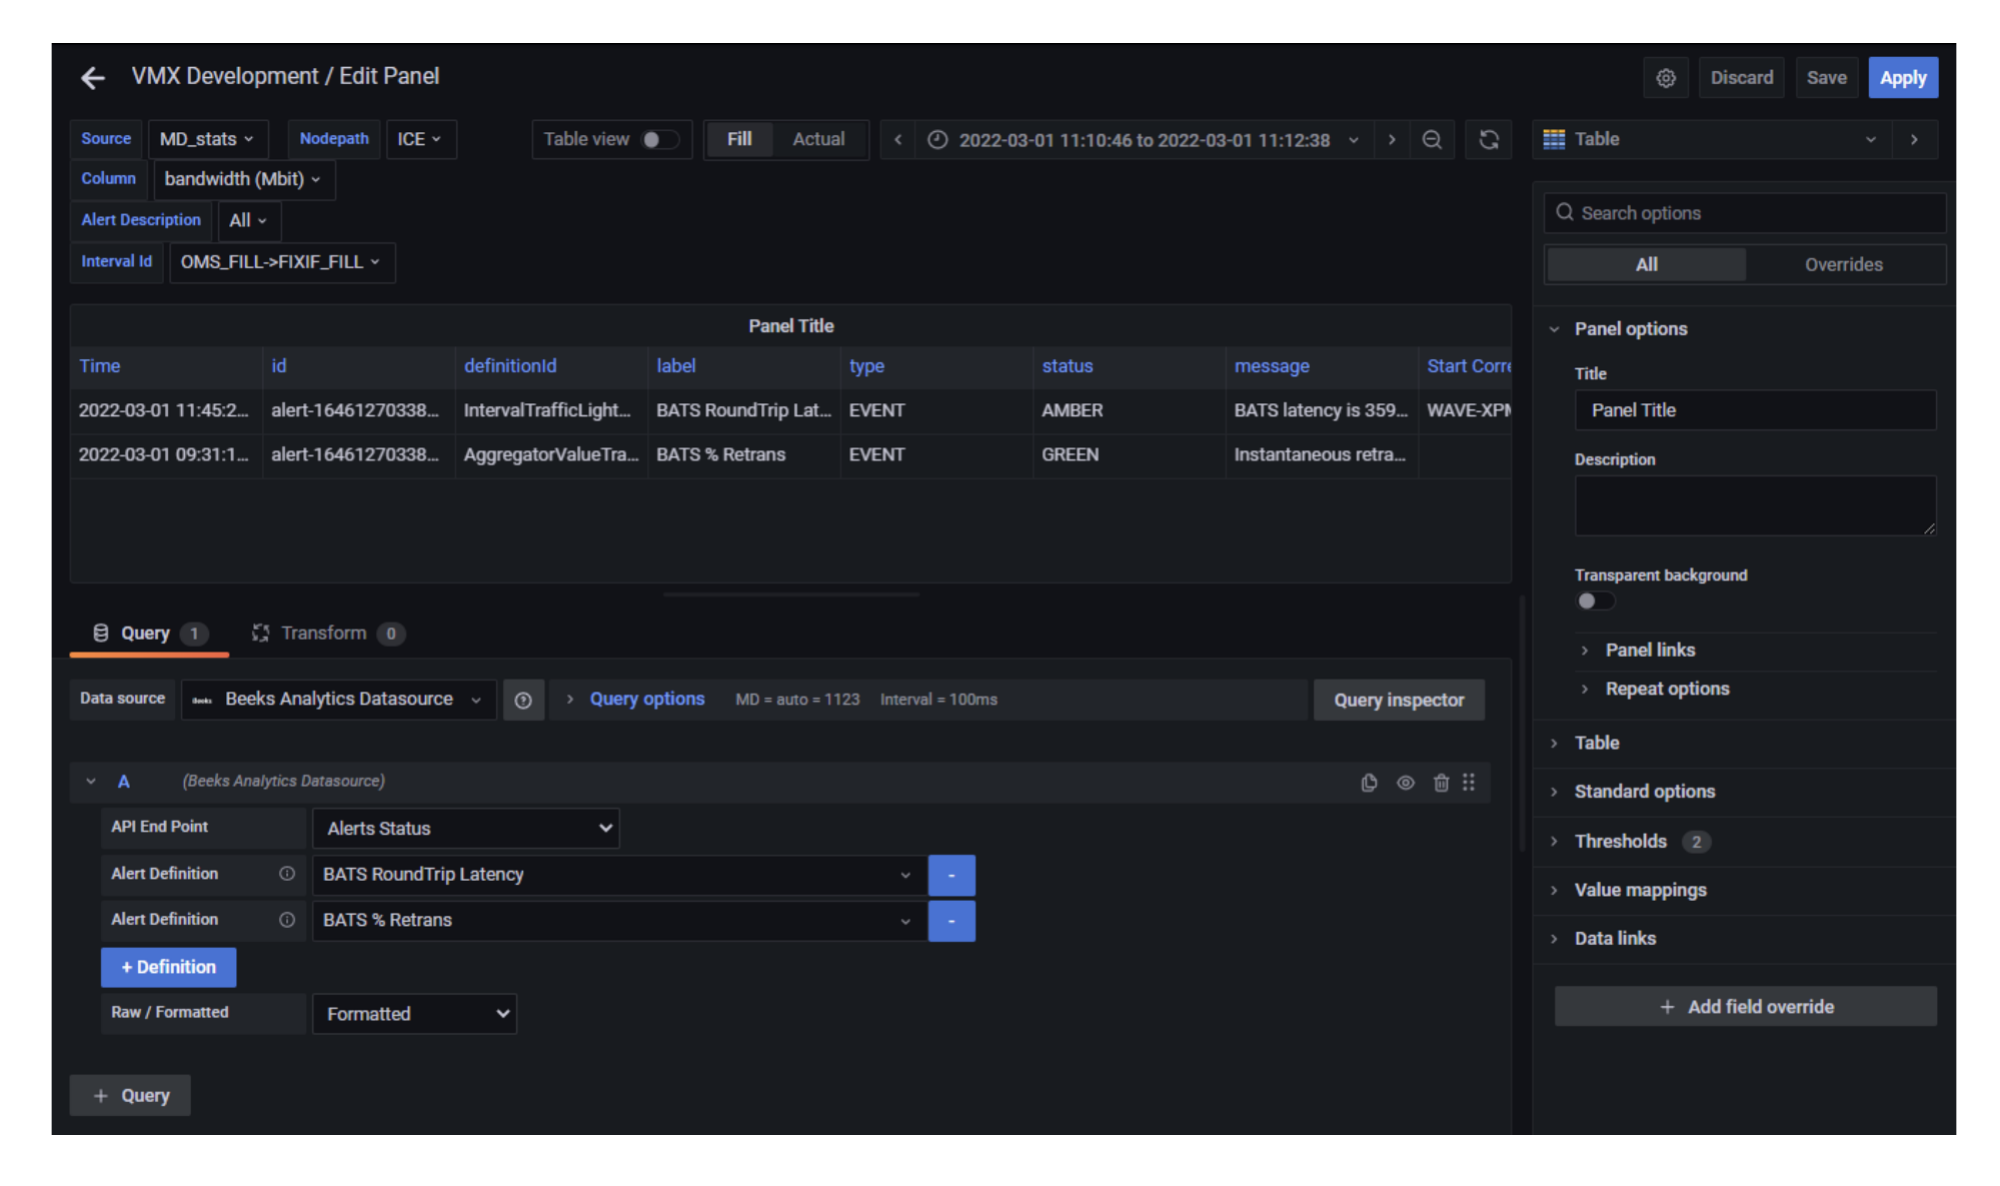
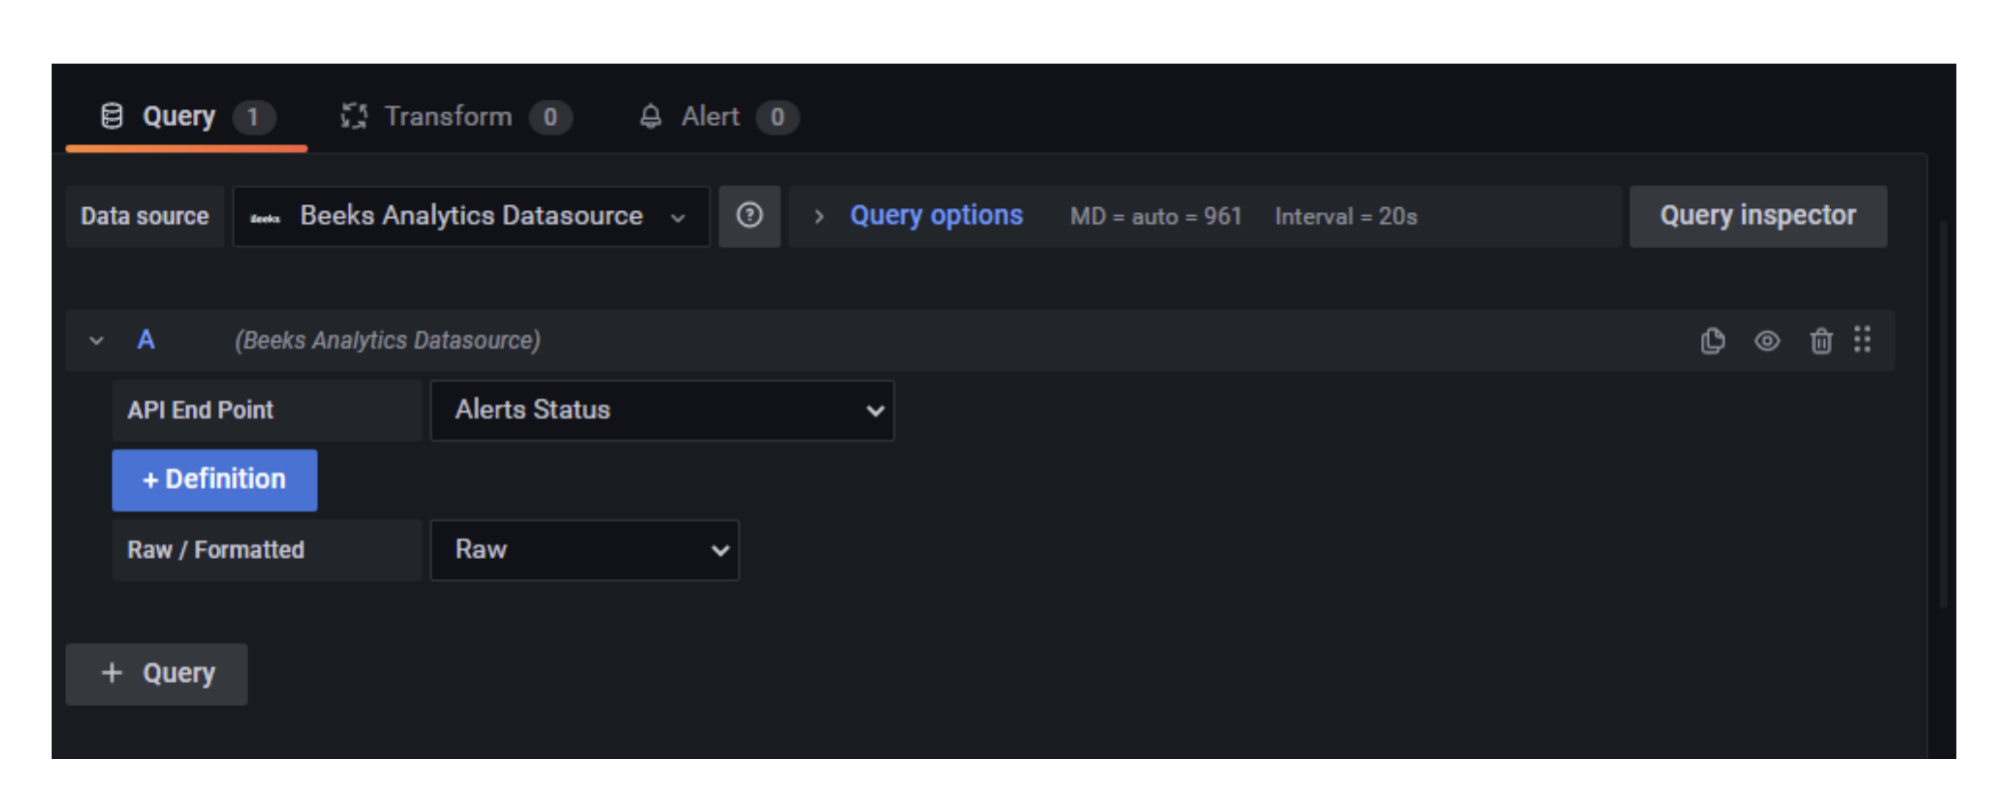
Complete the following fields:
API End Points: Select Alerts Status.
Stream Results: See Configuring query results section.
+Definition: [Optional] Select +Definition to define a specific alert to monitor. Repeat to add further alerts for monitoring. If you don’t define any alerts to monitor, all alerts will be queried.
Raw / Formatted: [Optional] Select Raw to display raw data, or Formatted to display formatted data in the panel. Note that formatted numbers may contain commas and therefore will not be treated as numbers by Grafana.
Alternatively, you can define alerts via dashboard variables. All available variables will be presented in the drop down list and the query will be fired whenever the variable is changed.. Any configured dashboard variable should appear in the drop down selection prefixed with variable. See Using dashboard variables in queries for more information.
The panel will refresh and display the alerts that correspond to the options you've selected. If you have used variables, any changes will trigger a re-run of the query with the new value.