Alerts notify users in real-time when a performance threshold is breached in Dedicated Server or Virtual Private Servers in any of your availability zones. An example of a performance threshold is 50% CPU usage, and you might configure a rule to alert you via email if memory usage in a given Dedicated Server exceeds this threshold.
Your Portal allows you to configure alert rules and their thresholds, and view a history of all the alerts that have been issued. To manage and view alerts, select Alerting from the navigation menu on the left-hand side of your Portal.
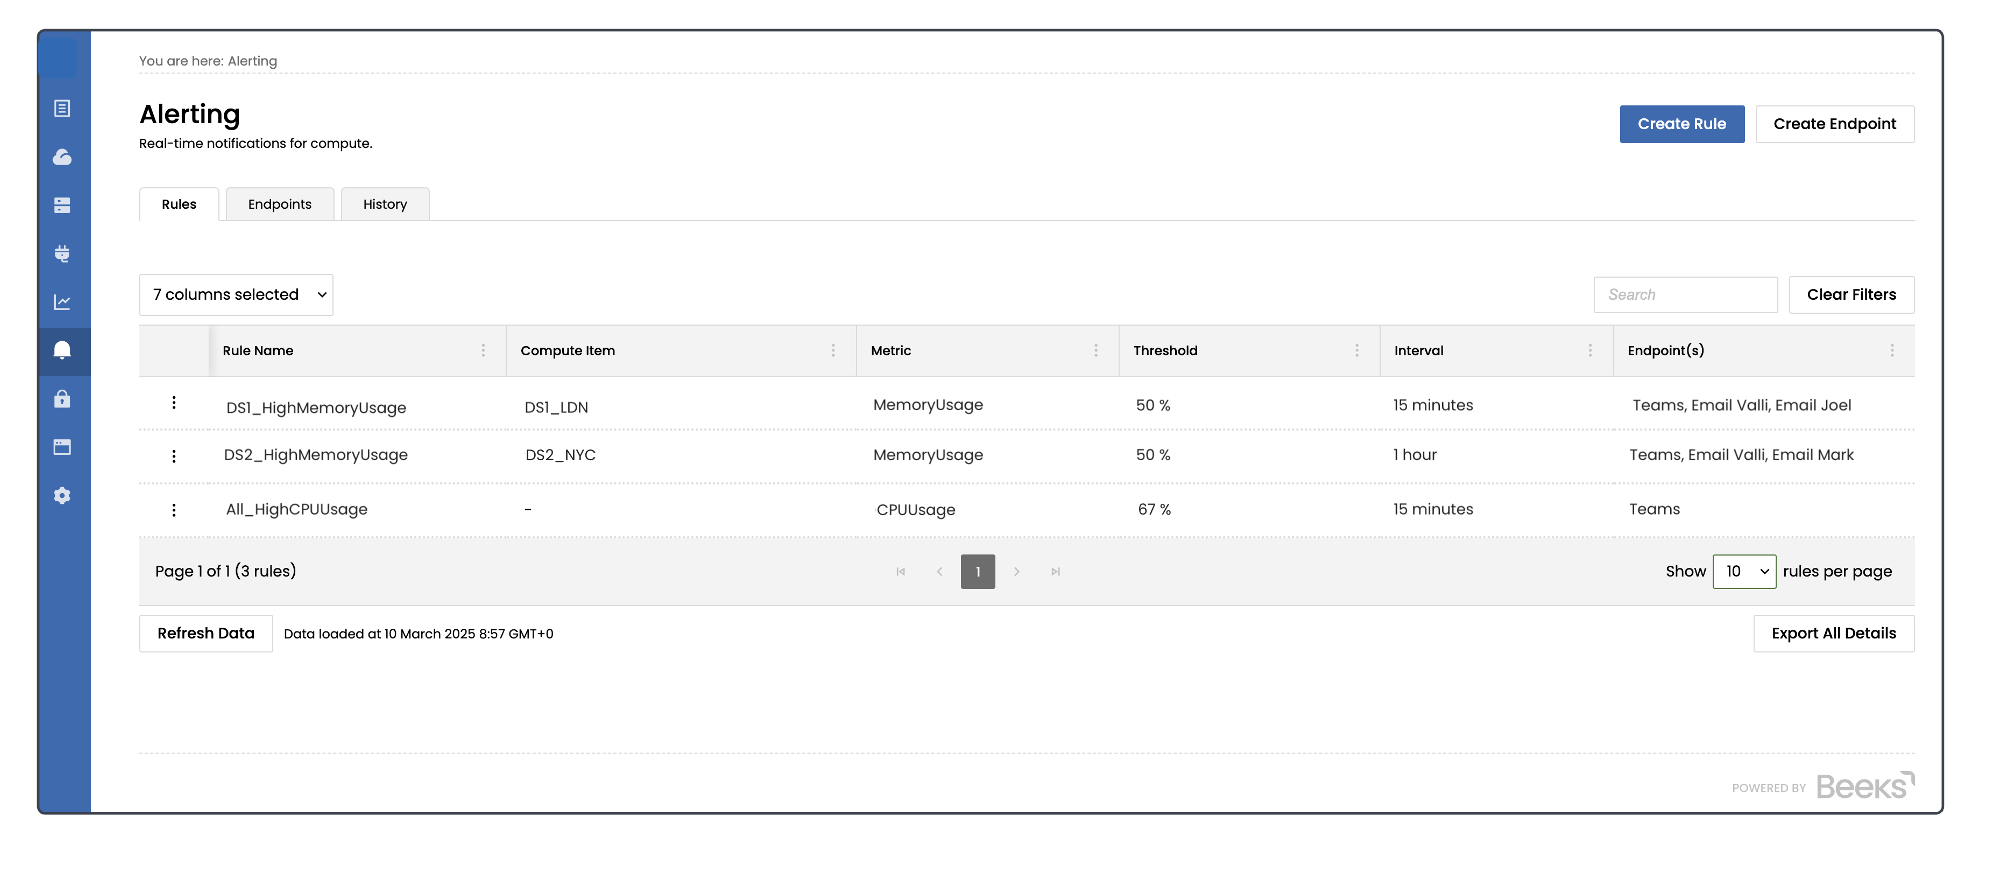
The Rules tab lists the rules you have already created.
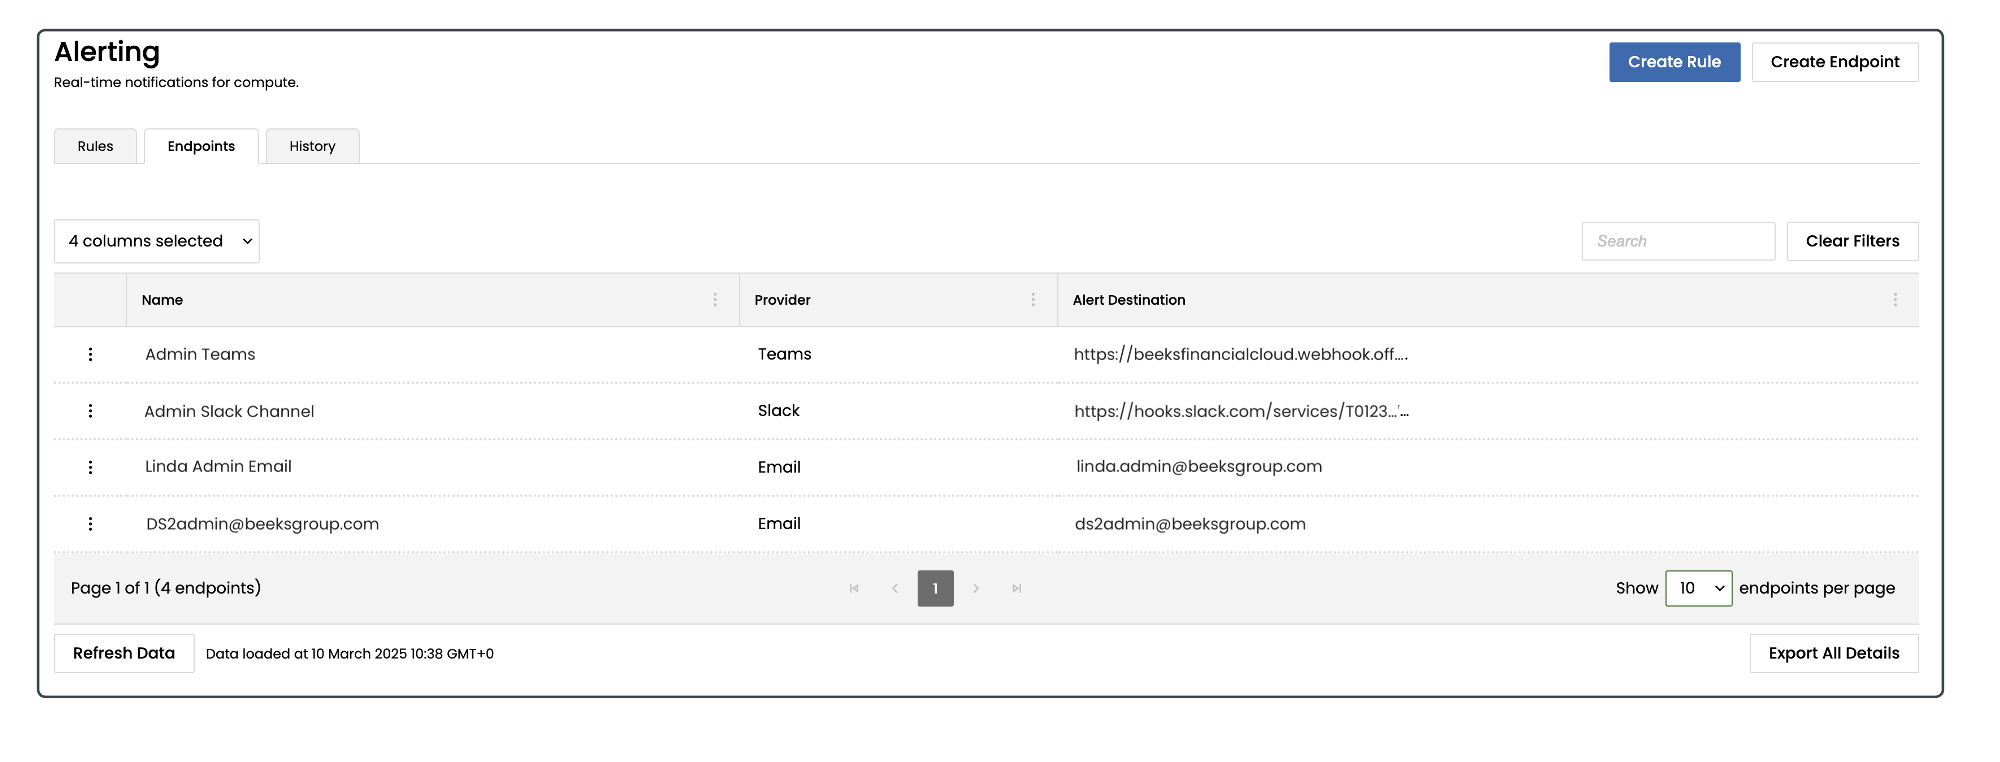
The Endpoints tab lists the endpoints you have already created.
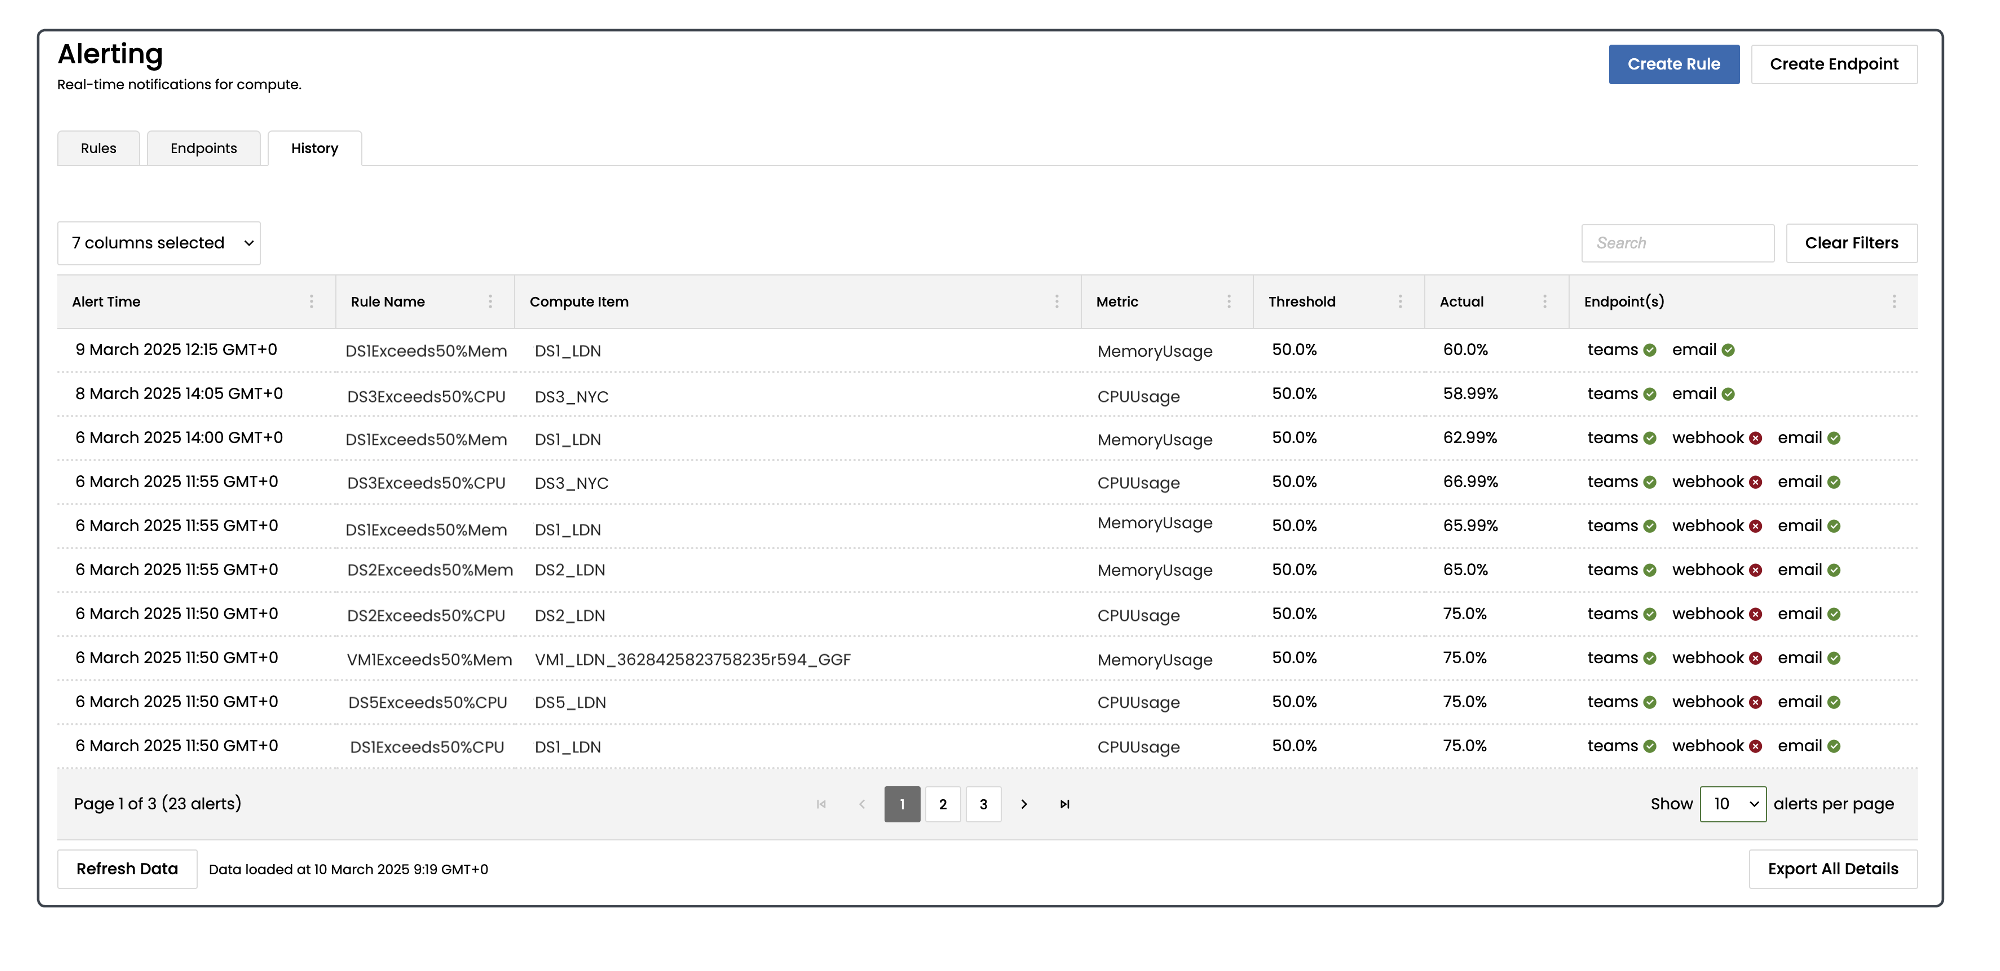
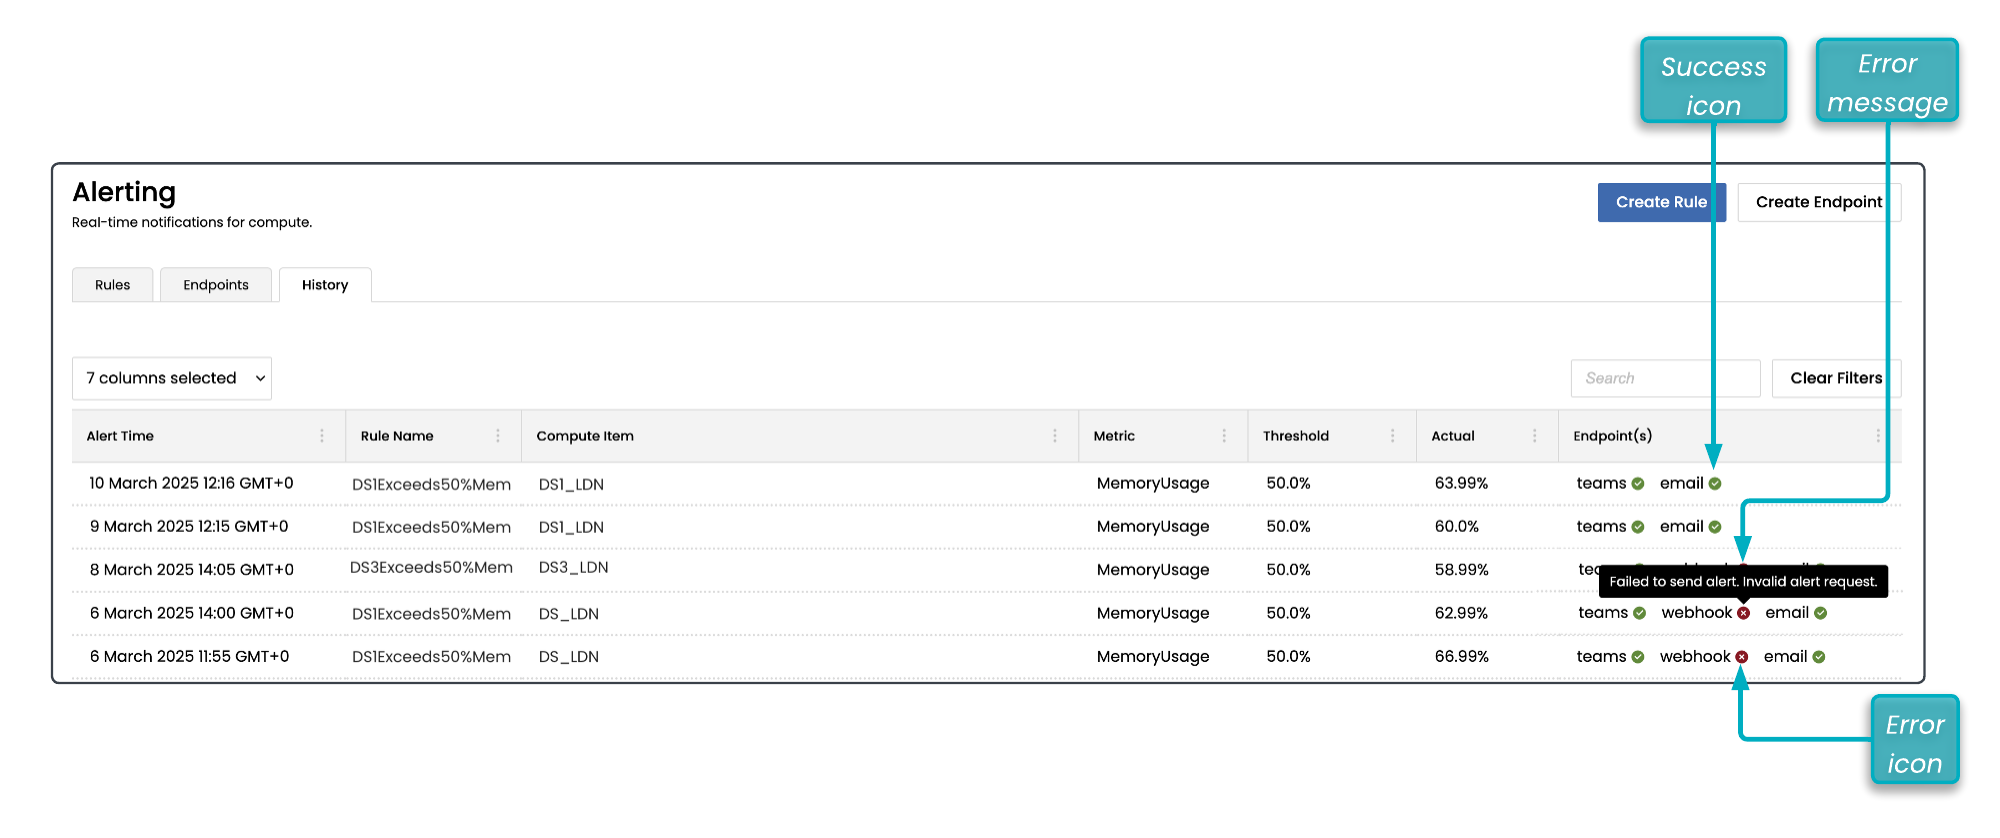
The History tab lists the alerts that have already been issued, including status, details of the thresholds, and the extent of the breach. It also indicates the success or failure of alerts for a given Endpoint (see screenshot below). An alert is deemed successful if a 'success' status code is returned, e.g. response code 200 for Webhook/Teams/Slack or the portal successfully sends the email. To display an error message, position the cursor over the error icon. Alerts are retained in the History tab for 45 days.
Note that email is not a reliable or guaranteed notification mechanism –a success status will be shown for the alert if the email has been successfully sent. This does not necessarily mean that the email has been successfully received by the recipient.
Note that the History is designed to support testing alert functionality. It should not be used as a comprehensive alerting solution.
To filter the contents of any tab, select the More Actions (three dots) icon in the relevant column to display the filters, and select the filters you require.
To stop filtering the contents of any tab, select Clear Filters.
To search by Rule Name, Compute Item, Threshold, or Interval, type the text into the Search field.
To export the contents of any tab as a .csv file, open the relevant tab and select Export All Details.
To update the listing with the latest data, select Refresh Data.
Creating a new alert
An alert is made up of:
An Endpoint
This is how you’ll receive the alert. For example, an email address.A Rule
The rule specifies the threshold, the endpoint, and other options for the alert.
Creating the Endpoint
First, decide which endpoint to send the alert to. Then open the Endpoints tab to check if your preferred endpoint is already in the listing. If it is, then go straight to Creating the Rule section of this document.
If it isn’t in the listing, follow the steps below to create the new endpoint.
Select the Create Endpoint button. A Create Endpoint modal window opens.
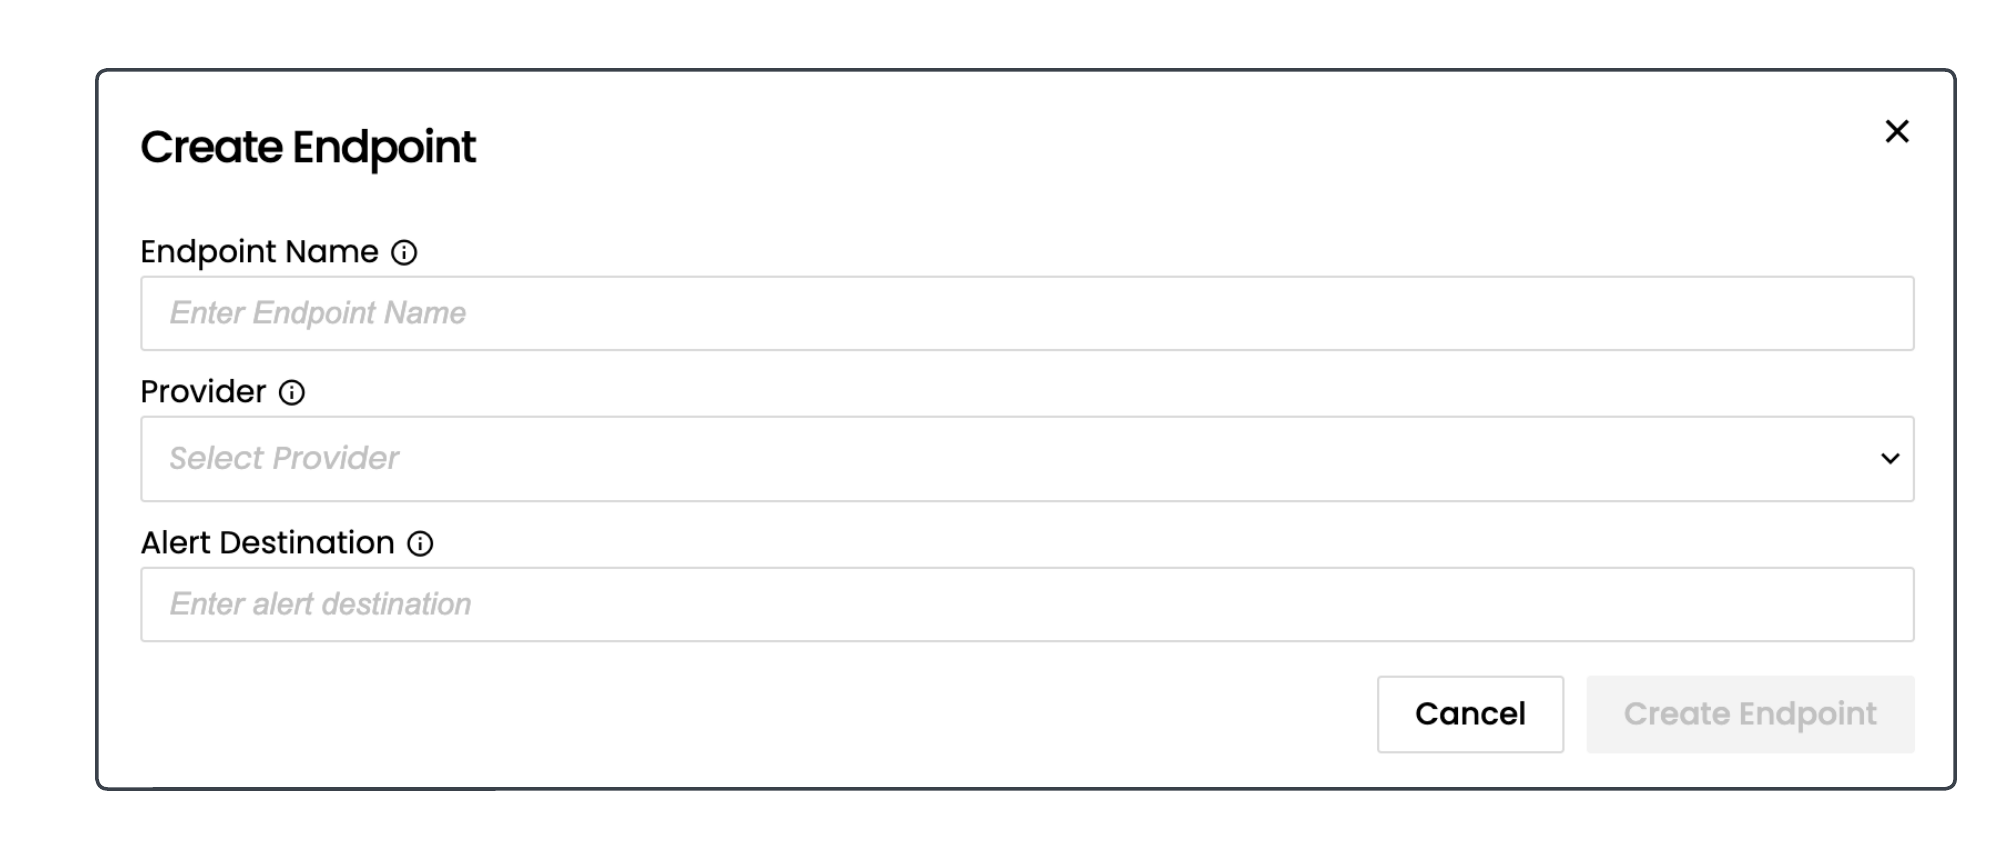
Populate the fields:
Field name | Description | Example value |
|---|---|---|
Endpoint Name | An intuitive name for the endpoint you are sending the alert to. This is what you’ll select when you choose the endpoint in a new rule. | Linda Admin email |
Provider | The channel provider.
| |
Alert Destination | The location in the selected channel that the alert will go to. |
Select Create Endpoint to save the new endpoint.
If the endpoint is created successfully, you’ll see a Success message at the top of the page and the new endpoint will be included in the listing in the Endpoints tab.
To delete or edit an endpoint, open the Endpoints tab and select the More Actions (three dots) icon in the first column for that endpoint in the listing.
Next, follow the steps in the next section of this guide to create the rule.
Creating the Rule
Select the Create Rule button. A Create Alerting Rule modal window opens.
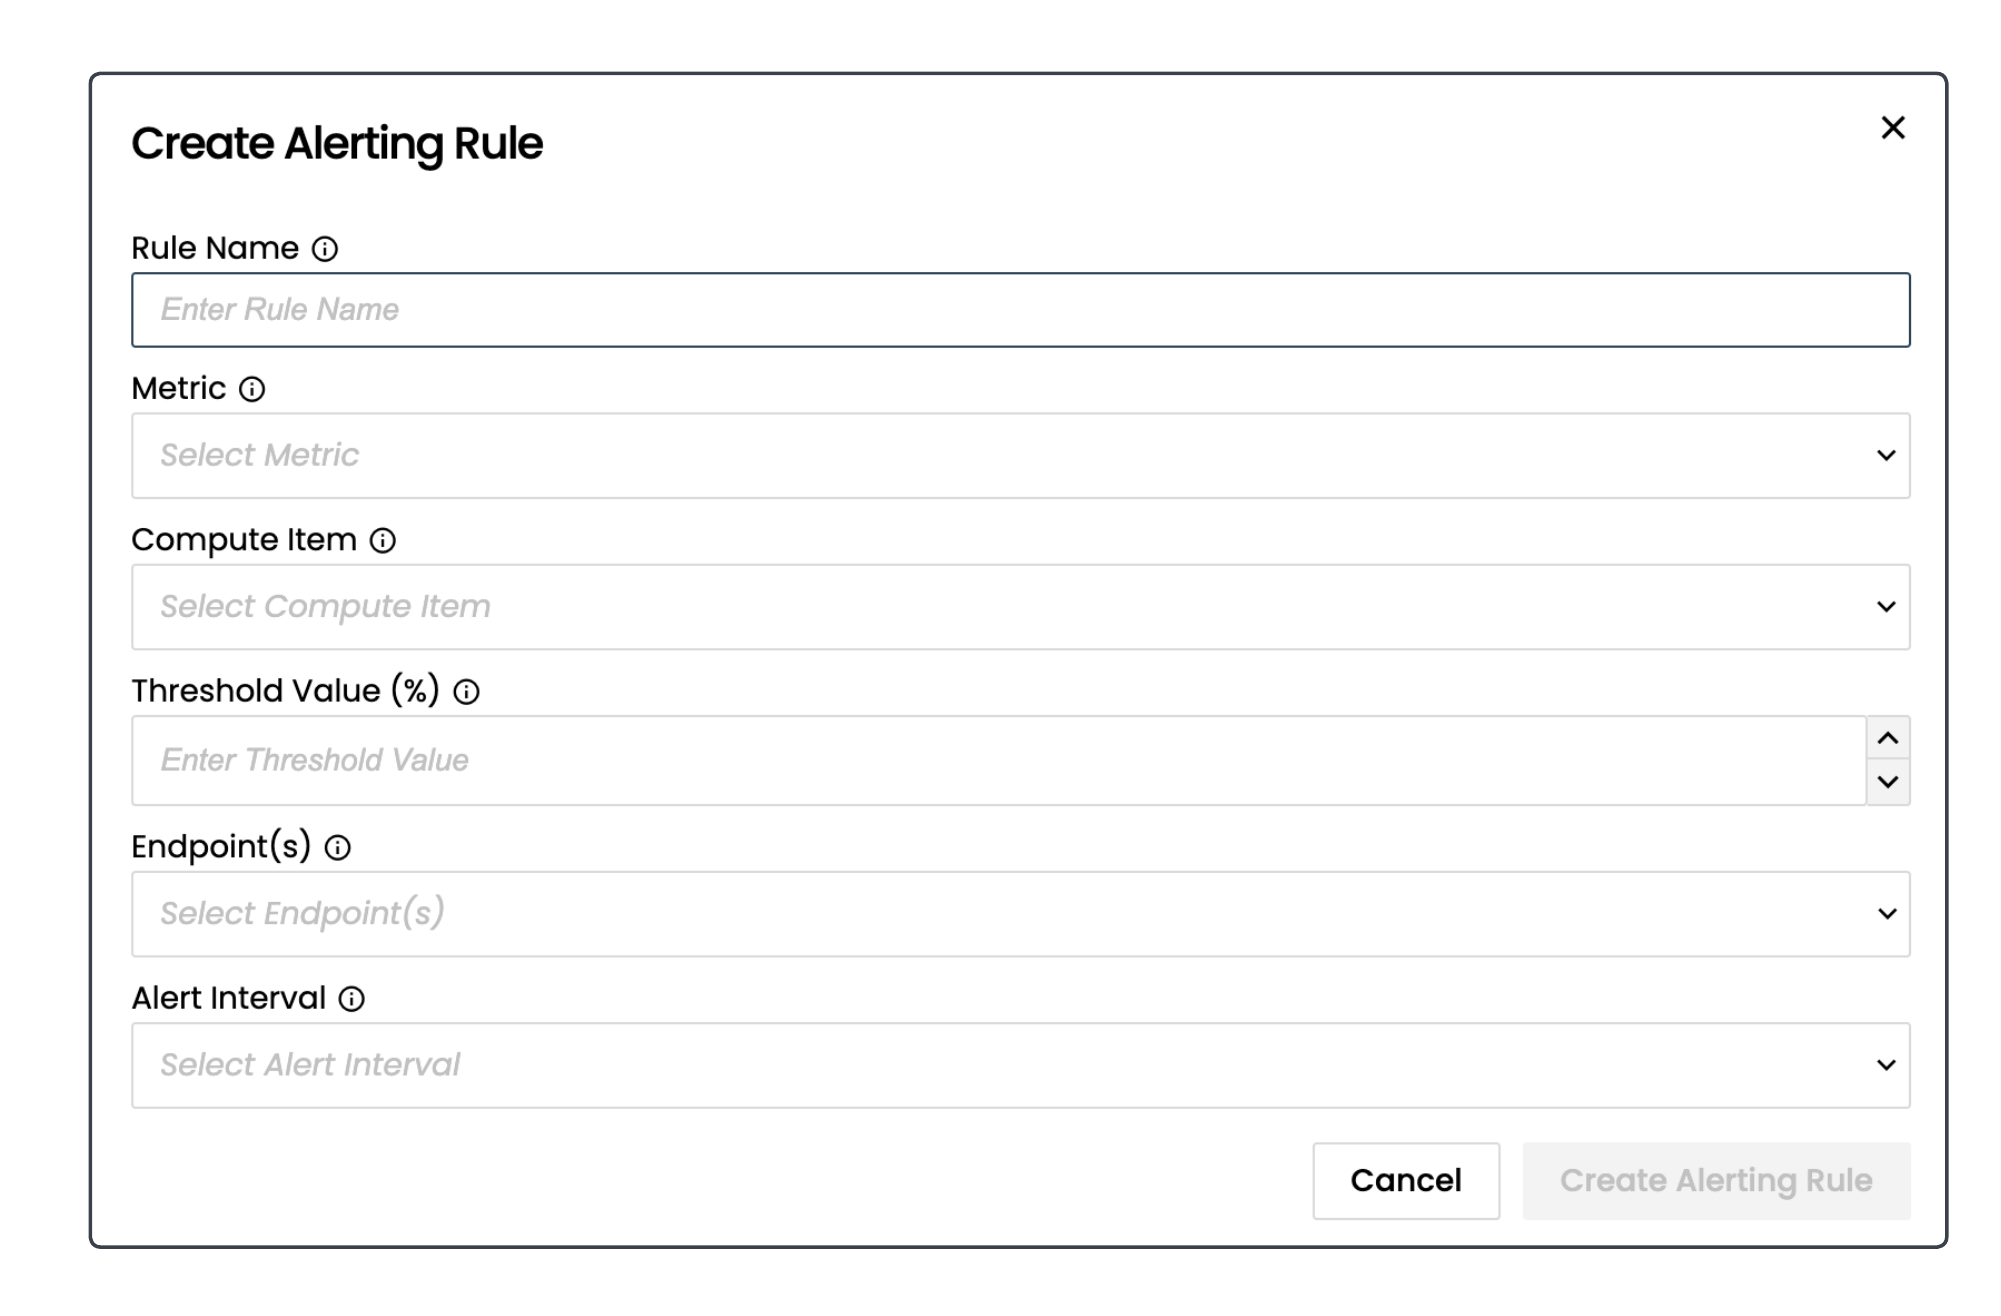
Populate the fields:
Field name | Description | Example value |
|---|---|---|
Rule Name | An intuitive name for the rule. | DS1Exceeds60%MemoryUsage |
Metric | Select one of the following:
Note that the Virtual Private Servers in many Availability Zones do not currently support memory usage metrics. This will become available in a future version of the Portal. Until then, raise a support ticket if you want to register your interest in configuring memory usage alerts. | Memory Usage |
Compute Item | Choose Select All or choose one Compute Item from the list. | DS1_LDN |
Threshold Value | Enter a % value for the threshold between 50 and 100. | 50 |
Endpoint(s) | Select checkboxes for one or more endpoints from the list. | Linda Admin Email |
Alert Interval | This determines the time interval between alerts. A monitored metric might breach the set threshold many times in a minute, but you don’t want an alert for each of these breaches. You need only one alert for a given breach inside a set time interval. | 15 minutes |
Select Create Alerting Rule to save the new rule.
If the rule is created successfully, you’ll see a Success message at the top of the page and the new rule will be included in the Rules tab.
To delete or edit a rule, open the Rules tab and select the More Actions (three dots) icon in the first column for that rule in the listing.
The rule will come into effect immediately and will send an alert to the selected endpoint(s) at the appropriate interval if the threshold is breached.
To request further metrics or time intervals, please open a ticket via the Support section in the Portal.
What do alerts look like?
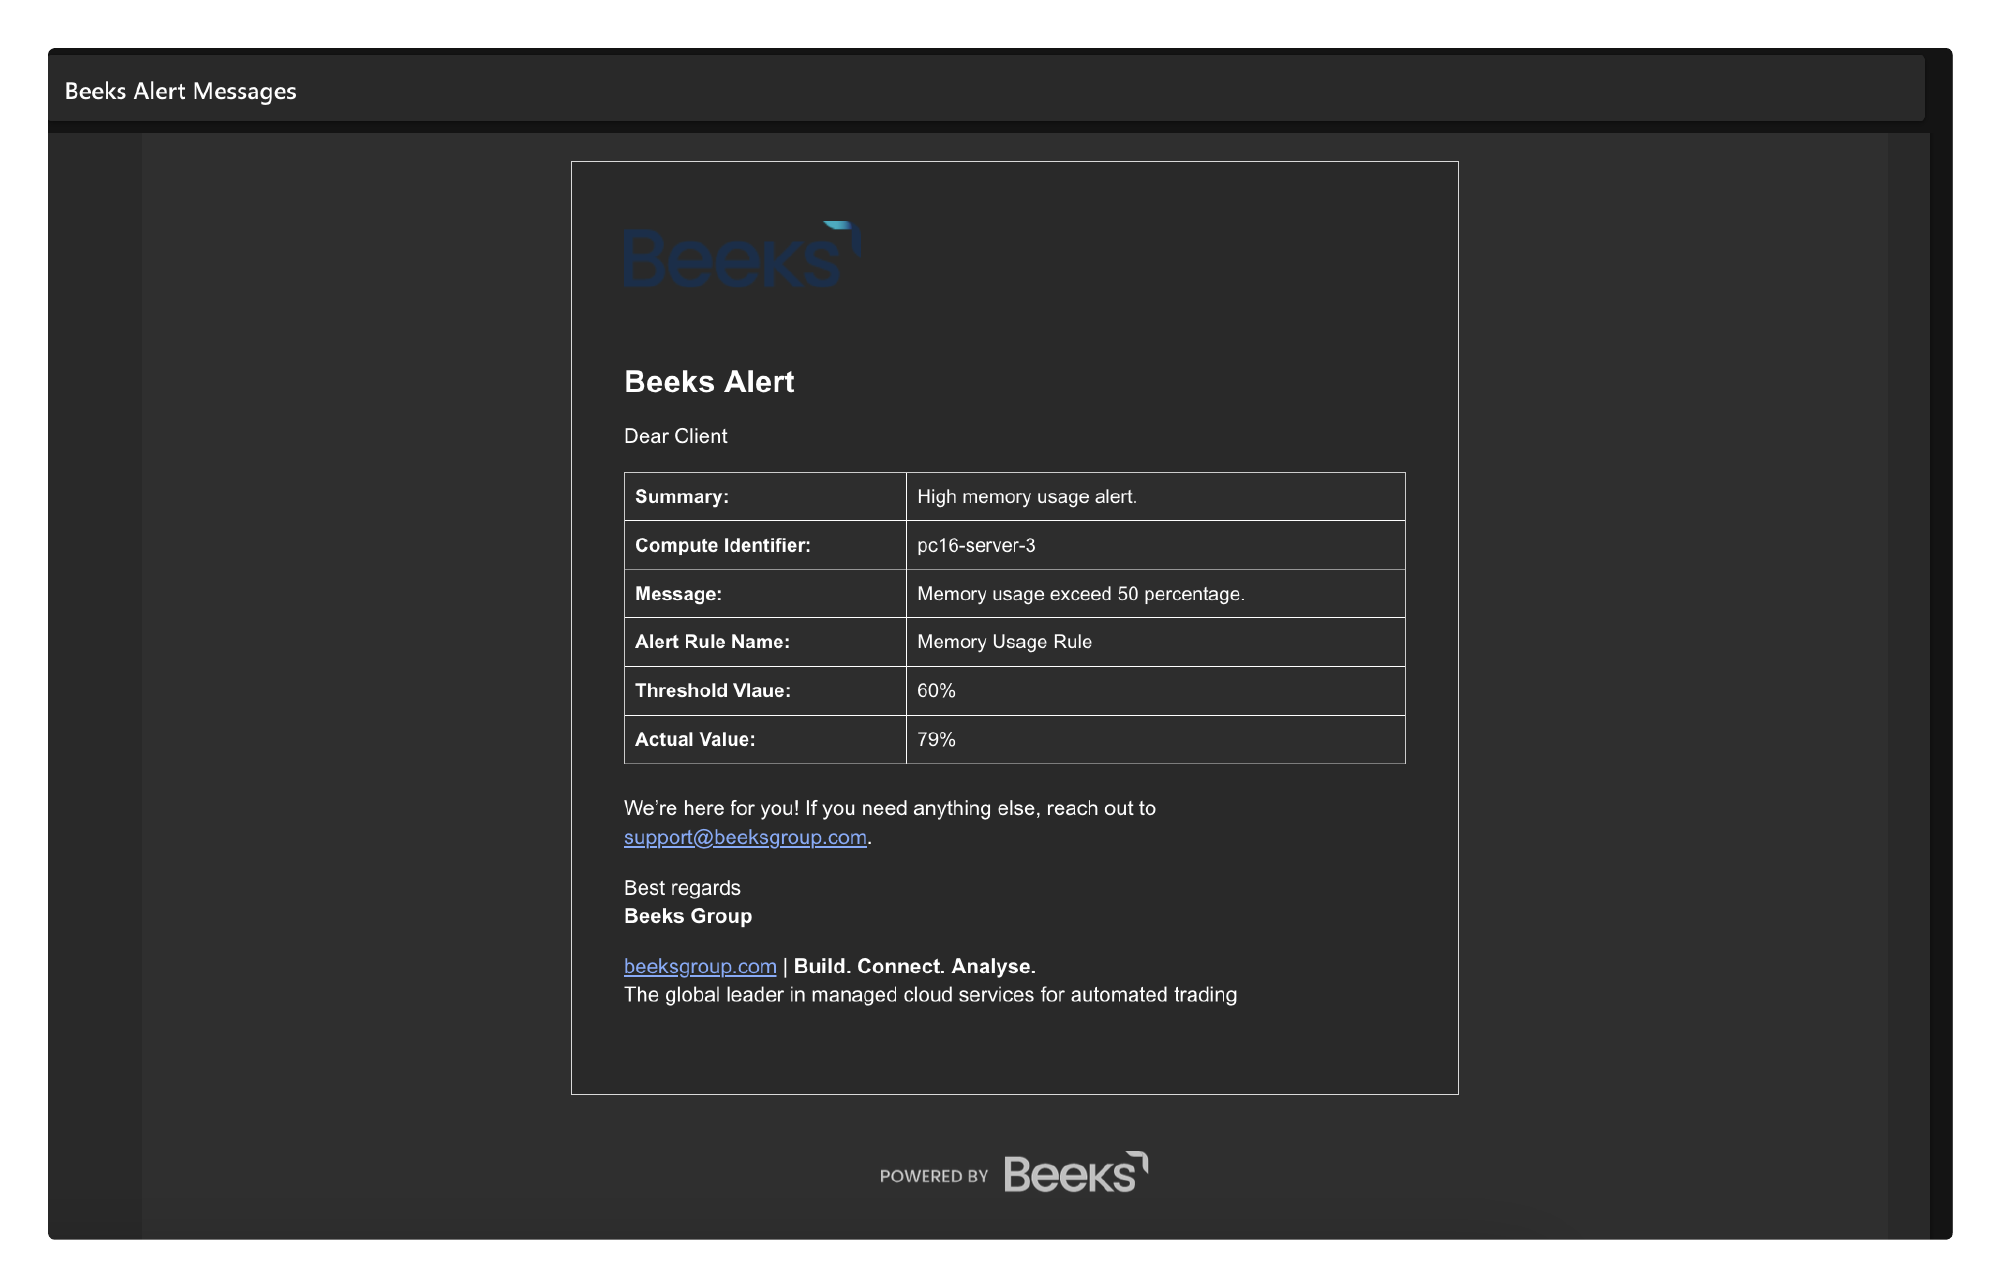
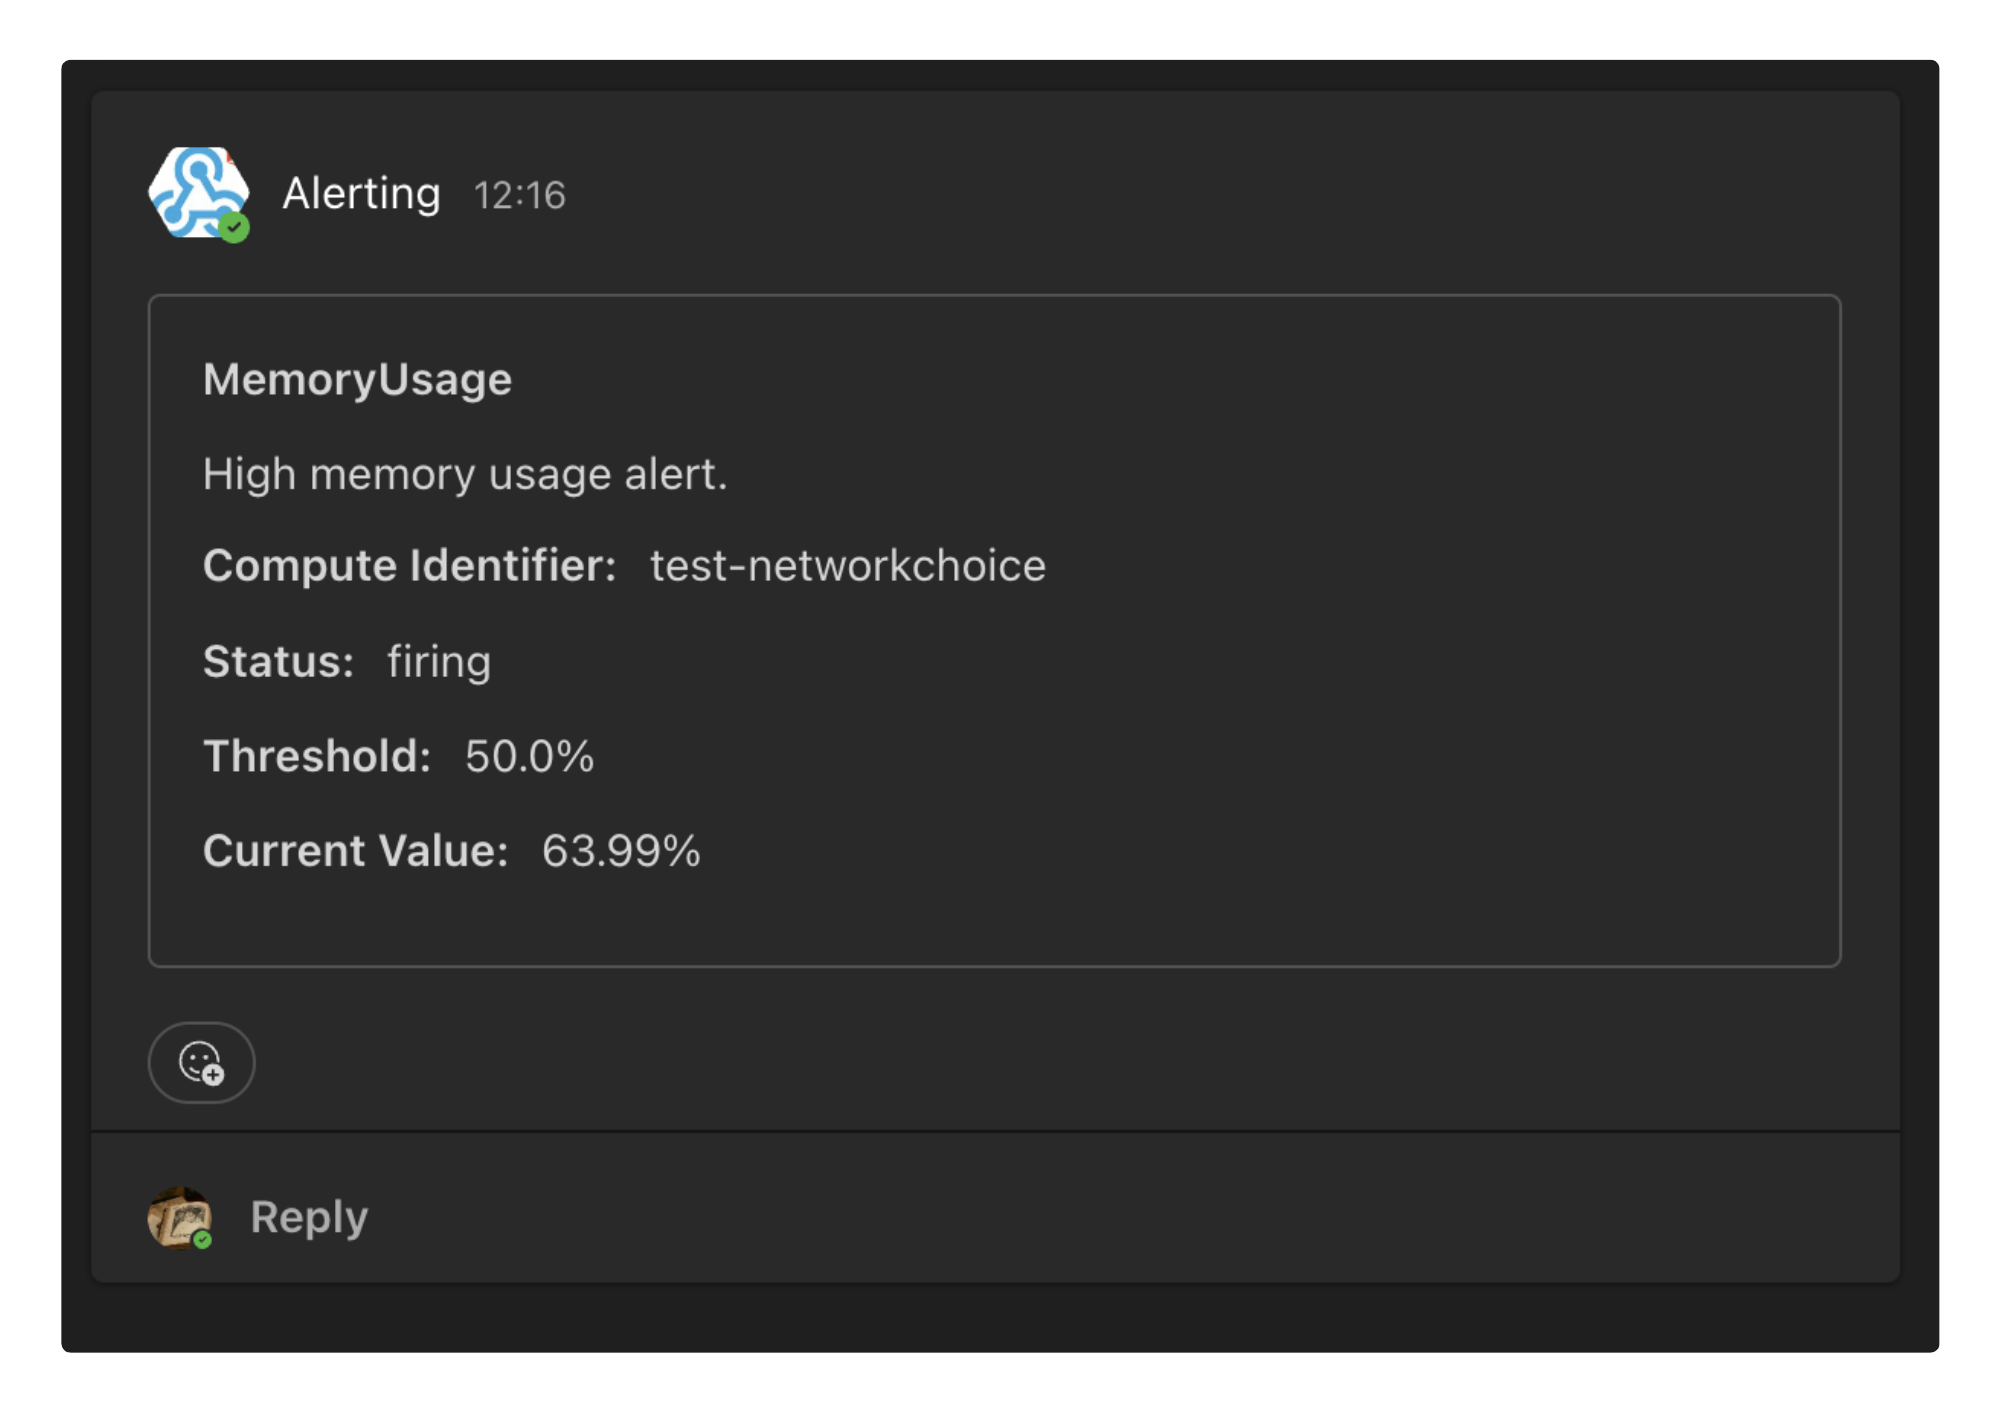
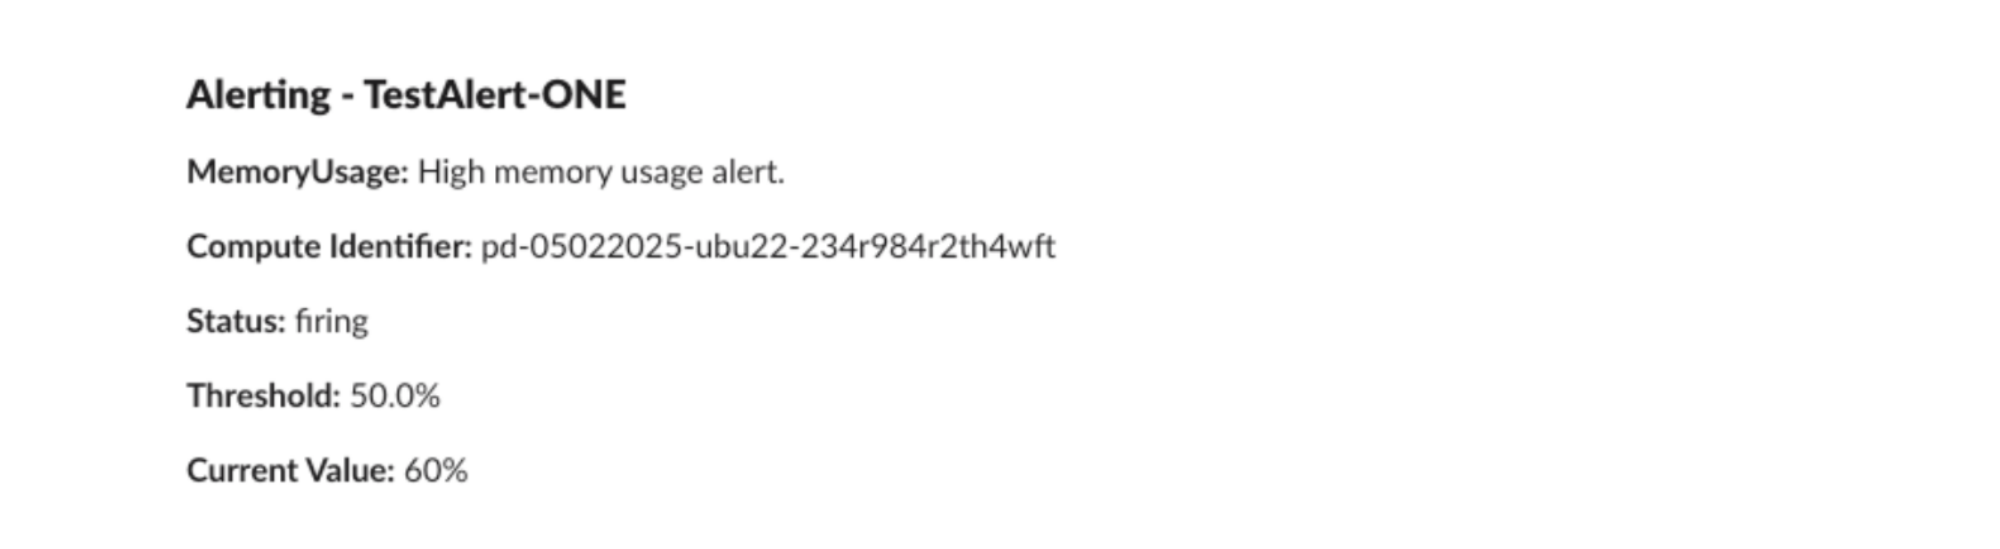
By default, alerts contain a summary, compute item, message describing the breach, Alert Rule name, Threshold value, Actual value, and sometimes a status. A ‘firing’ status indicates simply that an alert was issued. To request alternative text in alerts, please open a ticket in the Support section of the Portal.
Example Email alert:
Example Teams alert:
Example Slack alert:
Example Webhook alert JSON:
{ "rule": { "name": "High CPU Usage", "slug": "CPUUsage", "threshold": 85, "unit": "%", "tenant_short_name": "TenantA", "compute_identifier": "server-1234", "is_global": false }, "alert": { "alert_name": "CPUUsage", "identifier": "alert-5678", "availability_zone": "uk-east", "value": "92", "summary": "CPU usage exceeded threshold of 85%", "description": "The CPU utilization on server-1234 has reached 92%, which is above the defined threshold.", "starts_at": "2025-03-10T12:34:56Z", "status": "firing" }}