Purpose
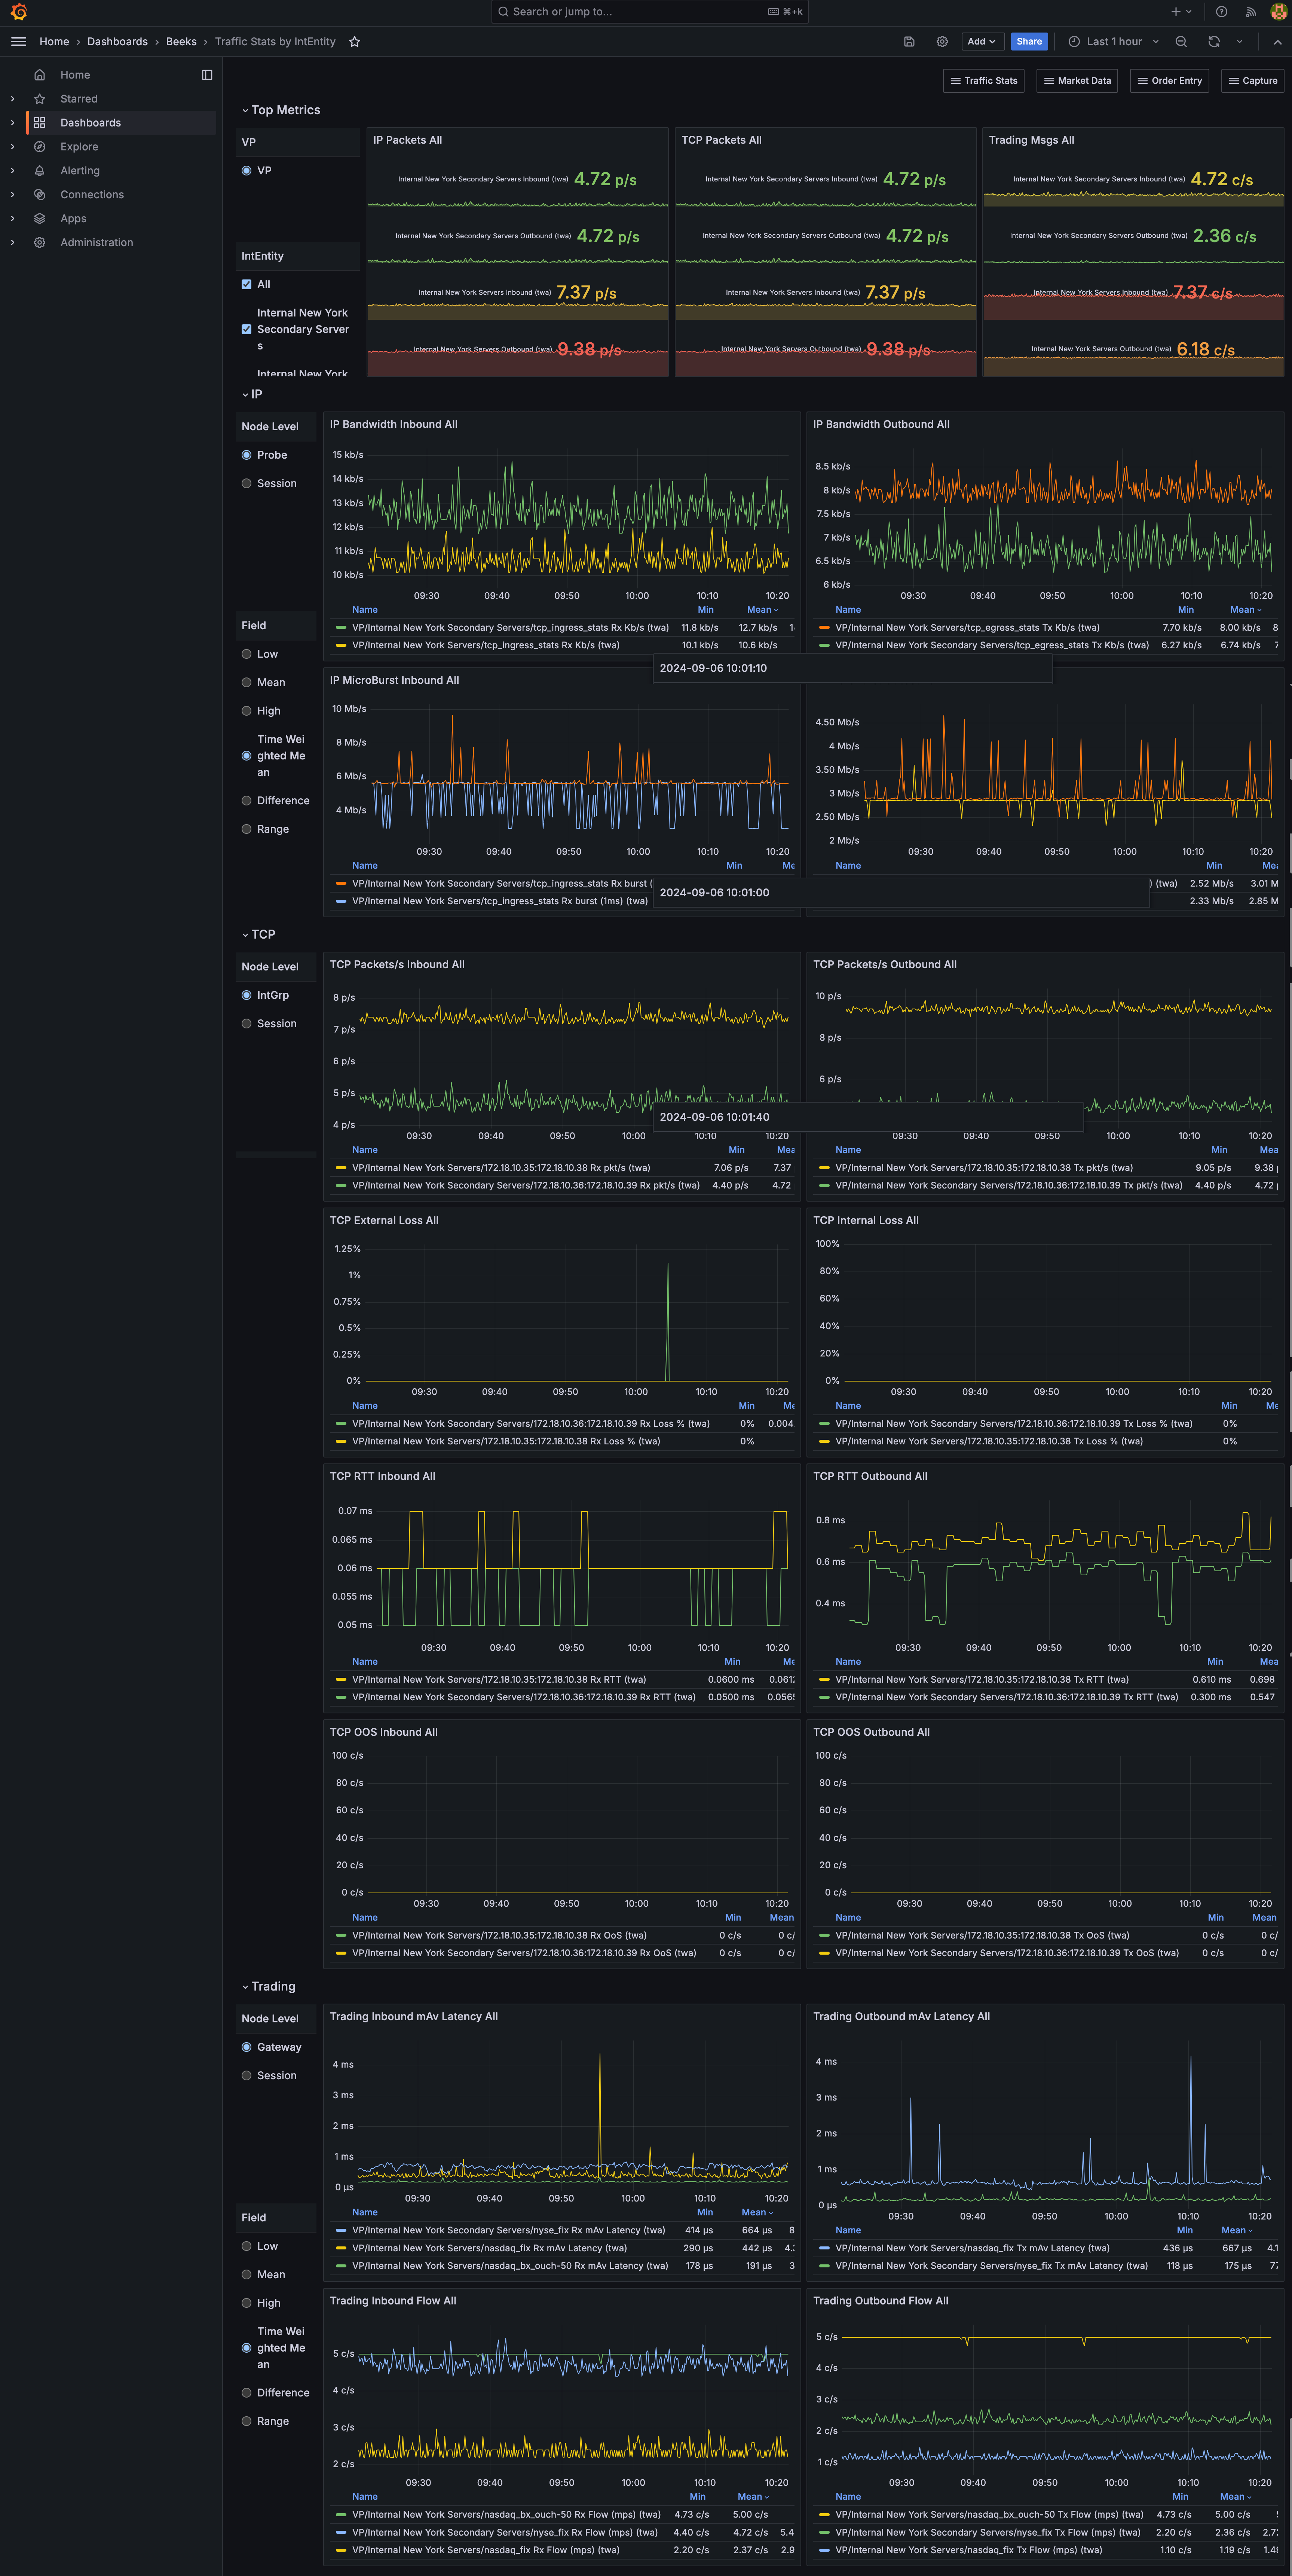
This dashboard shows the Traffic statistics by IntEntity.
Usage instructions
Switch between Visibility Points and select the set of IntEntity’s to view.
In the visualisation panels, you can switch IP between Probe and Session views.
You can also switch between Low, Mean, High, Time Weighted Mean, Difference, and Range to view different aspects of the data.
Panel overview
The Top Metrics panels are:
IP Packets All
TCP Packets All
Trading Messages All
IP Bandwidth Inbound All
IP Bandwidth Outbound All
IP MicroBurst Inbound All
IP MicroBurst Outbound All
The TCP panels are:
TCP Packets per second Inbound All
TCP Packets per second Outbound All
TCP External Loss All
TCP Internal Loss All
TCP RTT Inbound All
TCP RTT Outbound All
TCP OOS Inbound All
TCP OOO Outbound All
The Trading panels are:
Trading Inbound Moving Average Latency All
Trading Outbound Moving Average Latency All
Trading Inbound Flow All
Trading Outbound Flow All