In this section of the document, we explain how to configure Grafana alerts in VMX-Explorer by setting up:
Contact Points that specify who receive the alert notifications.
Alert Rules that will each define the condition that must be met before an alert fires.
Note that Beeks provides a set of Health Alert Rules, which are enabled/disabled on the CLI. See here for more information. All other Alert Rules must be created in VMX-Explorer as per the instructions below.Notification Policies that specify how the alerts are routed to the Contact Points.
You can create Grafana alerts for your Beeks Analytics appliance and for any other monitoring application from which Grafana can receive the relevant data.
Important
The alerting setup is NOT complete until you’ve configured all three of the above and a test alert has been generated and received at your chosen alerting endpoint.
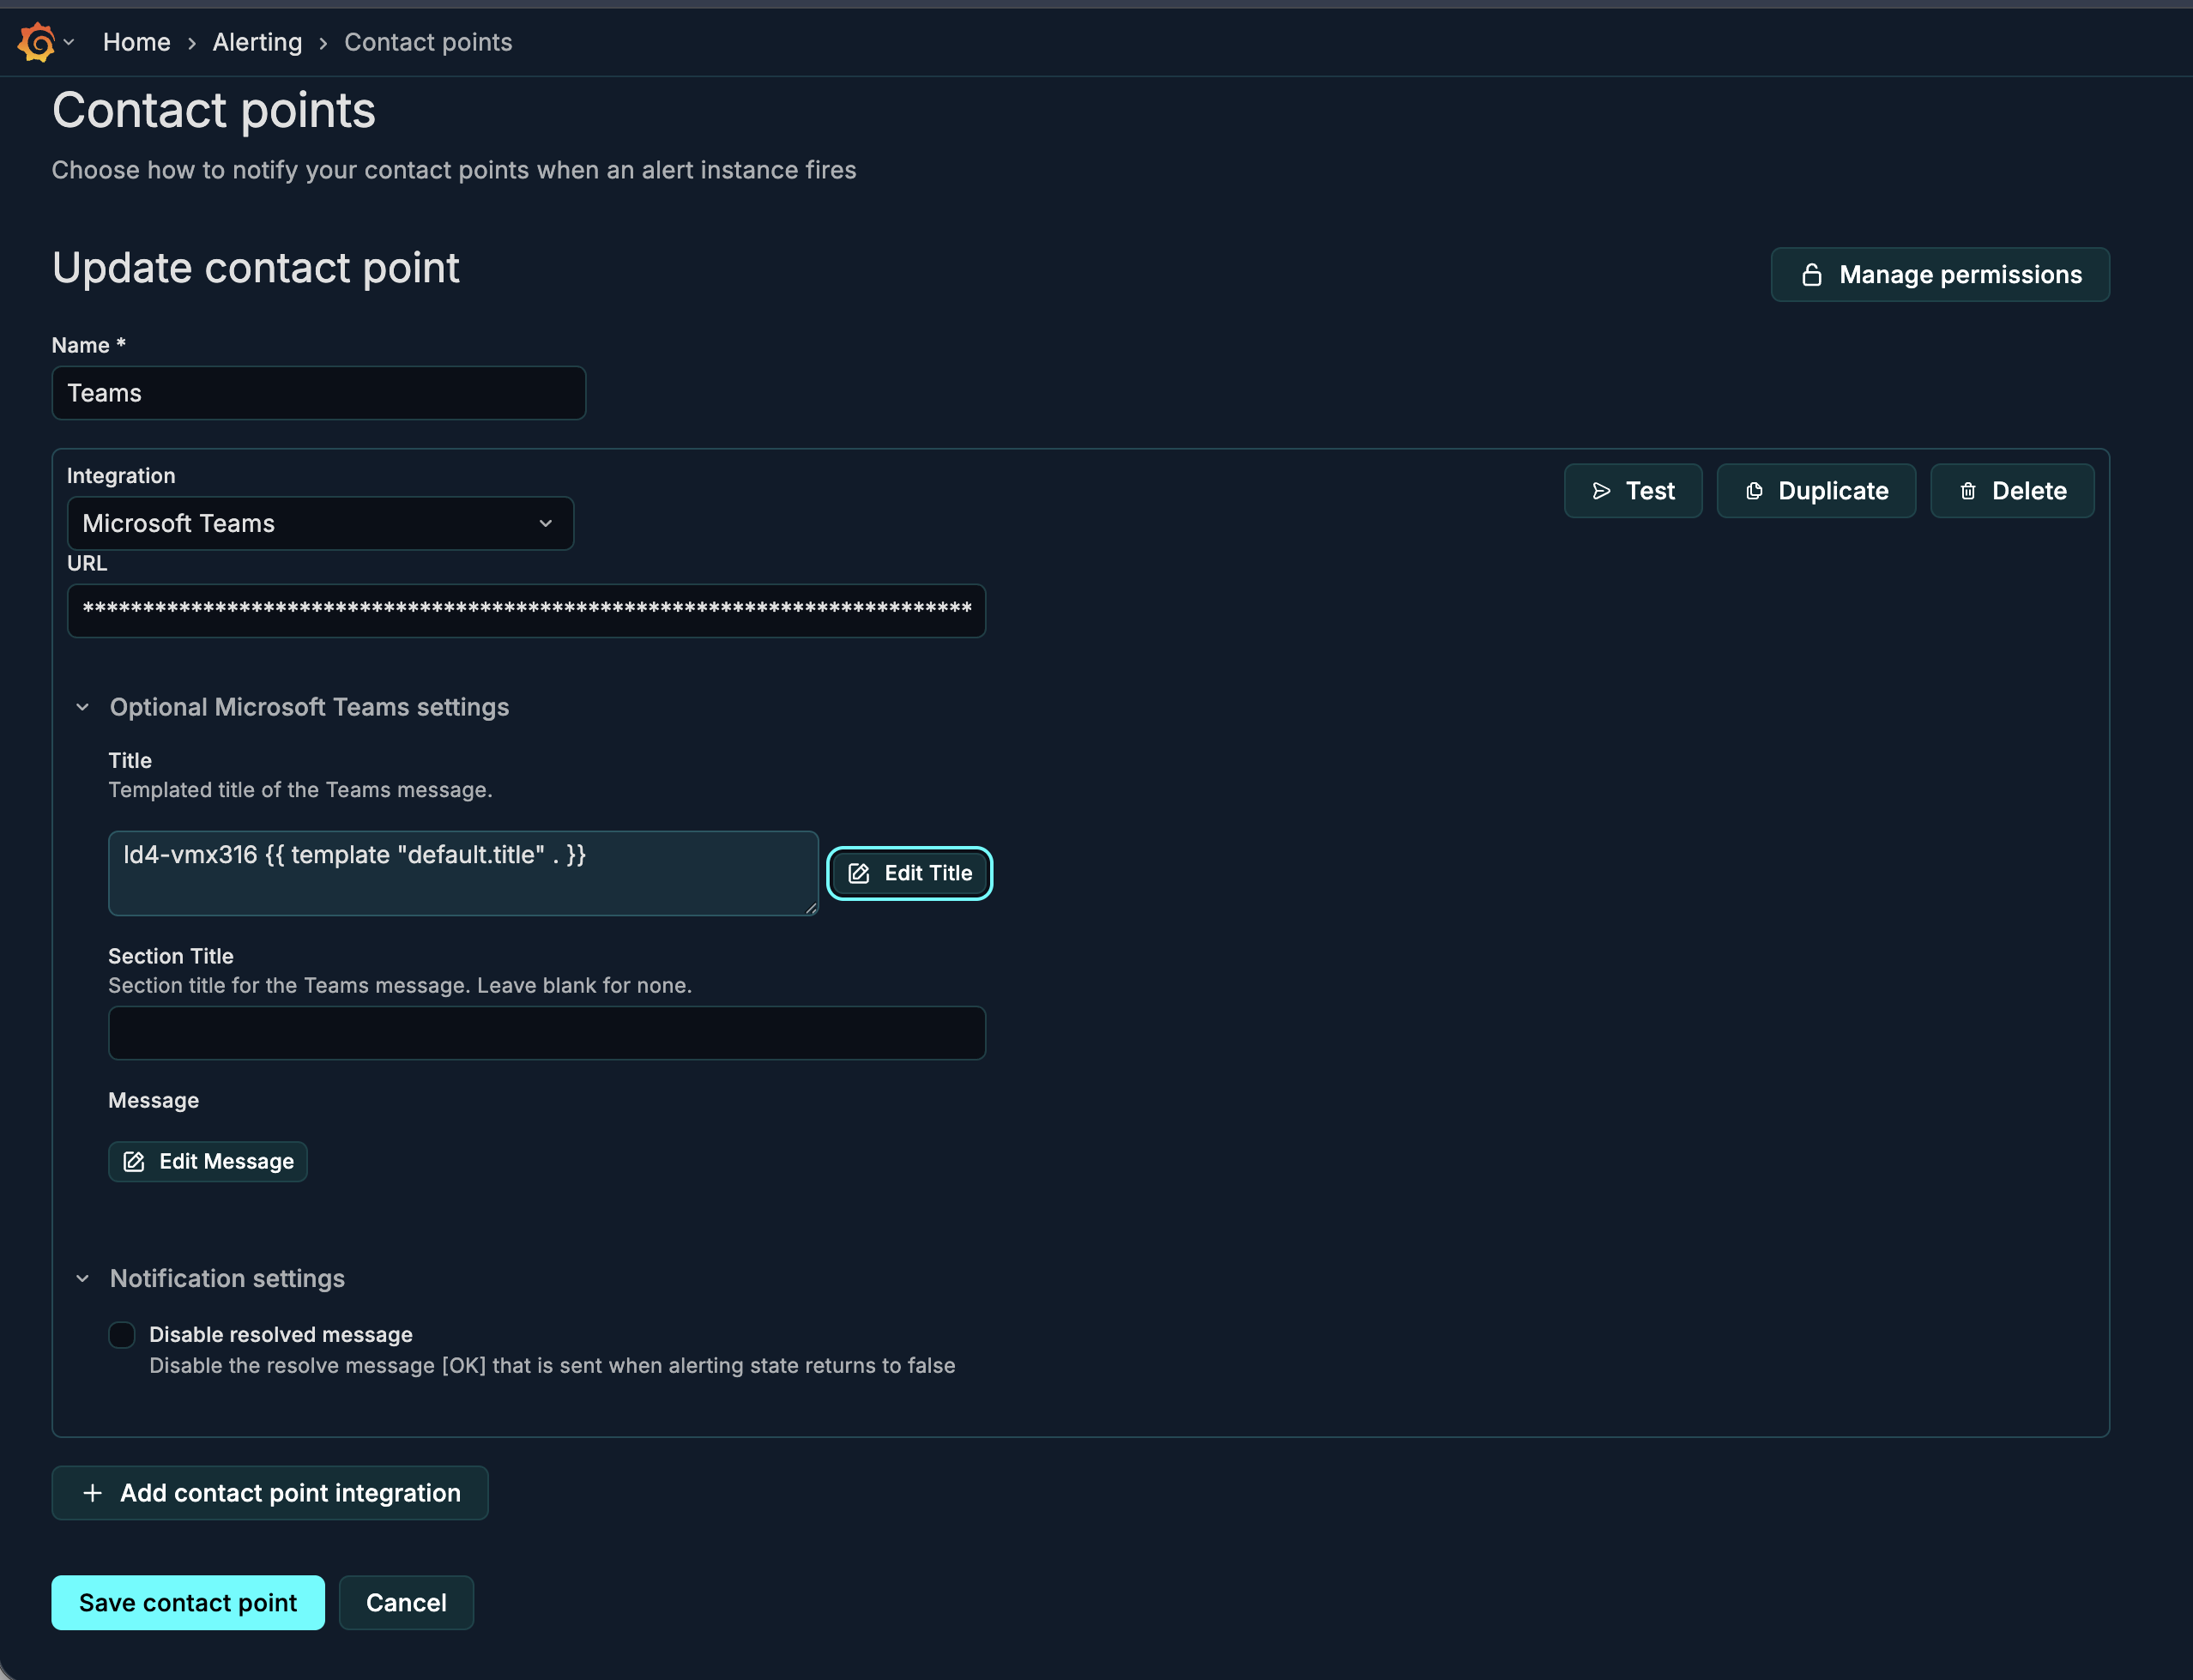
Create your Contact Points
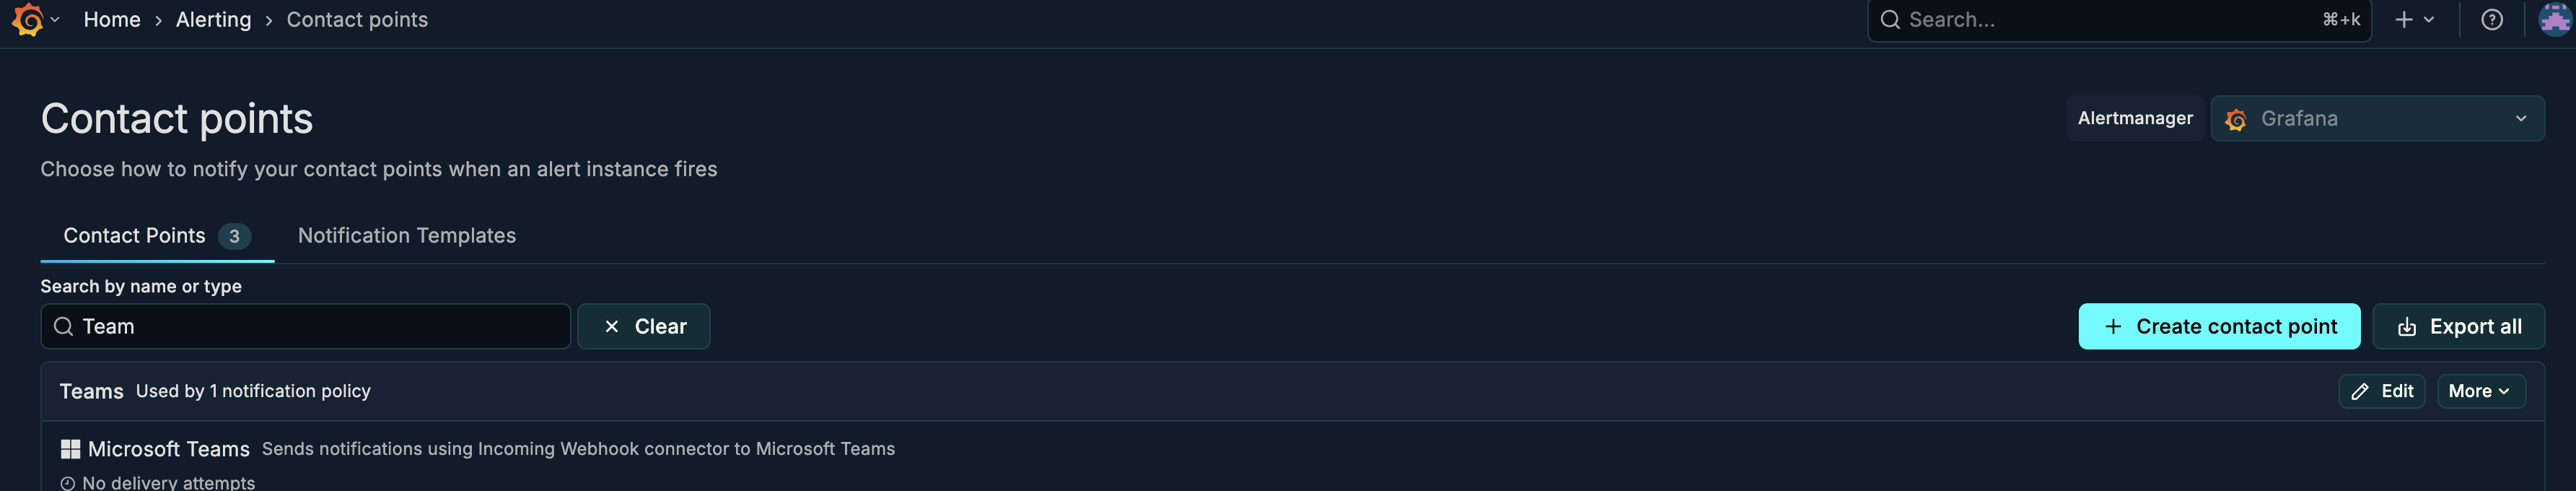
Contact points define the possible destinations for alert notifications, such as users or external applications connected to Grafana. Contact points must use one of the integrations supported by Grafana, which are listed here. We like Webhooks, which are very flexible.
Open VMX-Explorer.
Follow the instructions in the Grafana documentation to set up your Contact Points in VMX-Explorer.
About Contact Points
You can create as many Contact Points as you need.
Notification Policies enforce how Contact Points are used.
You can send to one or multiple Contact Points.
If you want to format the notification received at the endpoint, you can use Notification Templates, which use markup to translate alert output into formatted content. Some customers like to customise the Notification Template for the Alerts sent by the Contact Point to include additional information, e.g., host identifier. Follow Grafana documentation if you want to customise them, but the defaults work well and are kept up-to-date by Grafana.
Create your custom Alert Rules
Use Alert Rules to define the condition that must be met before an Alert fires.
You will create custom Alert Rules in VMX-Explorer. We provide worked examples here, but the process is as follows.
Open VMX-Explorer.
Follow the instructions in the Grafana documentation to set up your custom Alert Rules in VMX-Explorer.
As well as allowing you to create your own custom Alert Rules, Beeks Analytics provides a set of pre-defined Alert Rules. These are managed slightly differently. See here for instructions.
About Alert Rules
In VMX-Explorer, all Alert Rules are stored in an Alerts folder at the same level as the Beeks folder. The folder appears as a label in the resulting alerts.
An evaluation group of Alert Rules is already inside the Alerts folder. You can provision and export these groups.
Click to expand the folder and the group to see the list of alerts.
For each Alert Rule, there can be many instances of the Alert. This is the superset of all labels associated with that Alert Rule.
We recommend that you add custom labels to route alerts to different destinations.
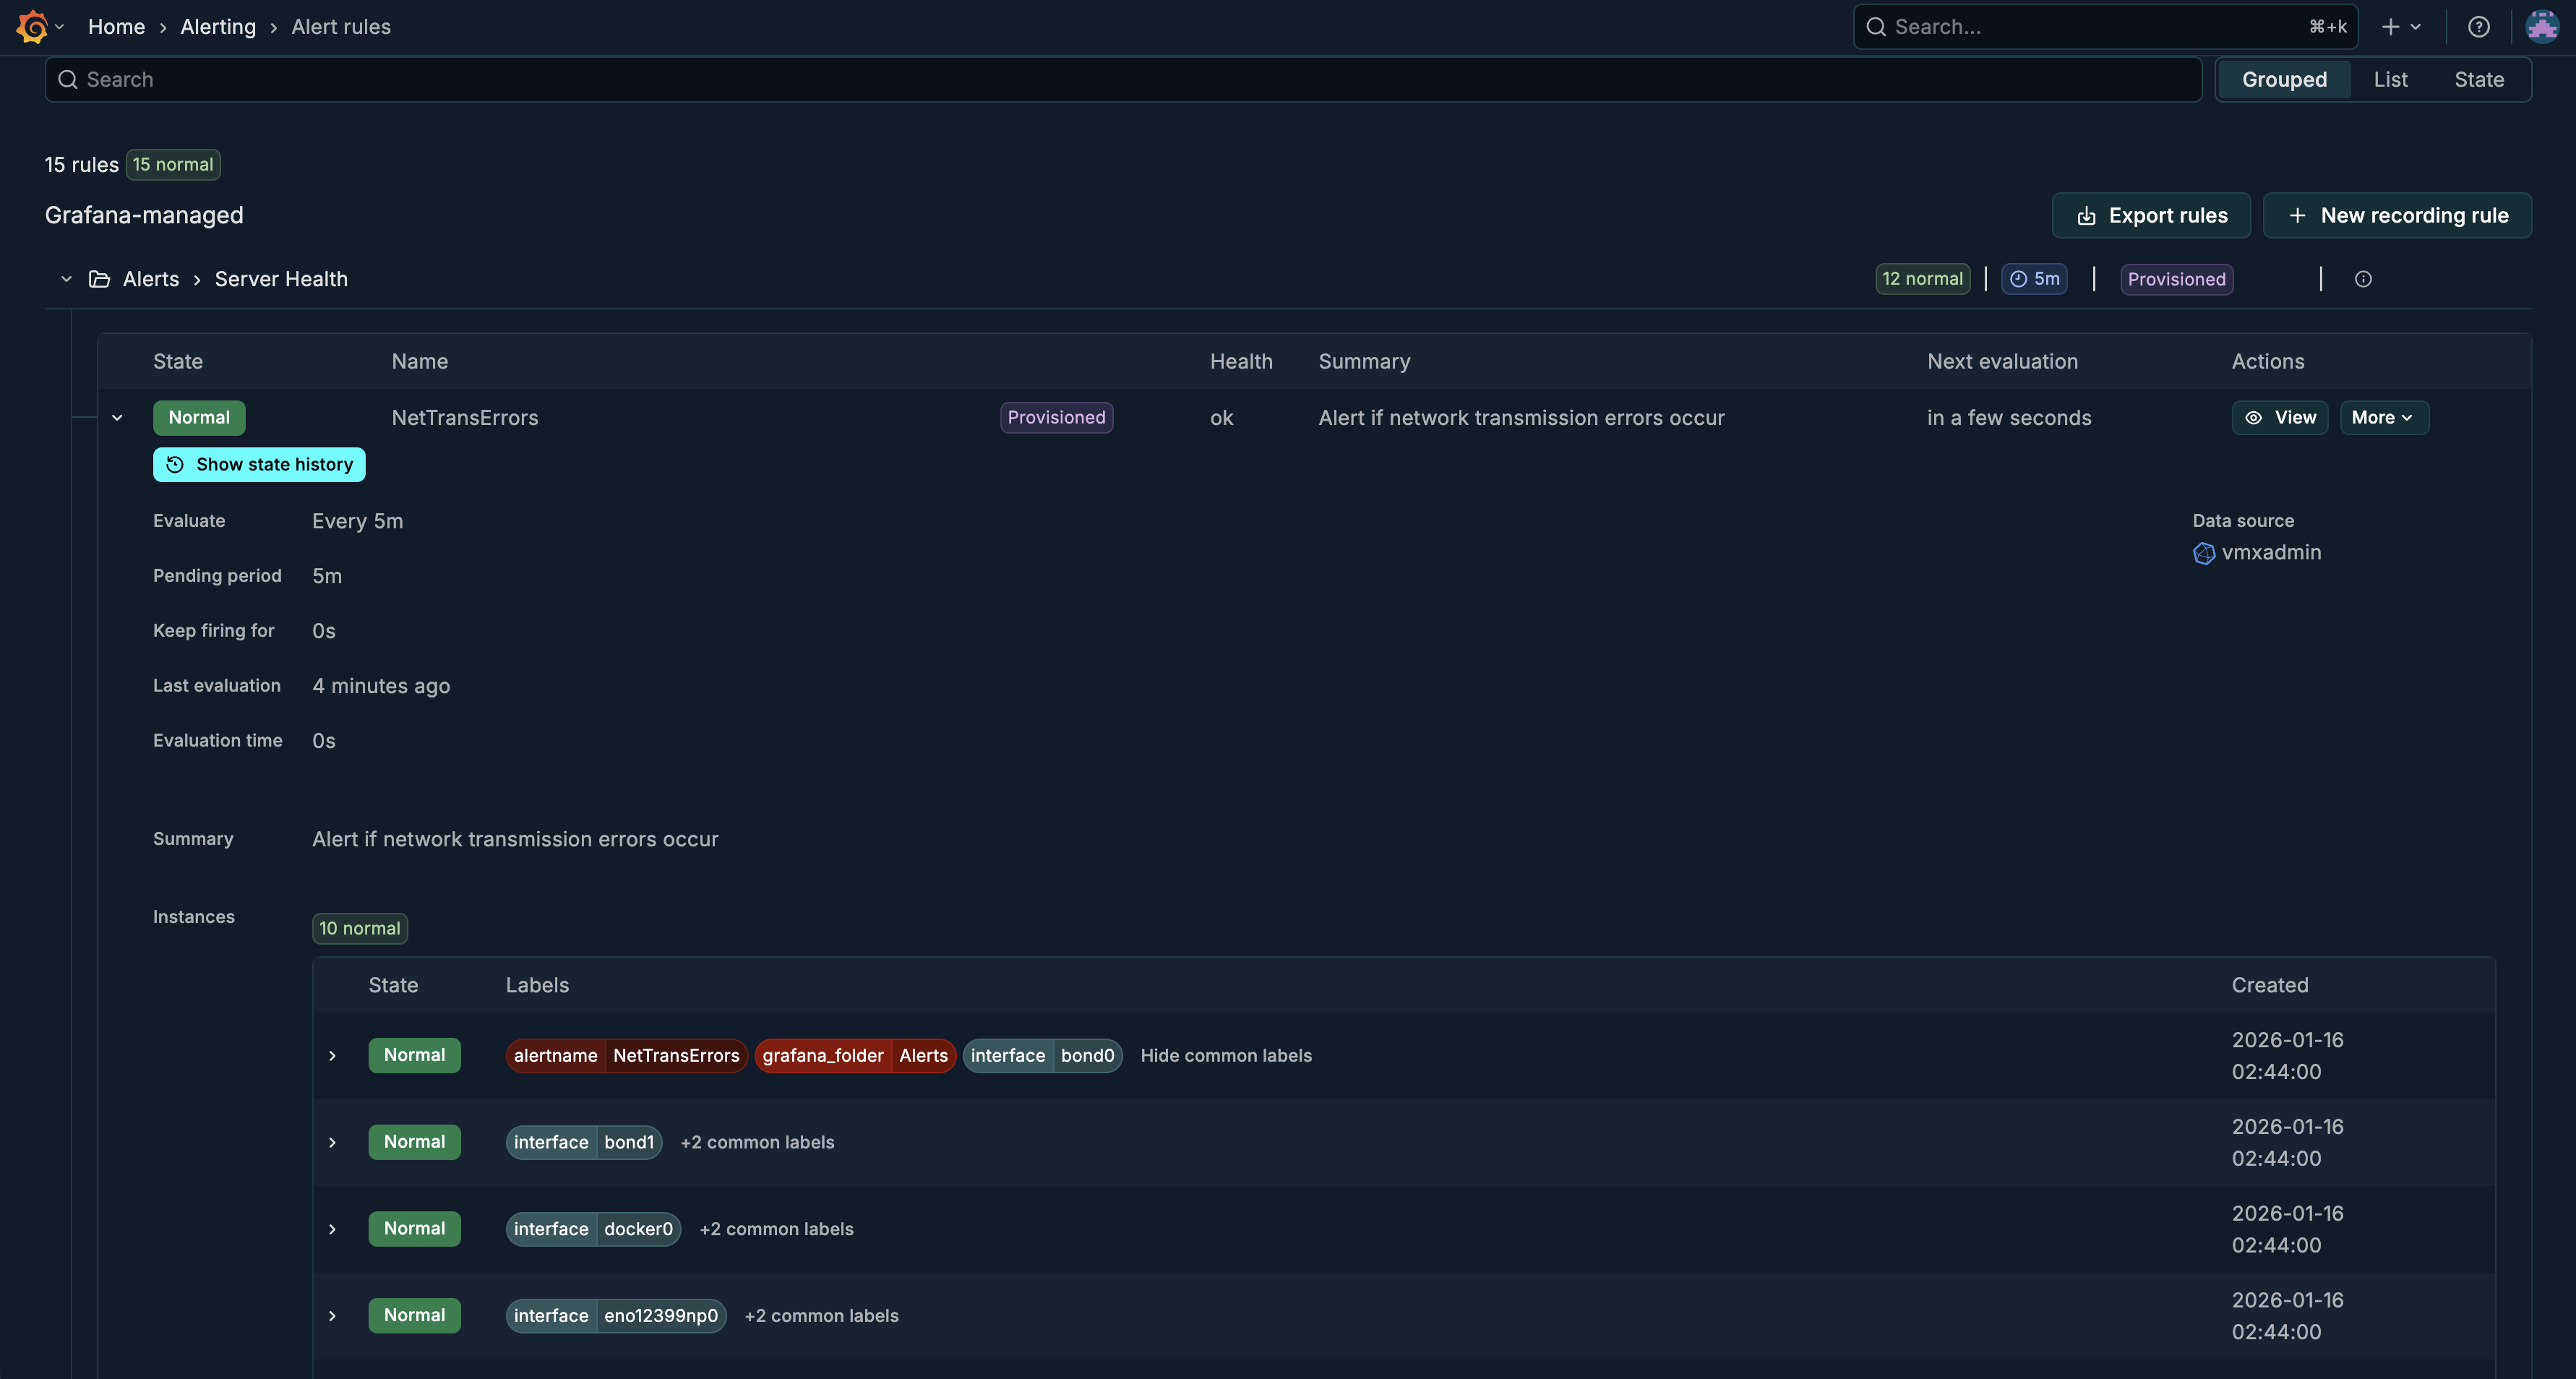
In the example below, the Alerts > Server Health folder shows an Alert Rules called NetTransErrors, which will alert if network transmission errors occur.
alertName, grafana_folder, and interface are the set of labels used for routing in this Alert Rule and there are multiple instances - one for each interface:
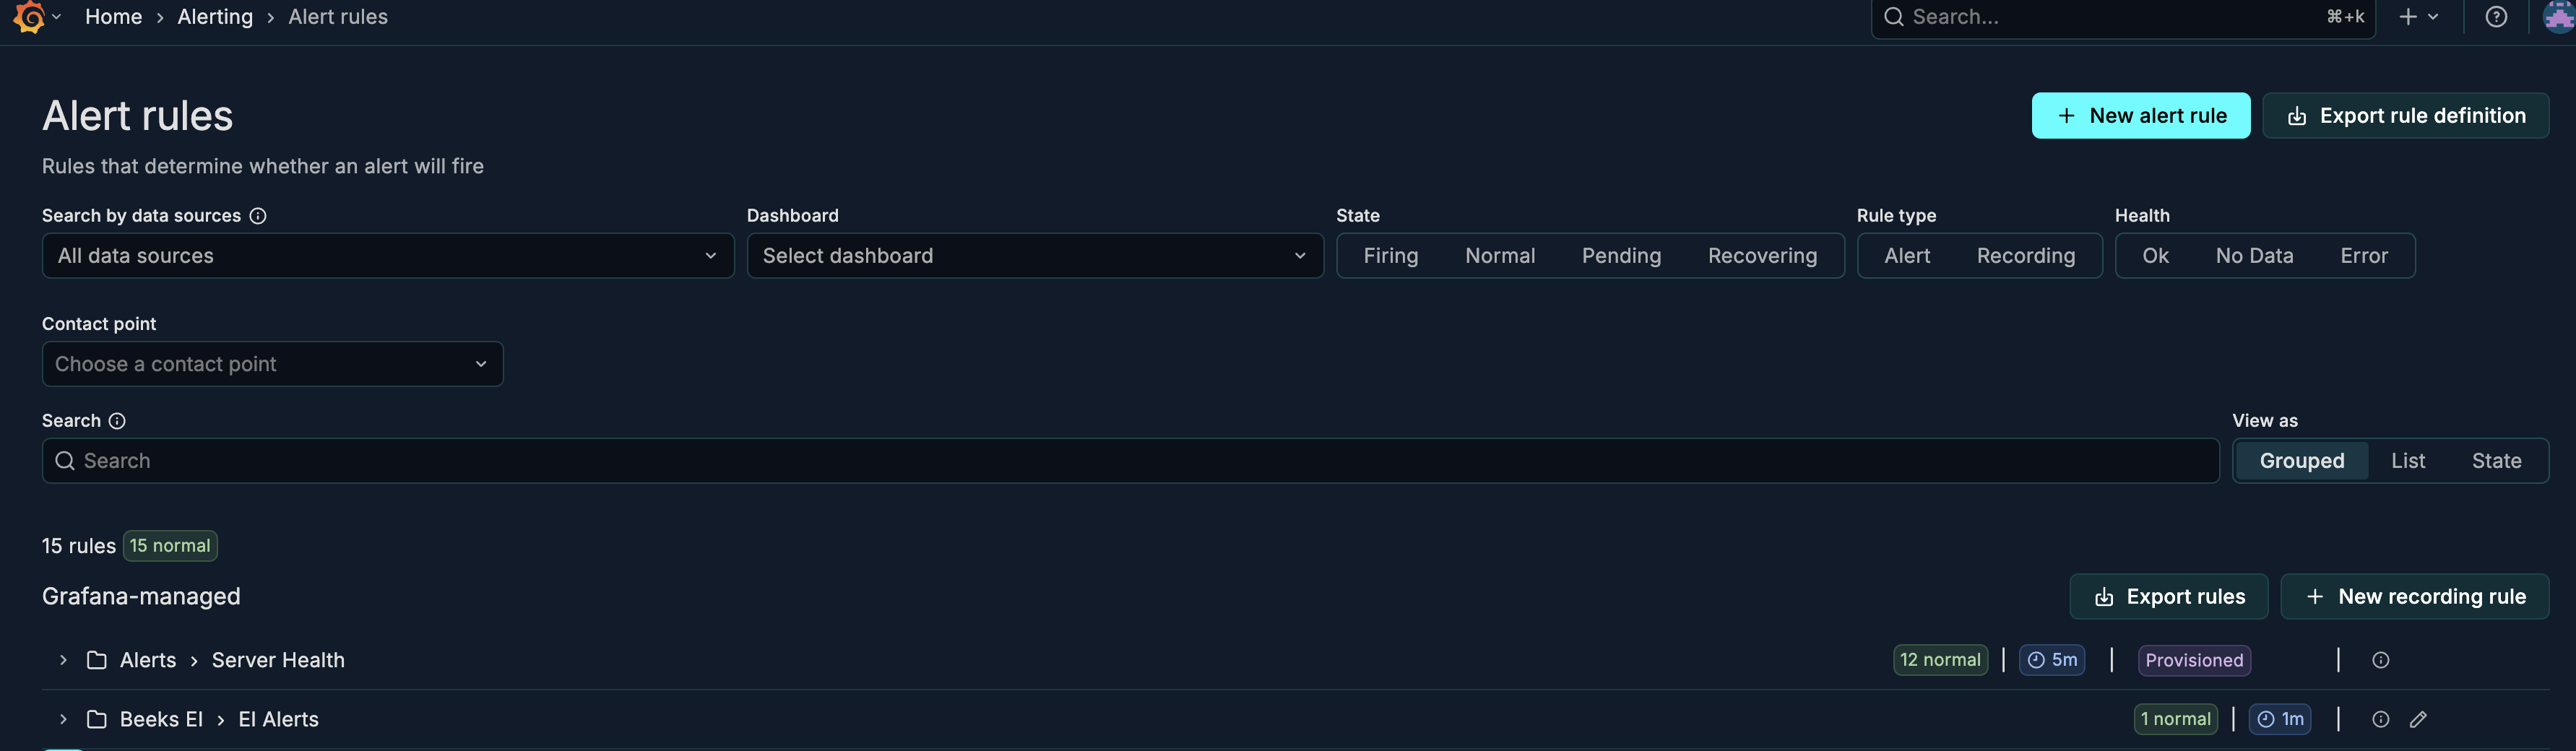
The Alert rules view is a good place to see the set of labels that are available for Alert routing:
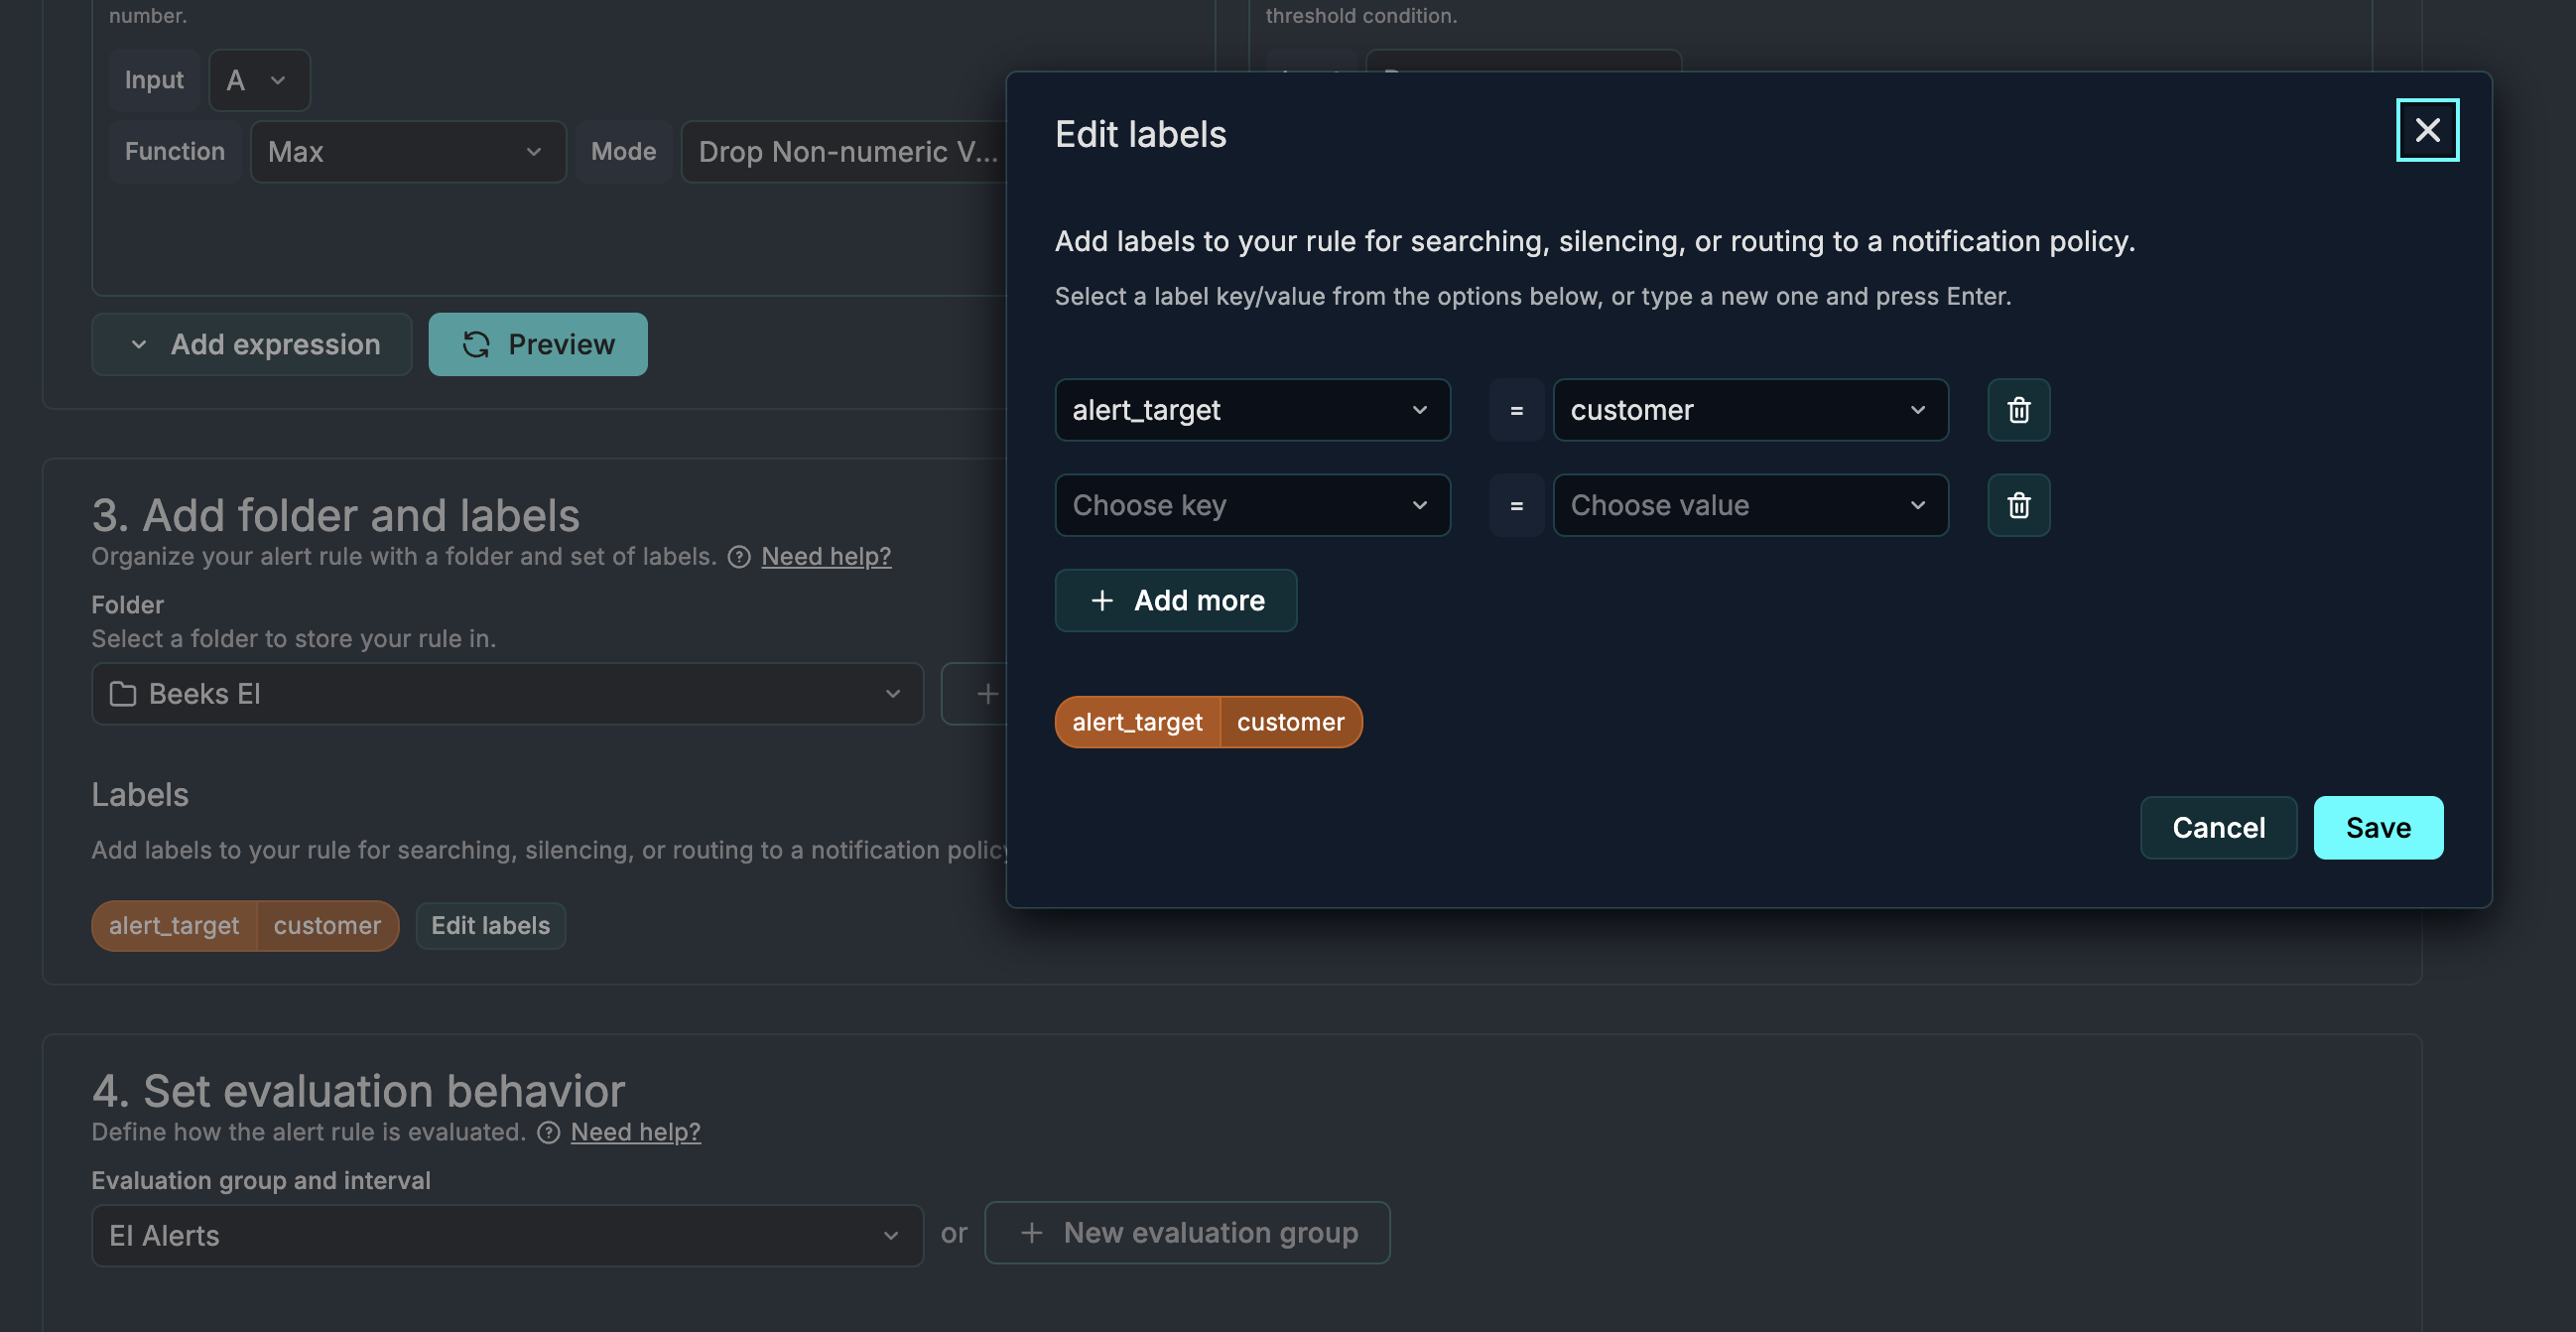
For Beeks Managed appliances, we use grafana_folder=Alerts for provisioned appliance alerting. For customer-generated alerts, it can be useful to add a label e.g. alert_target=customer in the Alert Rule definition to help with routing in the Notification Policies:
You can preview the Notification Policy evaluation in the Alert Rule to see how the labels would get routed. In the example below, the Notification Policy is the default policy:
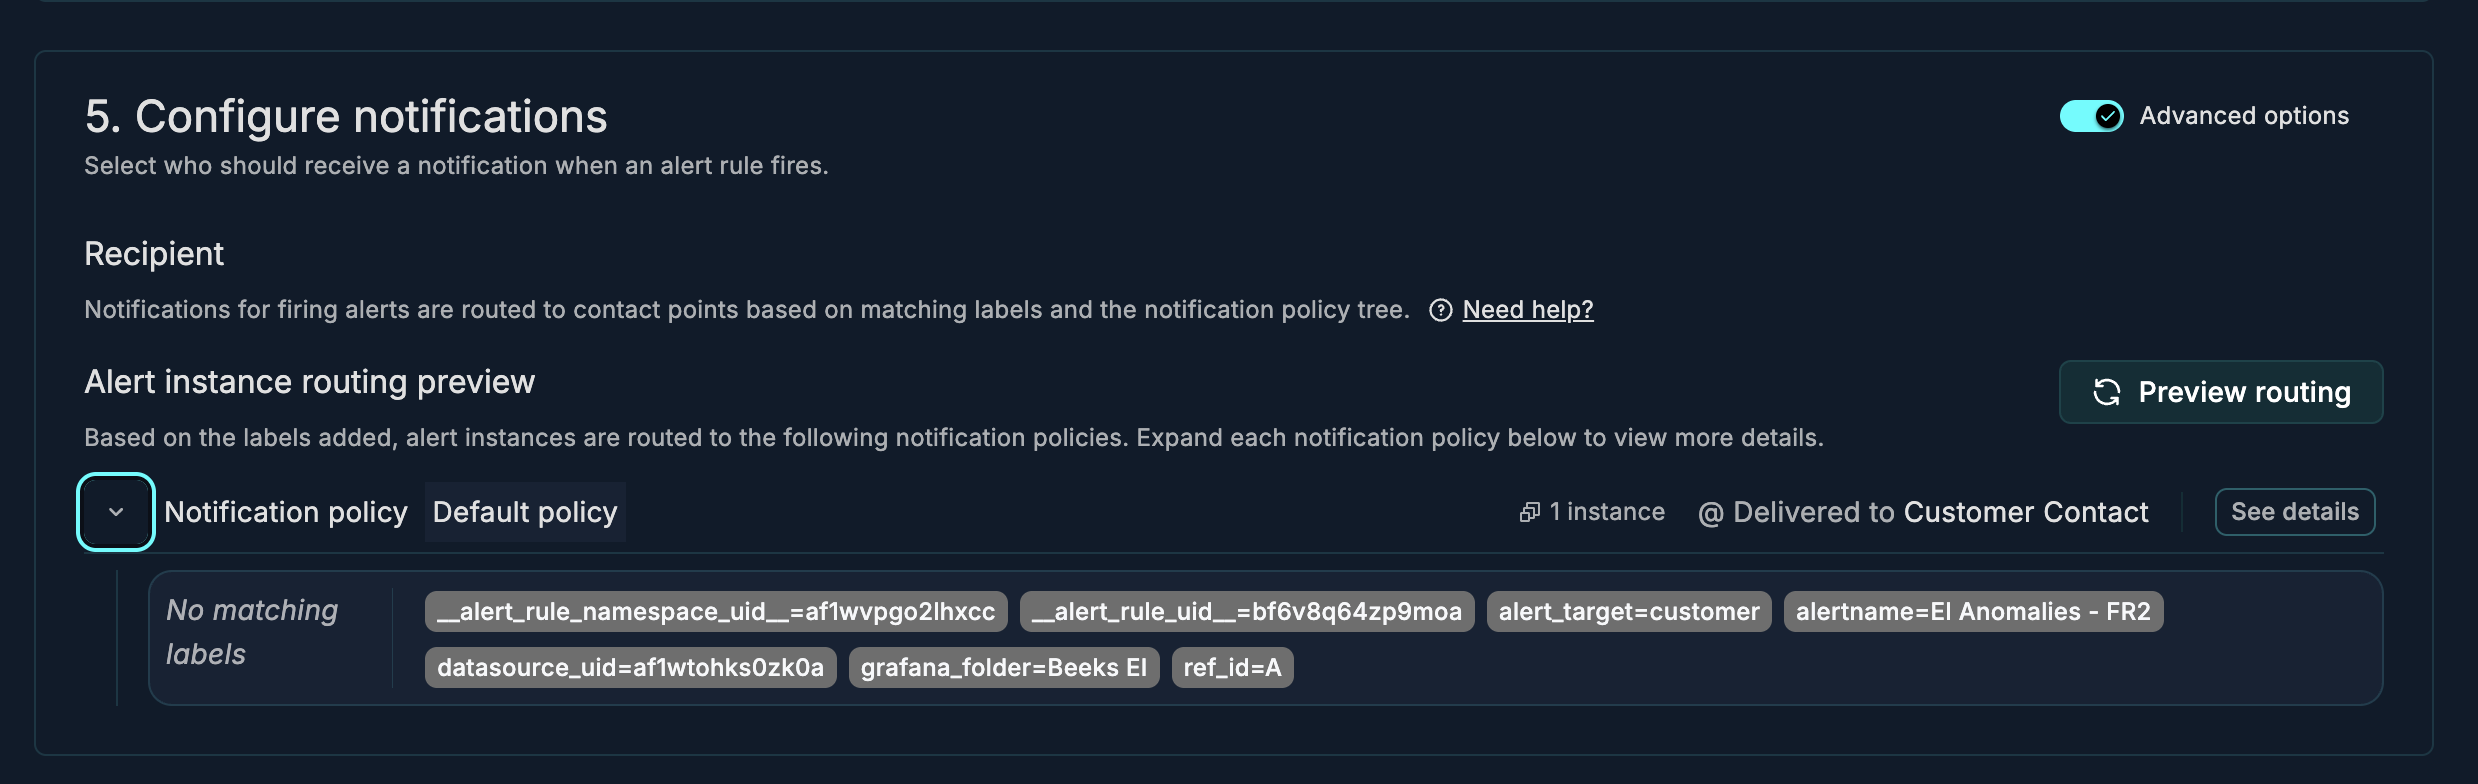
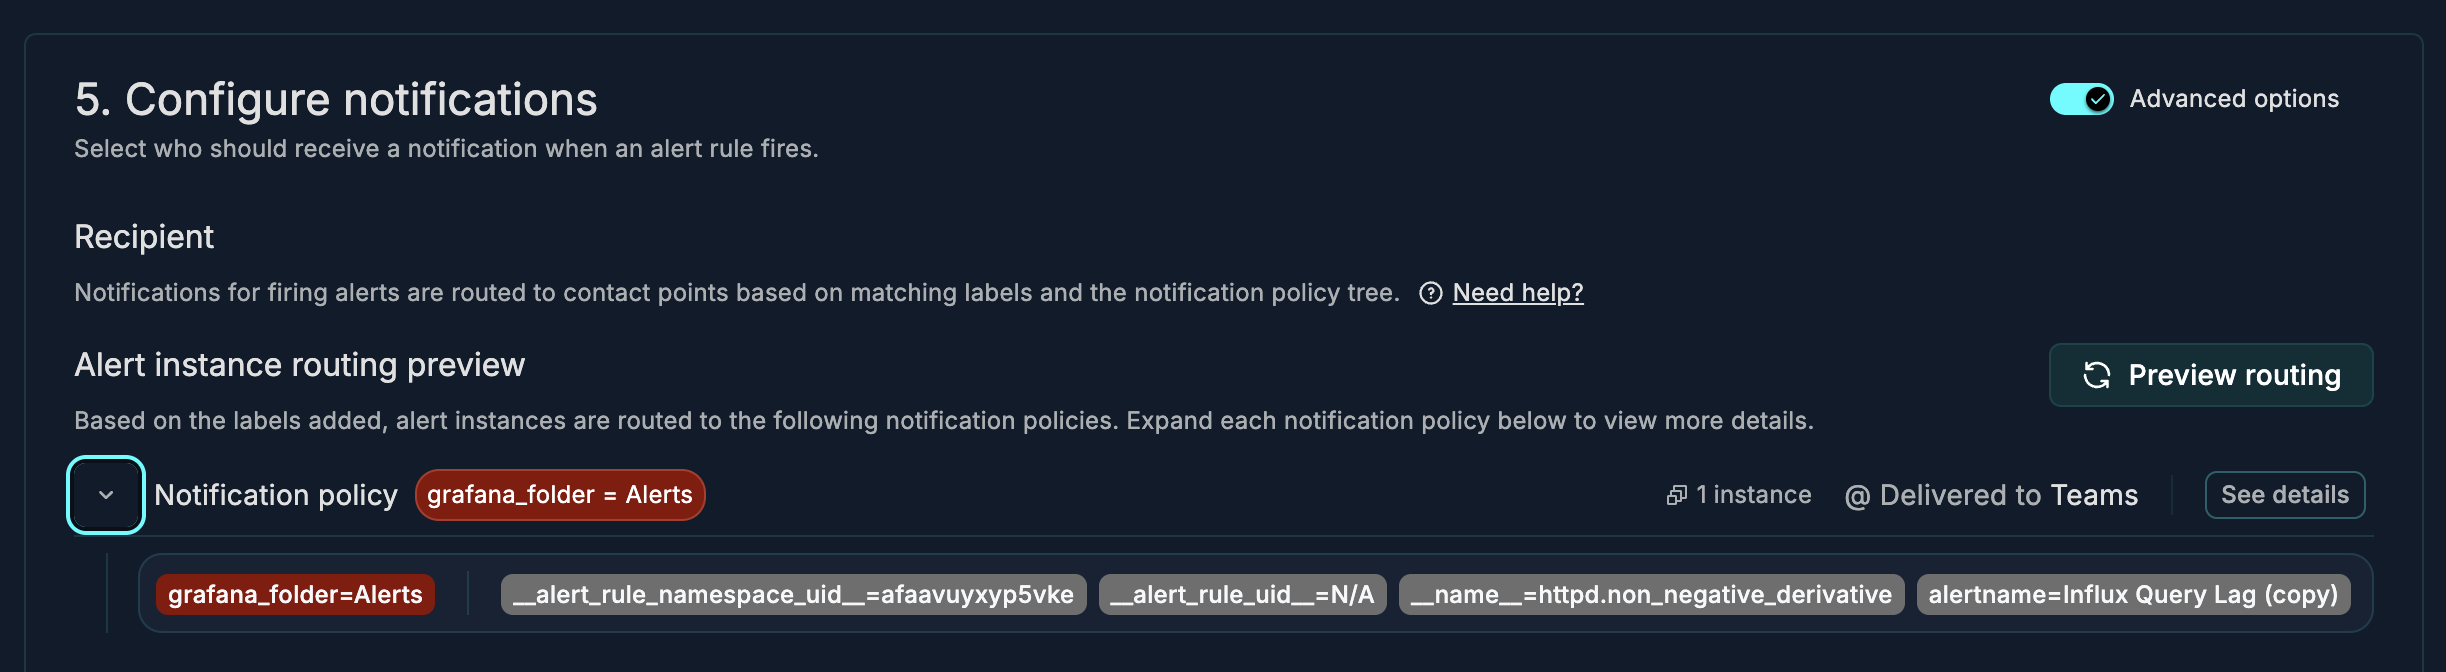
In the example below, the Alert is routed based on the grafana_folder:
Creating your Notification Policies
Notification policies are used to evaluate labels, manage group alerts, and decide which Contact Points to route alerts to.
Open VMX-Explorer.
Follow the instructions in the Grafana documentation to set up your Notification Policies in VMX-Explorer.
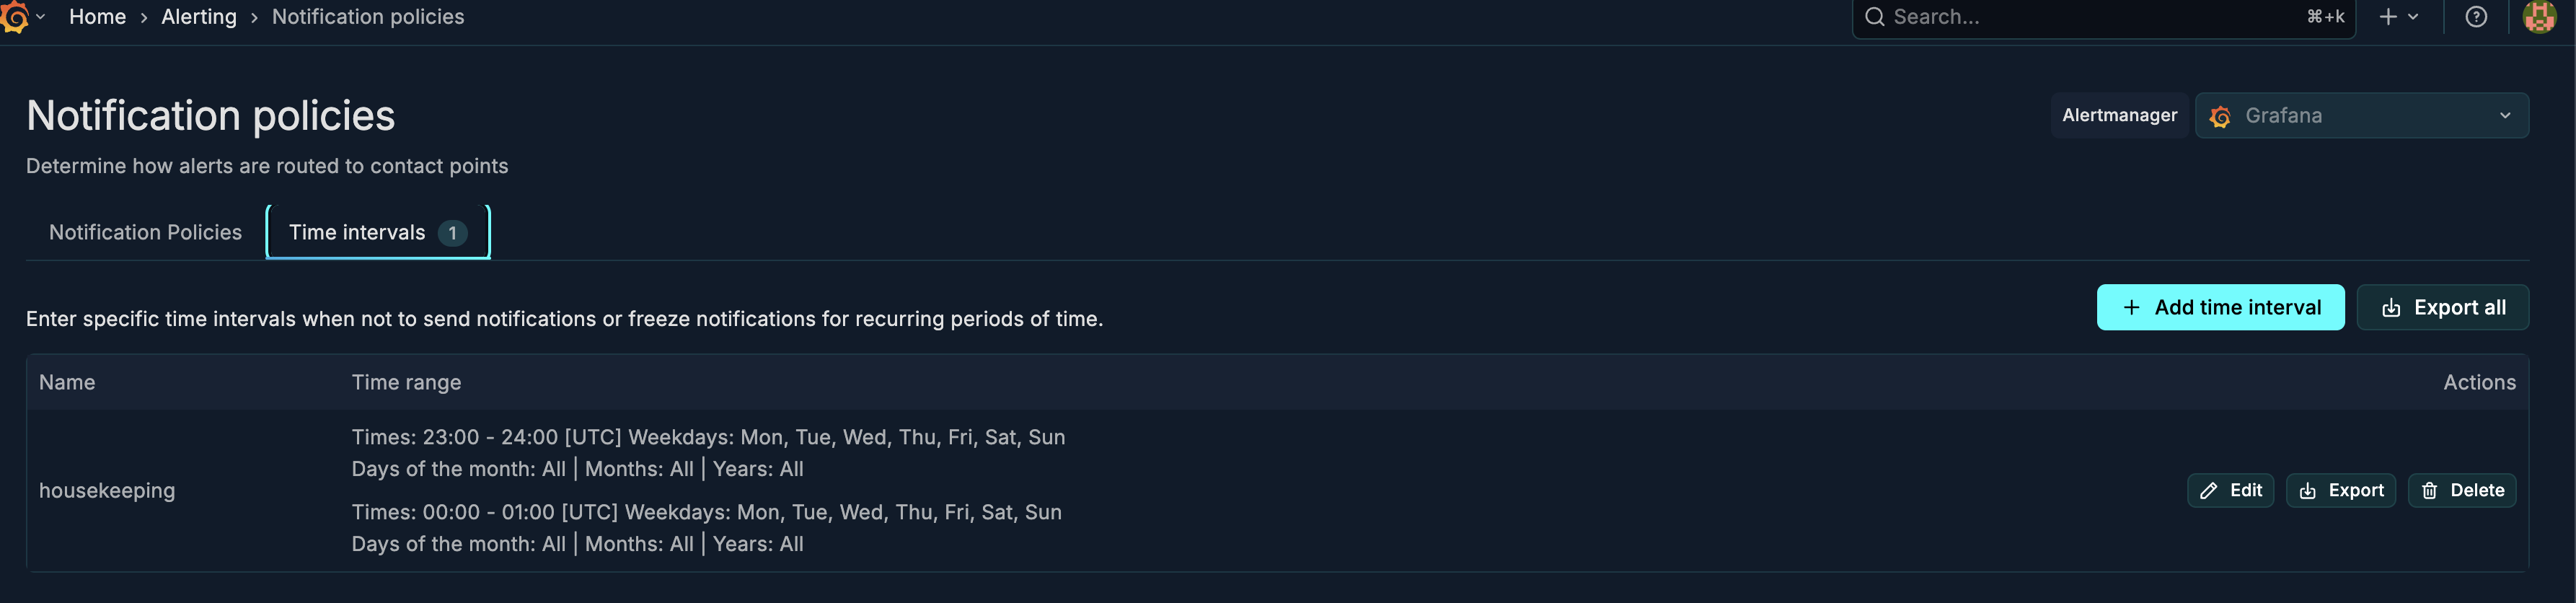
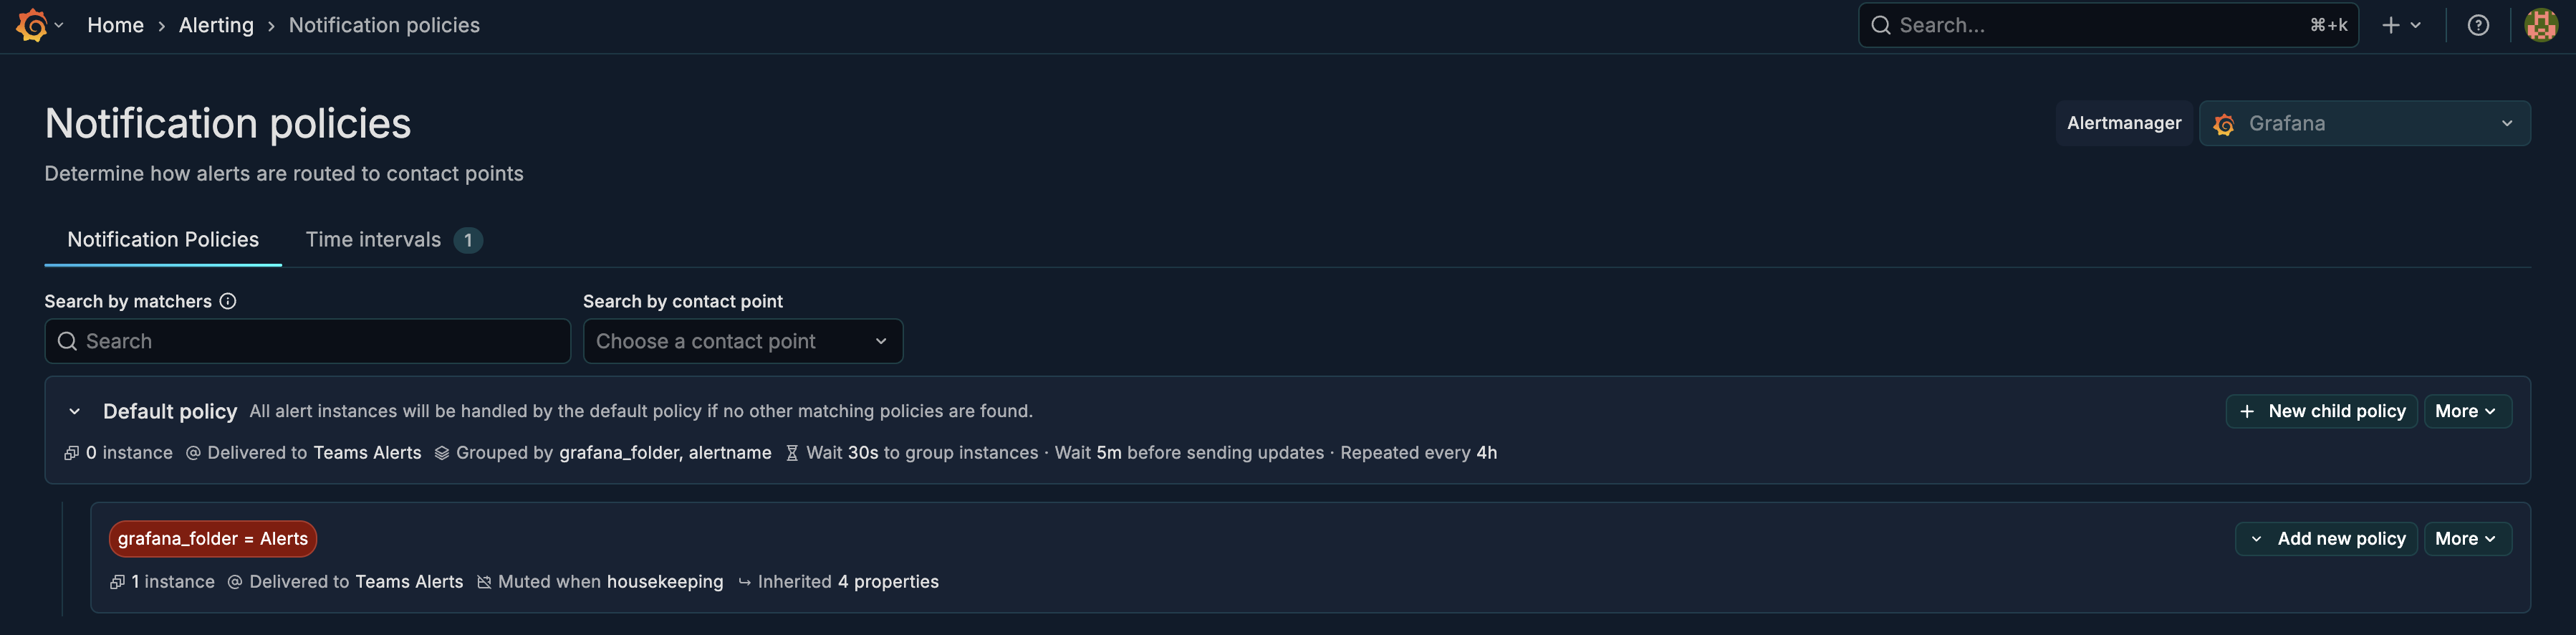
In the example below, the policy routes any alerts in grafana_folder=Alerts to the Teams Alerts Contact Point, and we leave a housekeeping downtime between 11pm and 1am to prevent any application downtime from triggering alerts.
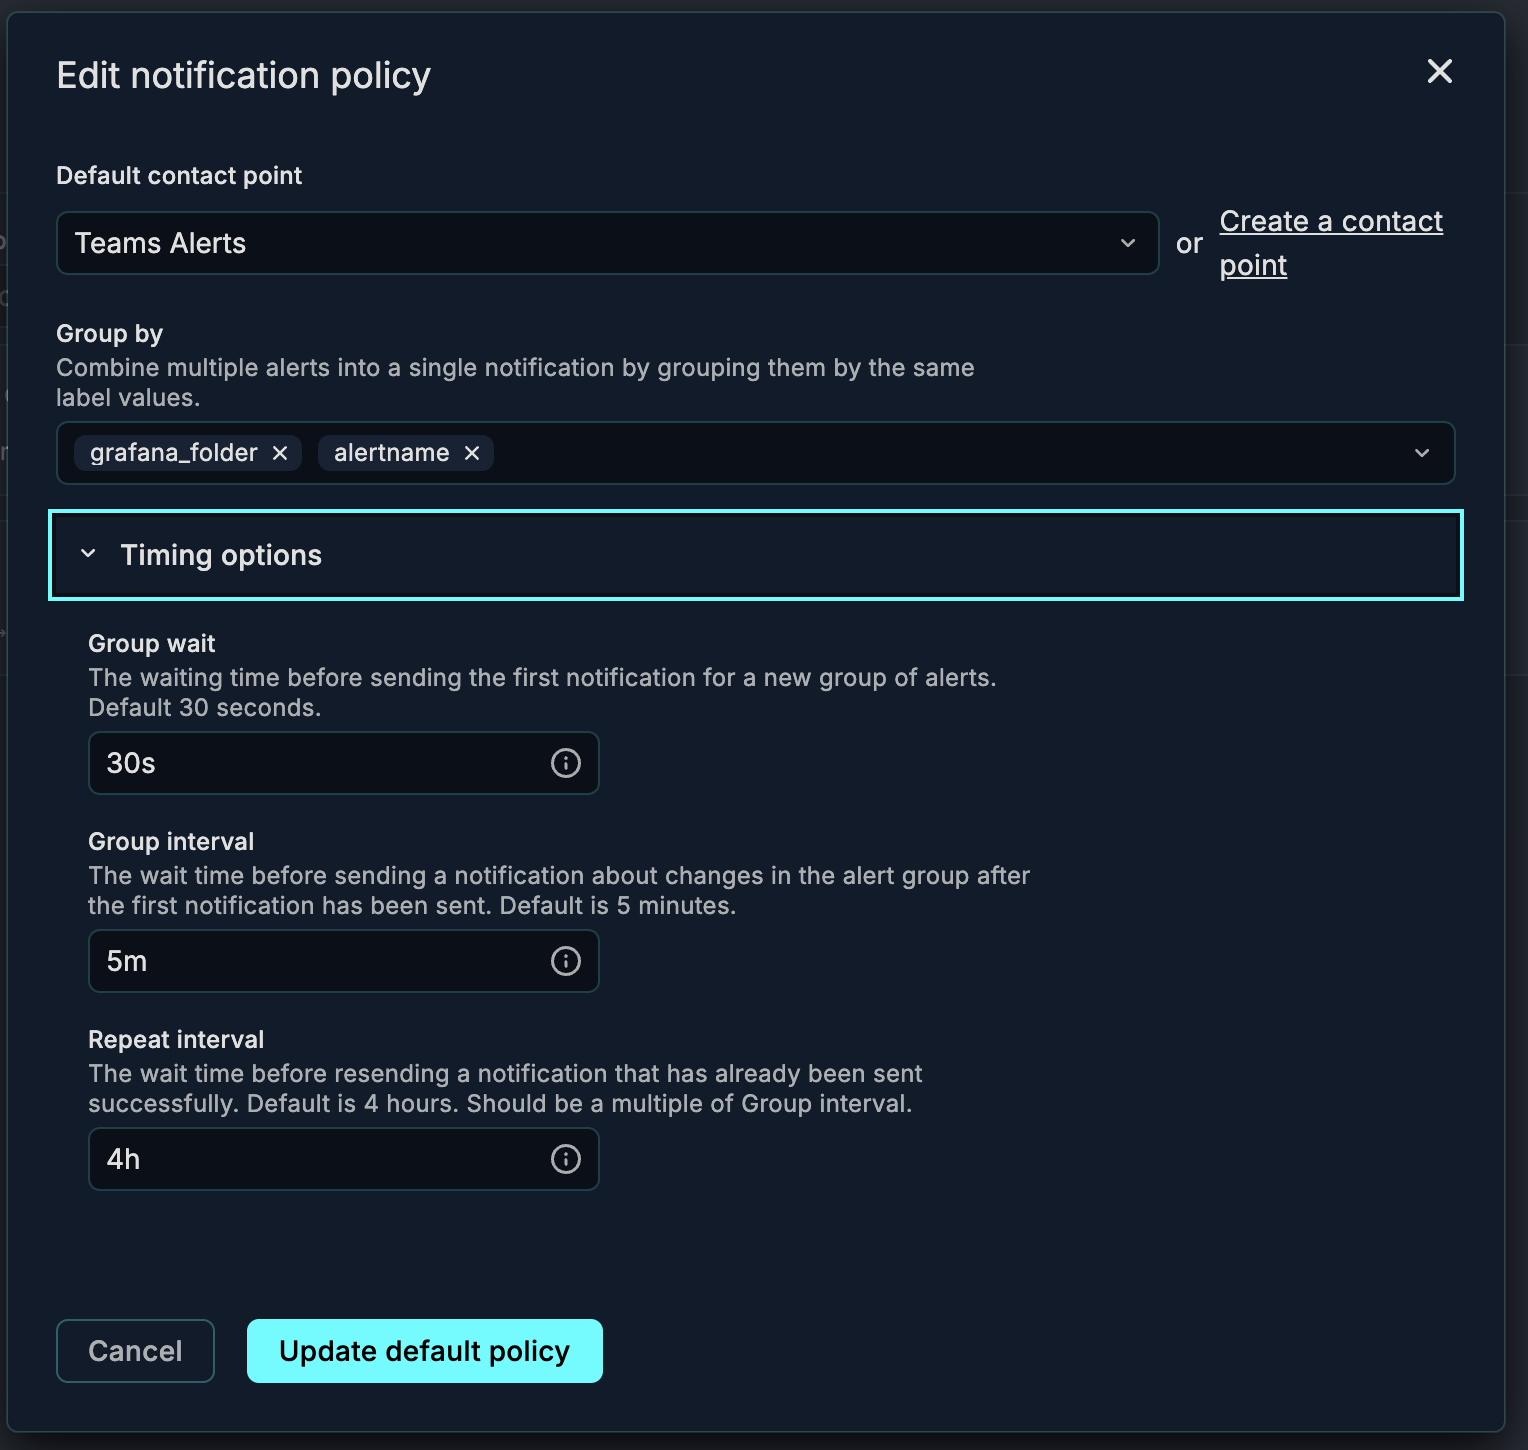
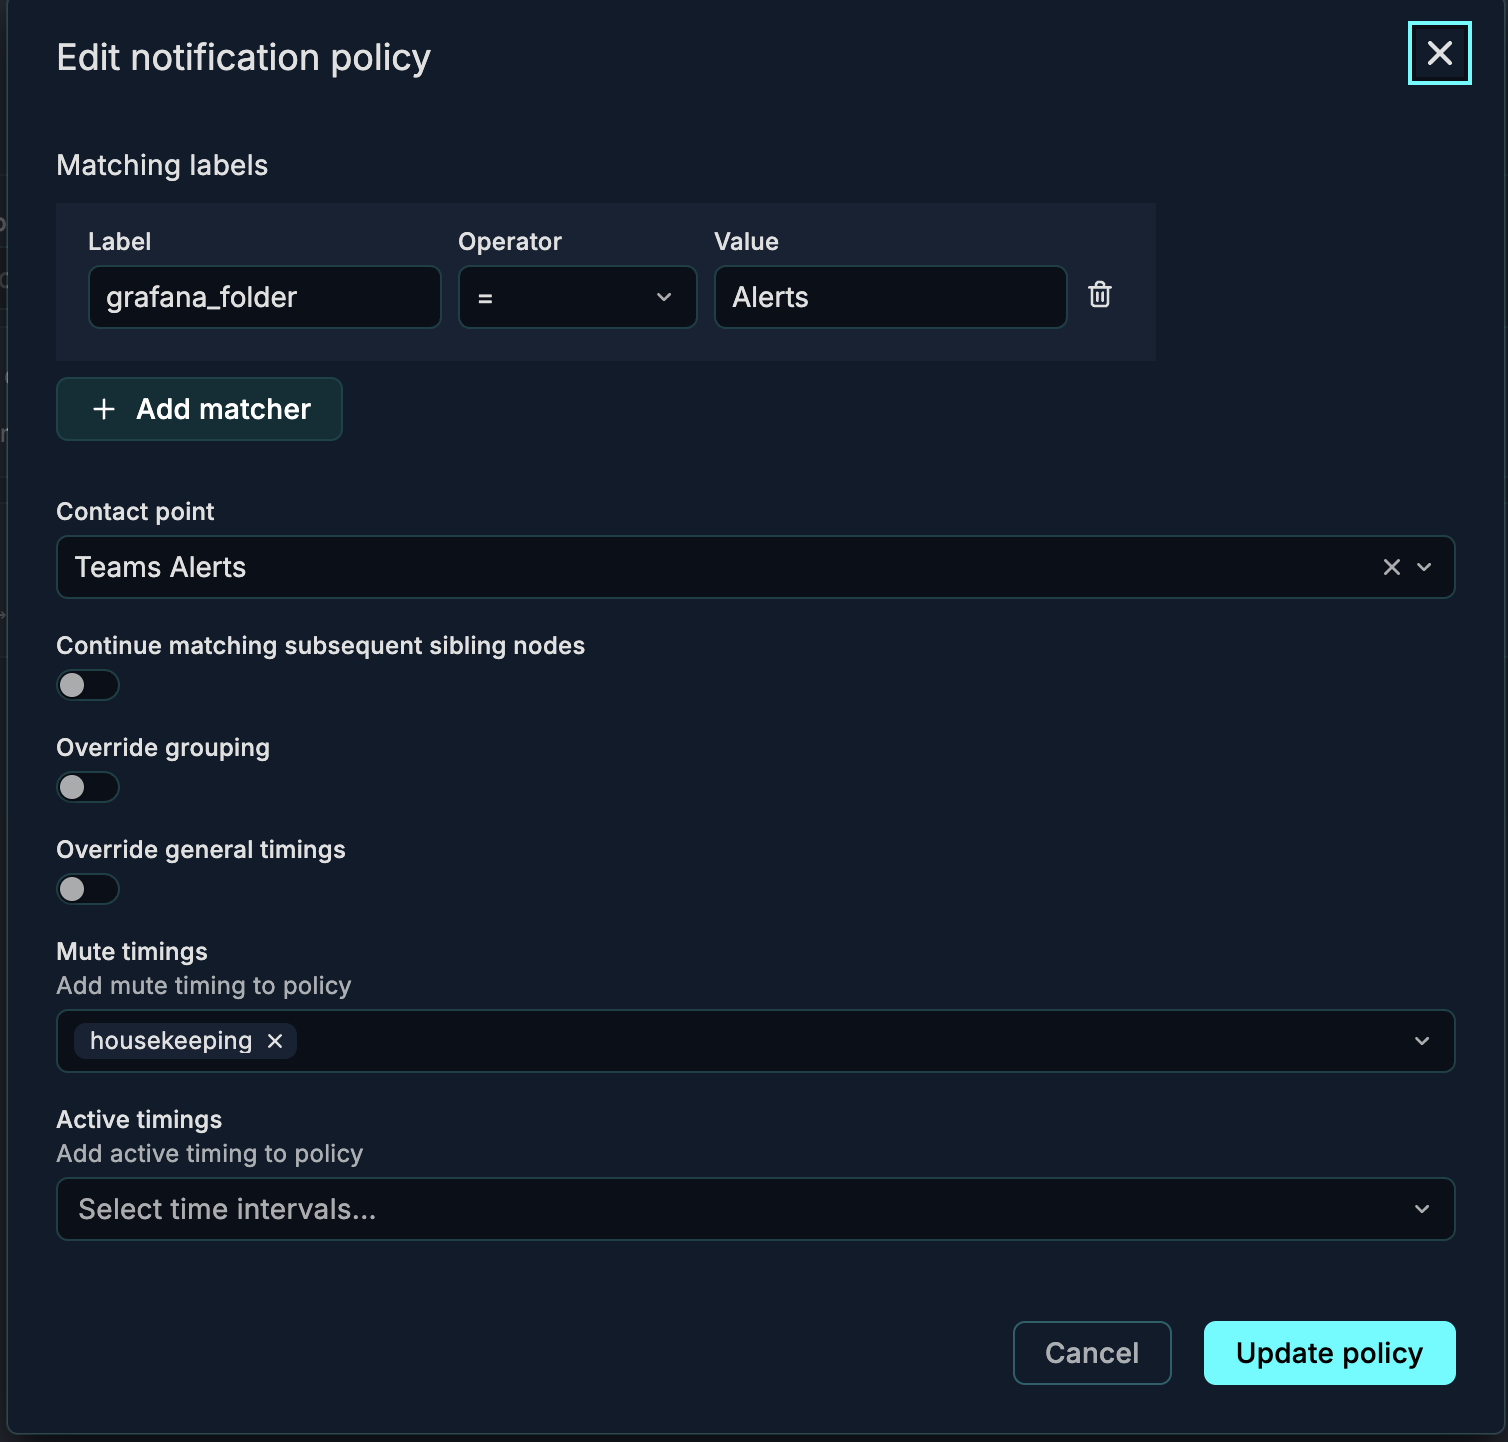
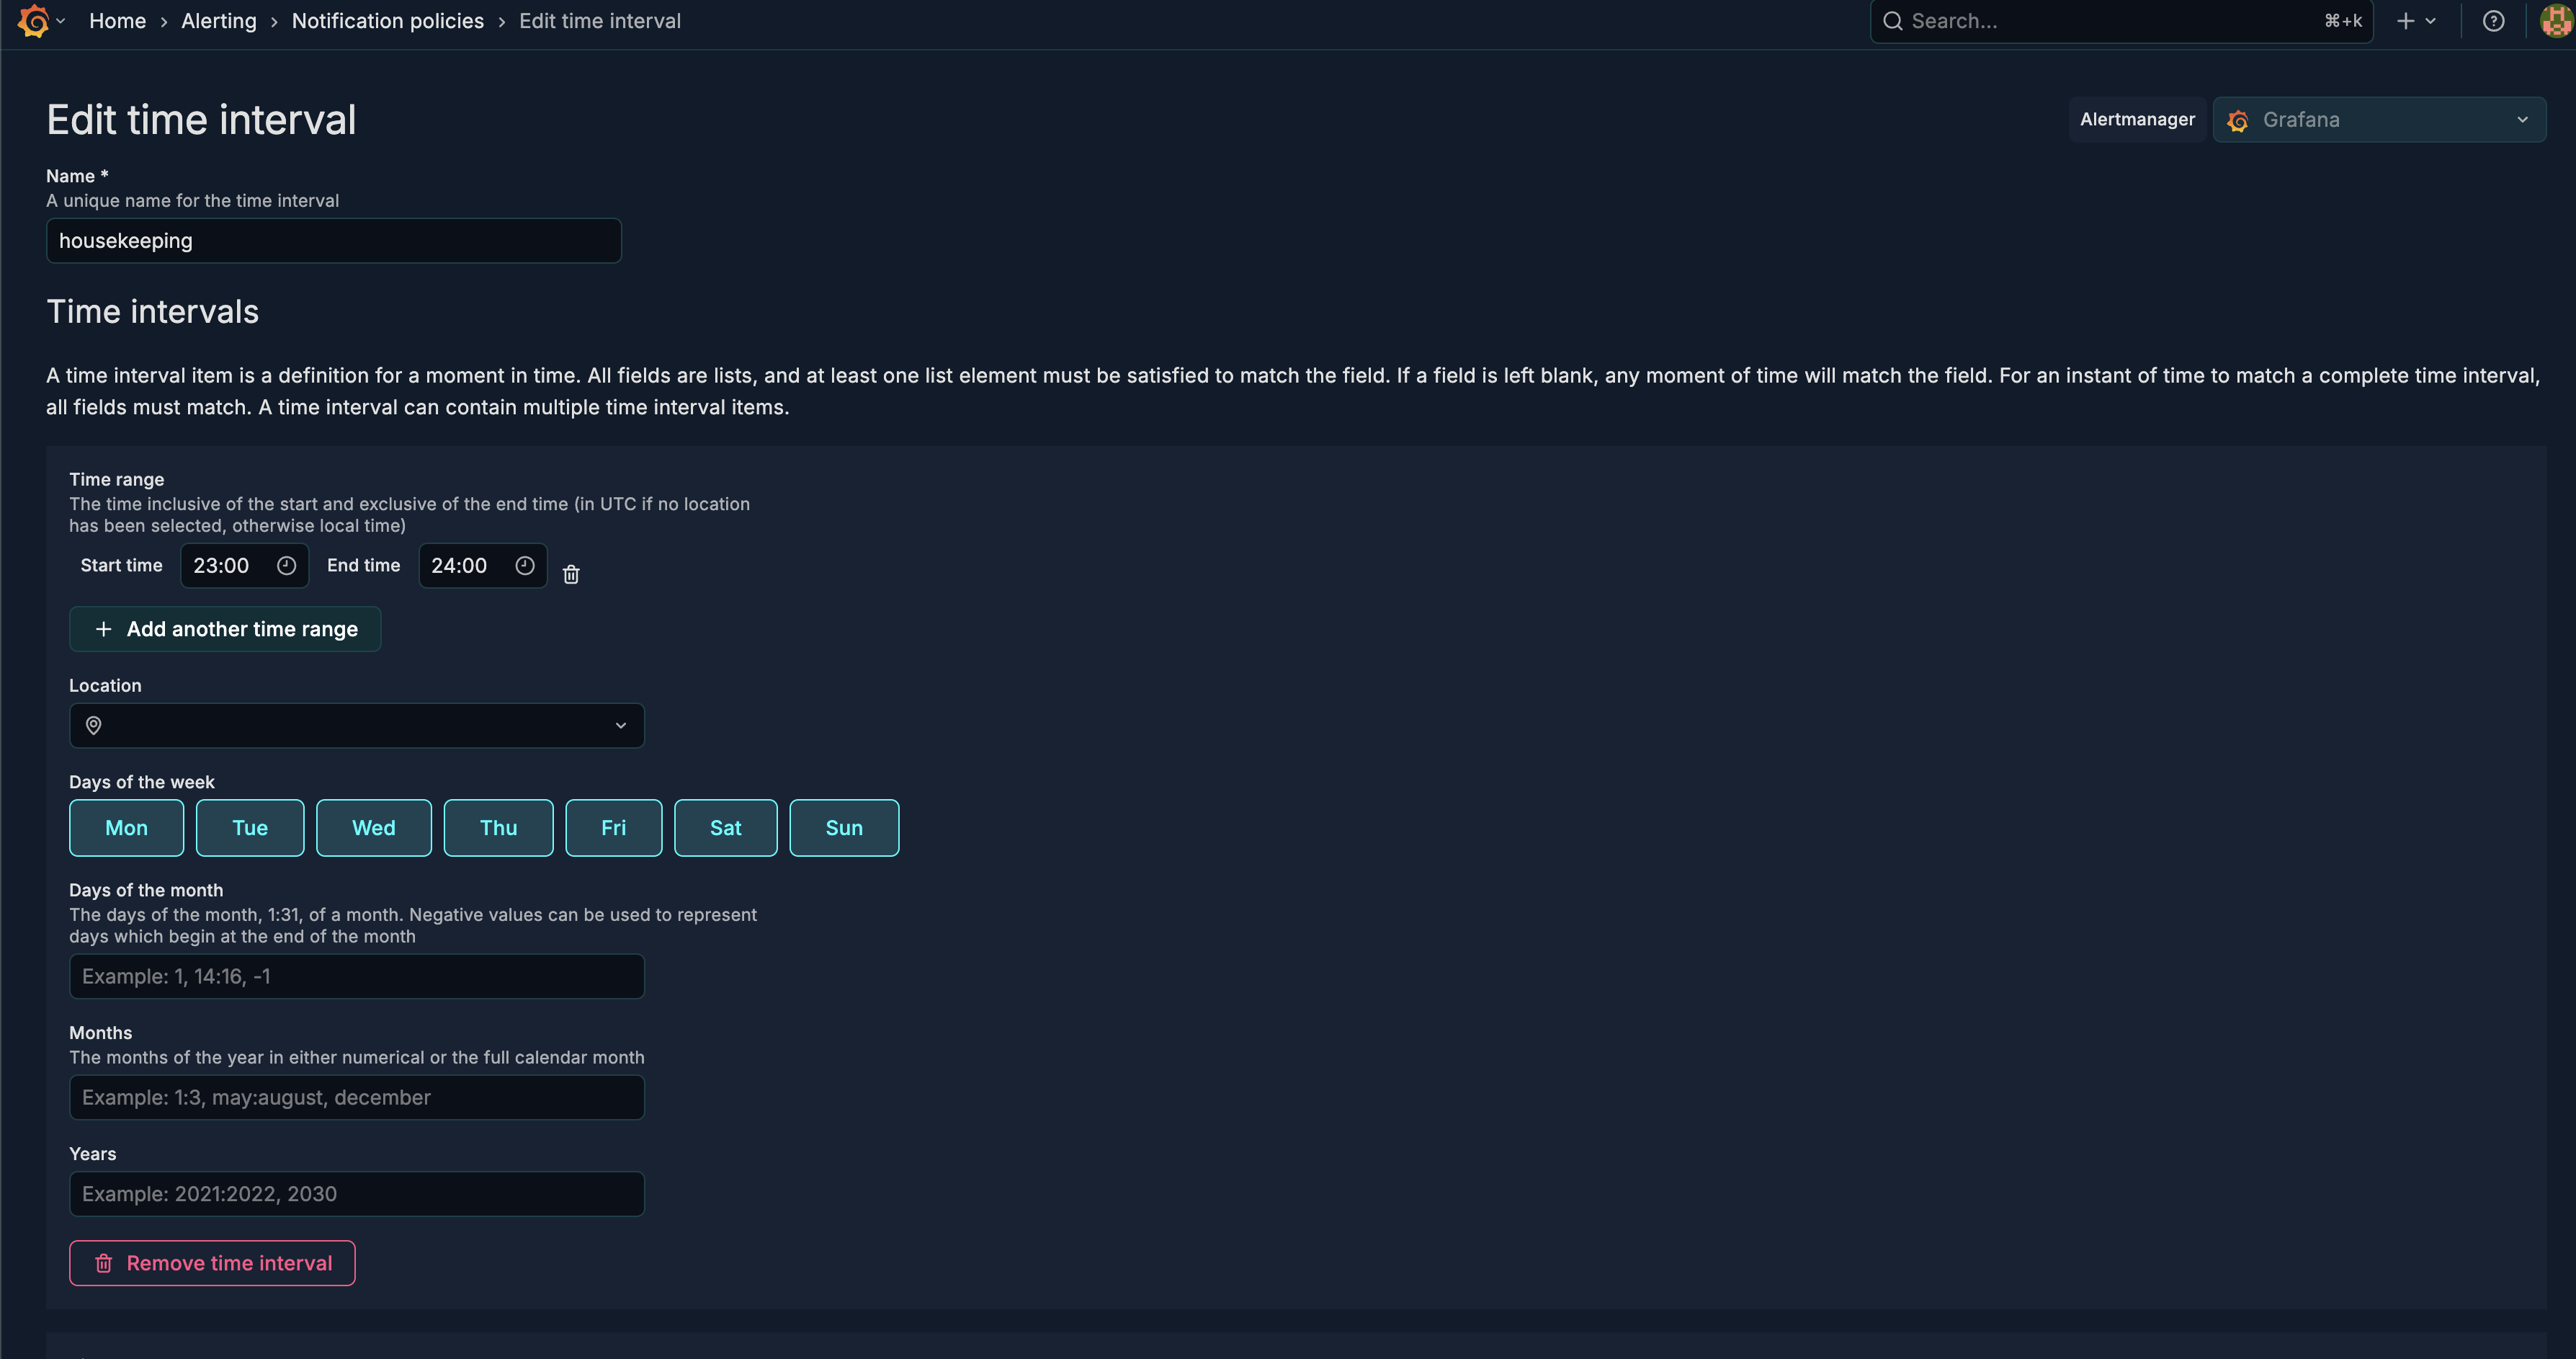
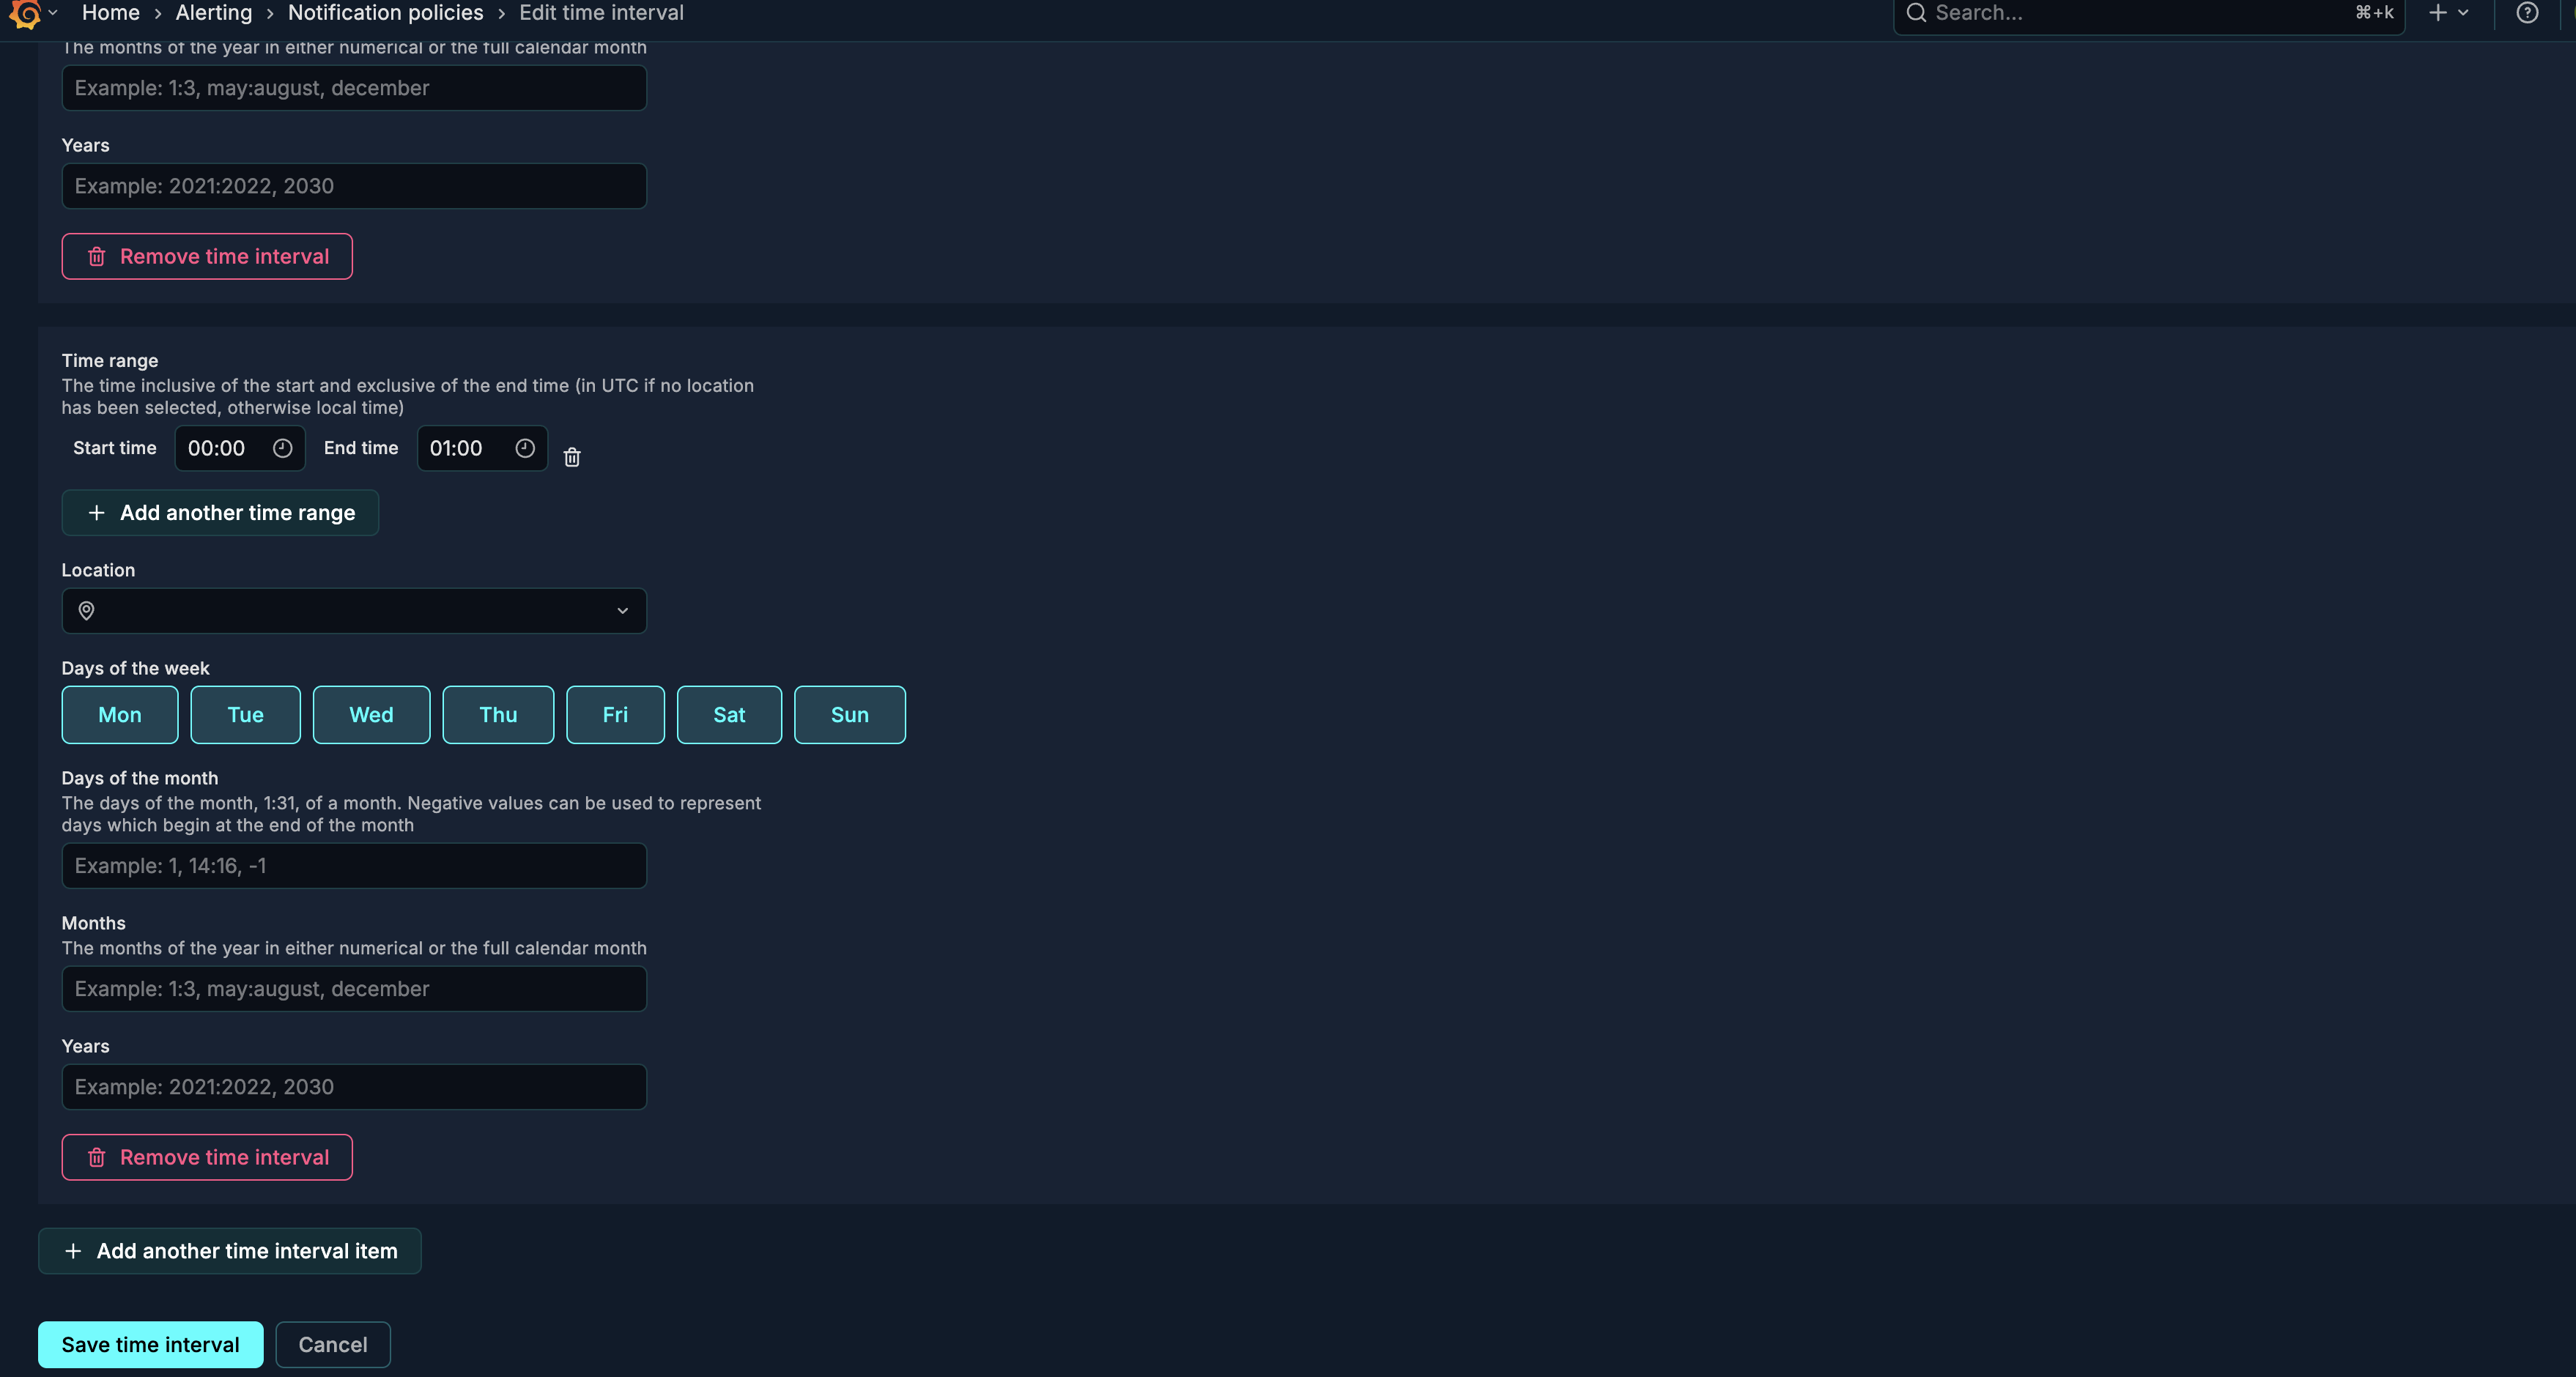
Below, we’ve set up the housekeeping time intervals, which defines time periods in which alerts should be silenced or forced to be sent.