Use case
The end user wants to examine all network traffic statistics by Visibility Point and External Group for a selected time period.
Dashboard
This Traffic Stats dashboard provides a general overview of all network traffic statistics within a given timeframe. The stats are filtered by Visibility Point (VP) & ExtGroup (extgroup_id), which are selectable at the top of the dashboard.
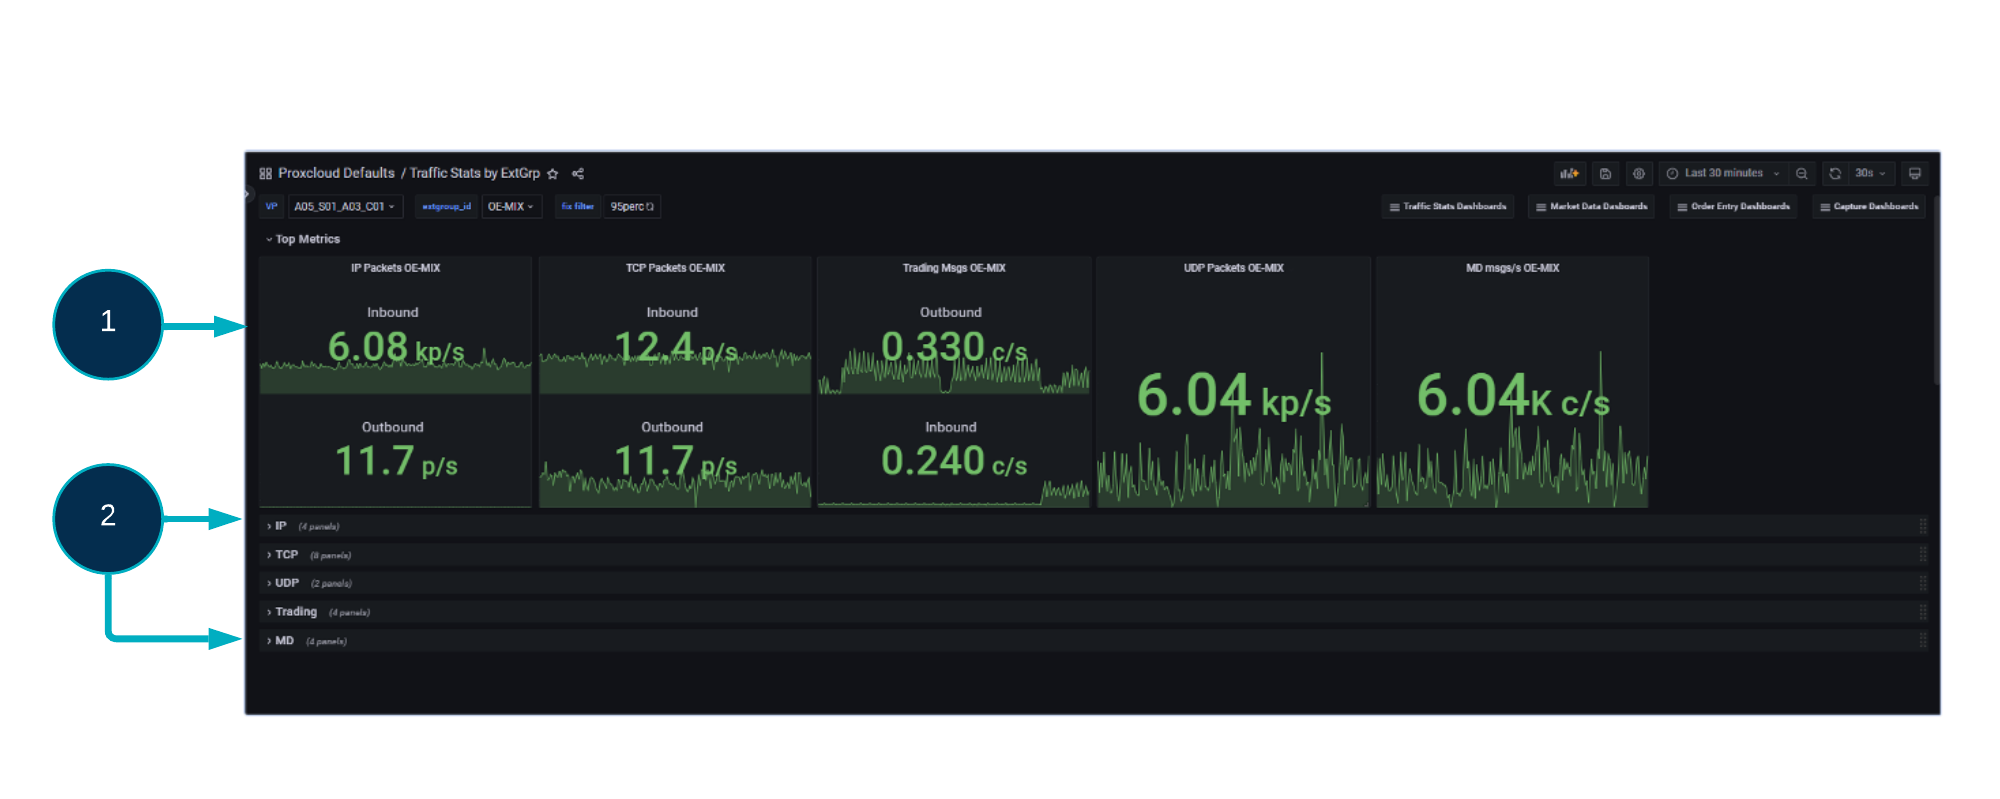
The top row (1) provides summary Packet/Msg rates for each given transmission protocol. From left to right, the panels show:
Overall IP level stats
TCP stats
Individual Trading messages
UDP packet rate
Individual Market Data message rate.
Each of these top levels are then broken out into more detail in the subsequent collapsed/expandable rows (2):
IP Stats
Inbound & Outbound Bandwidth Timeseries
Inbound & Outbound Microburst Timeseries
TCP Stats
Inbound & Outbound Packet Rate Timeseries
Inbound & Outbound Loss Rate Timeseries
Inbound & Outbound Round Trip Time Timeseries
Inbound & Outbound Out Of Sequence Msg’s Timeseries
UDP Stats
Inbound Packet Rate Timeseries
Inbound Bandwidth Timeseries
Trading Stats
Inbound & Outbound Latency Timeseries
Inbound & Outbound Flow Rate Timeseries
MD Stats
Inbound Gaps Timeseries
Inbound Msg Rate Timeseries
Inbound Wiretime Timeseries
Inbound Microburst Timeseries