Use case
This MD Stats dashboard is designed to provide a complete overview of all Inbound Market Data in each VP/ExtGroup so that end users can compare feeds to identify any anomalies.
For example, a specific market data feed showing a high number of Gaps, which can then be further investigated via A-B comparison dashboards or via Packet Query.
Dashboard
This dashboard provides an overview of all MD Feeds in the selected timeframe broken out by Visibility Point (VP), which is a selectable variable at the top of the dashboard.
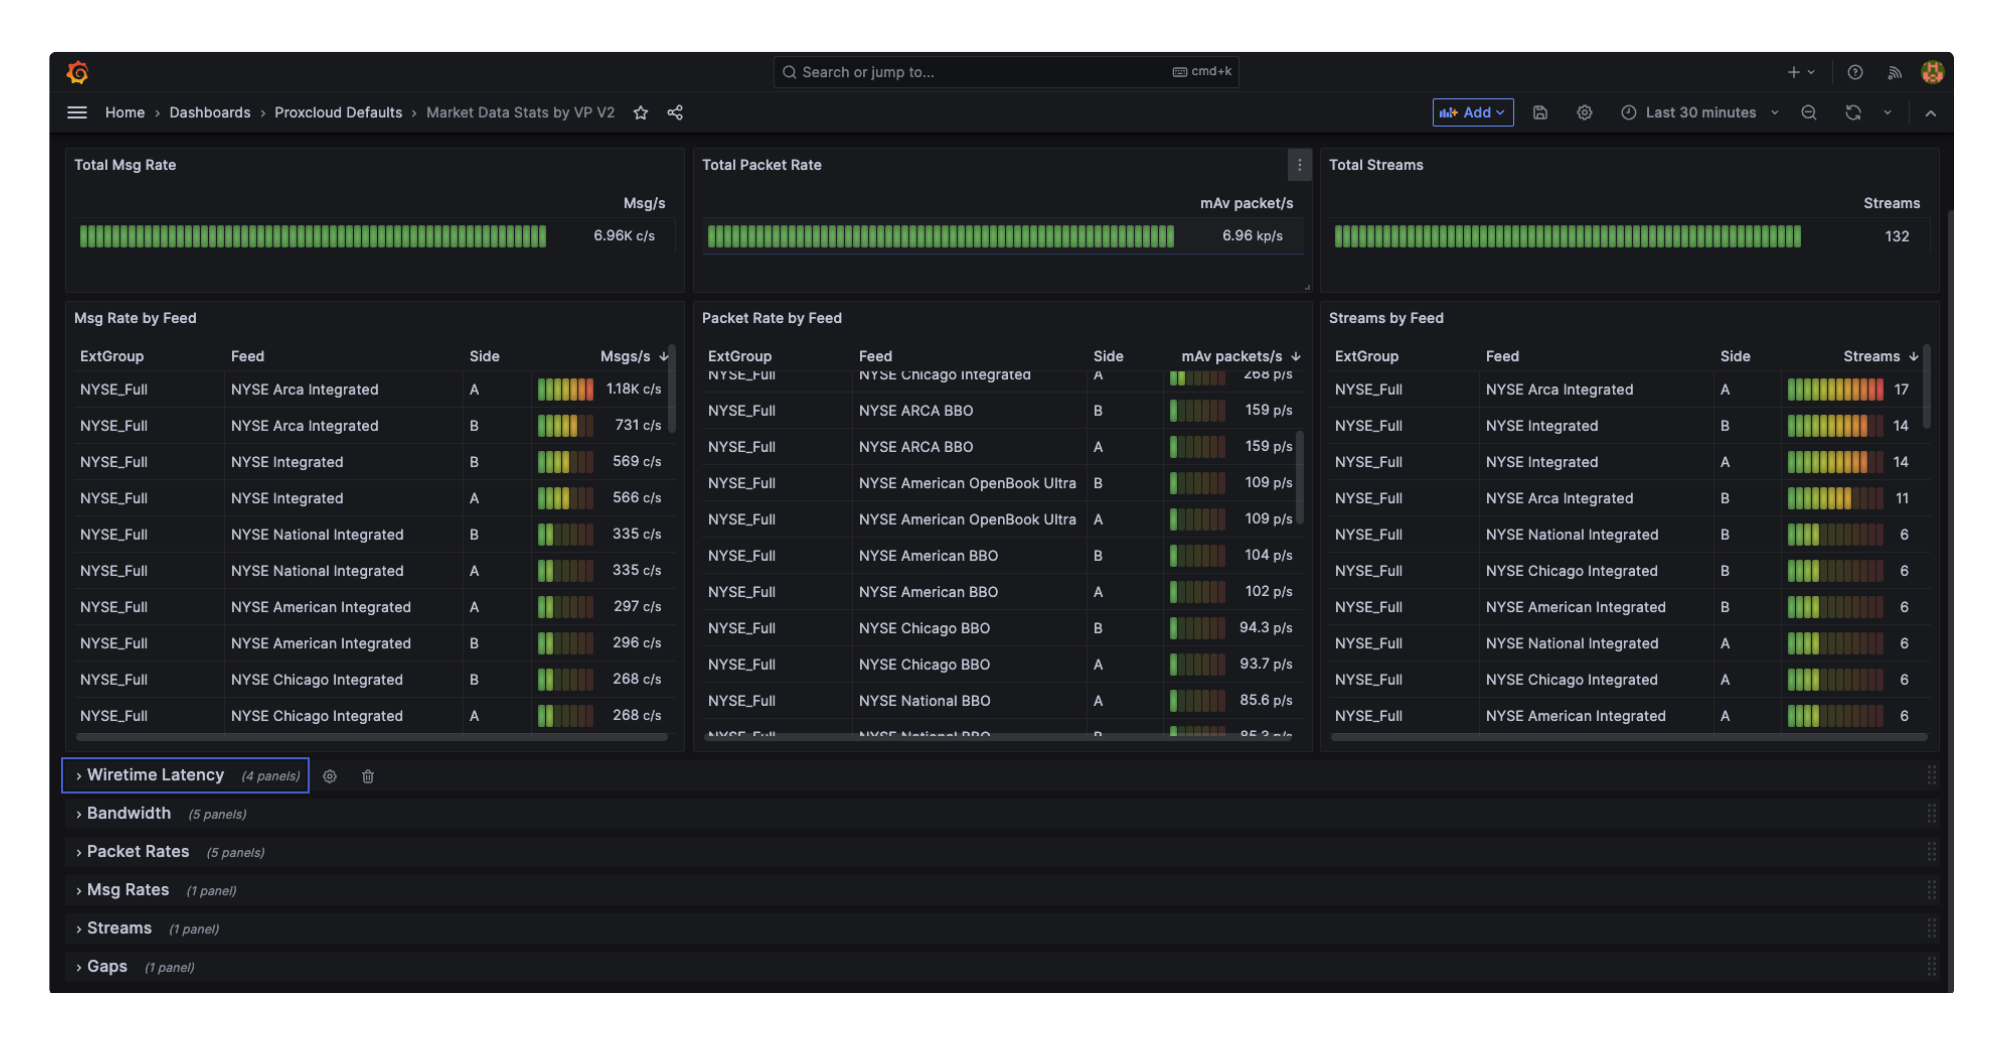
The Summary row provides a Total Msg Rate, Packet Rate, and Number of Streams across all feeds in the given time range.
The table below lists each Feed's individual stats.
The bottom rows detail a breakout timeseries graph for each statistic gathered by the Market Data Aggregator, including Wiretime, Bandwidth (including 1ms, 10ms, 100ms, 1s bandwidth microburst stats), and Msg Rates (including 1ms, 10ms, 100ms, 1s message burst stats), with each Feed stacked on top of the other in each Timeseries.