Use case
The end user wants to check Order Entry statistics for each Visibility Point in order to identify where a high latency occurred.
Dashboard
This Order Entry Stats dashboard provides an overview of all Order Entry traffic/statistic gathered by the Trading Aggregators broken out by Visibility Point (VP), which is a selectable variable at the top of the dashboard. There is also a selectable variable for Gateway/Line, which does not affect the top Summary Row but will be used to determine how many timeseries are presented in each following breakout row.
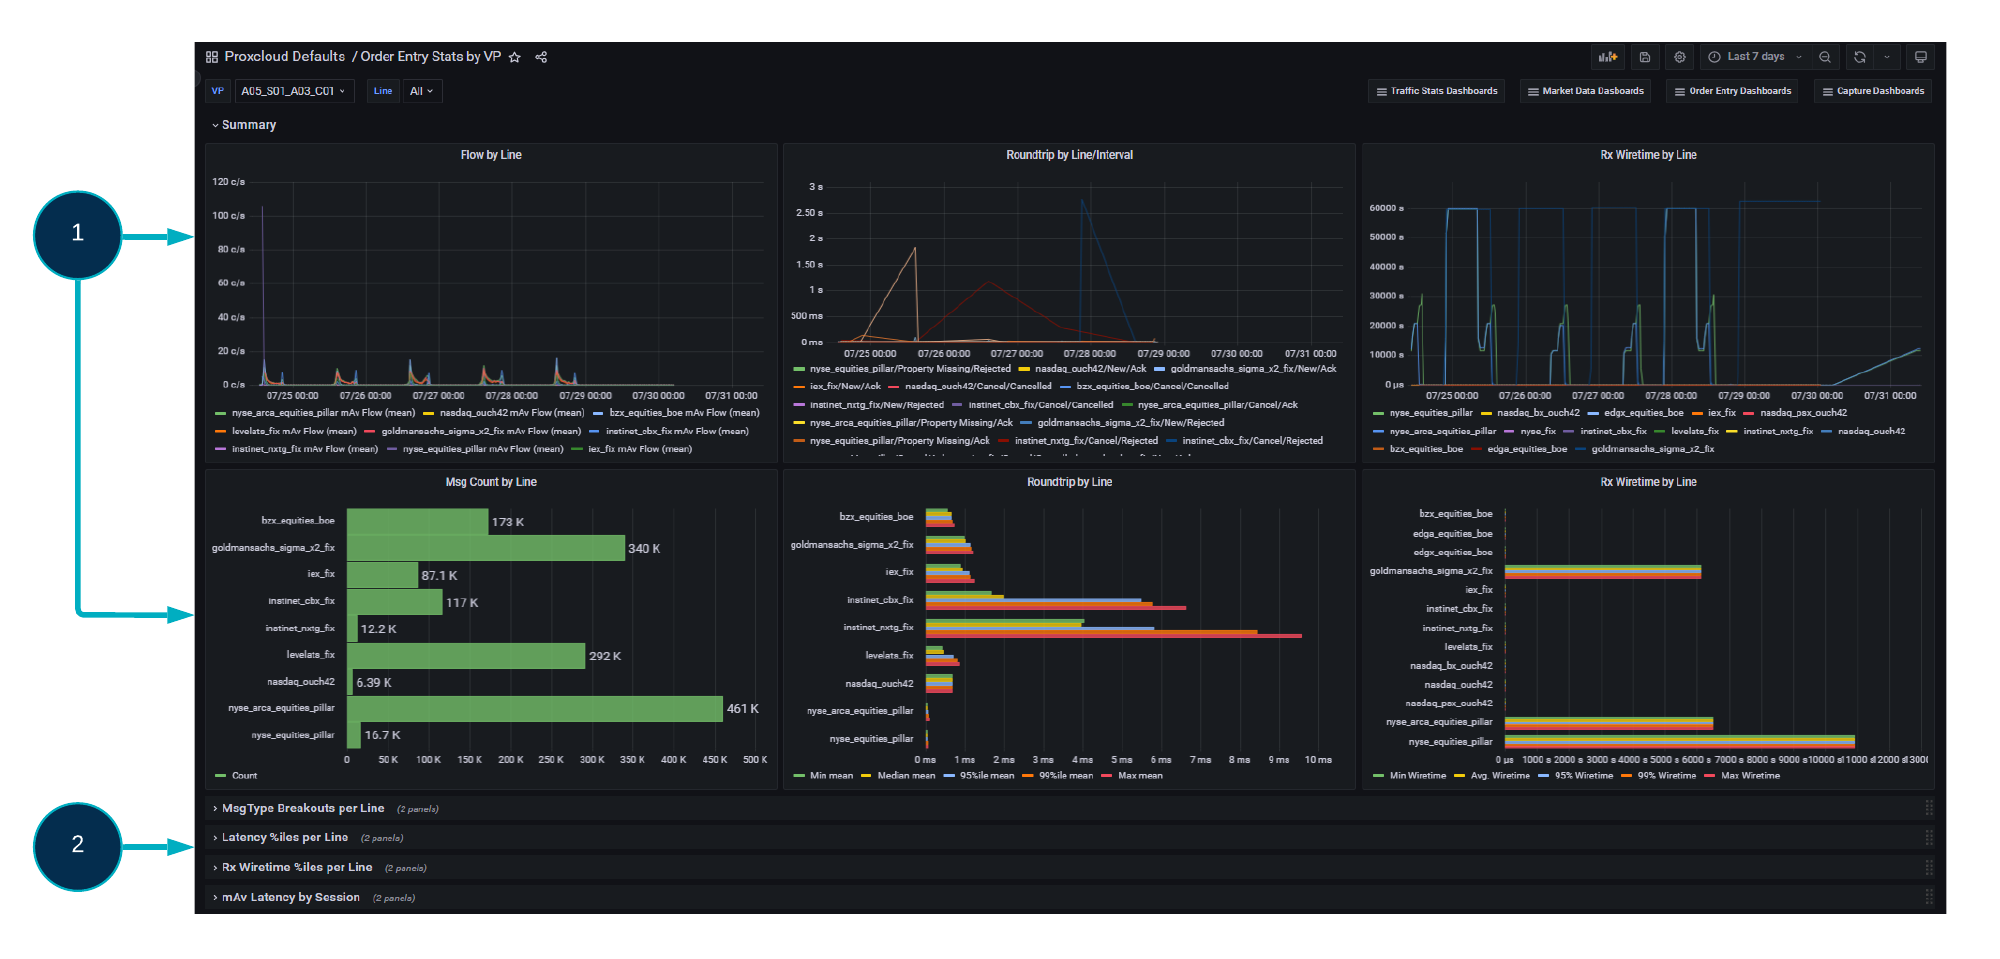
The Summary row (1) provides a Flow Rate Timeseries, Roundtrip Latency Timeseries, and Rx Wiretime Timeseries for each Gateway/Line that resides within the selected Visibility Point (VP). There are also bar charts for the overall Message Rate per Gateway/Line, Roundtrip percentiles, and Rx Wiretime percentiles within the selected timeframe.
Each subsequent Breakout row (2) creates two horizontal panels per Line/Gateway selected:
MsgType Breakouts per Line
Details both the Message Rate and Roundtrip time in separate timeseries' which are categorised by the Order MsgType, for each gateway/line selected.Latency %iles per Line
Details the latency percentiles for each selected line. The first panel displays this as a timeseries, and the second shows each percentile in a bar chart.Rx Wiretime %iles per Line behaves similarly, showing the Inbound (Rx = received) Wiretime percentiles per line in a timeseries graph and a bar chart.
mAv Latency by Session shows details of an individual session per row. The row consists of two timeseries per line: the first displays the roundtrip latency figures for each Session, and the second shows those same latencies, but broken out by request and response type. The latency displayed is a moving average (mAv).