Use case
The end user wants to investigate a time period where high latency was reported by member firms.
Dashboard
Members in this example are identified by assigned vlan ids (in a production environment these are mapped to member names or identifiers). The scatter chart (1) shows the latencies of every transaction in the selected timeframe, keyed by member id, showing exactly which transactions experienced high latency during that time period. Results can be filtered by setting the variable at the top (4) to be a specific member, and you can zoom the chart to shorten the time window to focus more on the time period in question. From here you can locate the specific transaction(s) that experienced high latency, and inspect the panel at the bottom of the screen (5) that contain all the details that Beeks Analytics captured about that specific transaction to support diagnosis of the cause. There is also a link to a dashboard that compares the transactions you are viewing to a reference latency client, select the 101 Comparison button (6) to see this comparison.
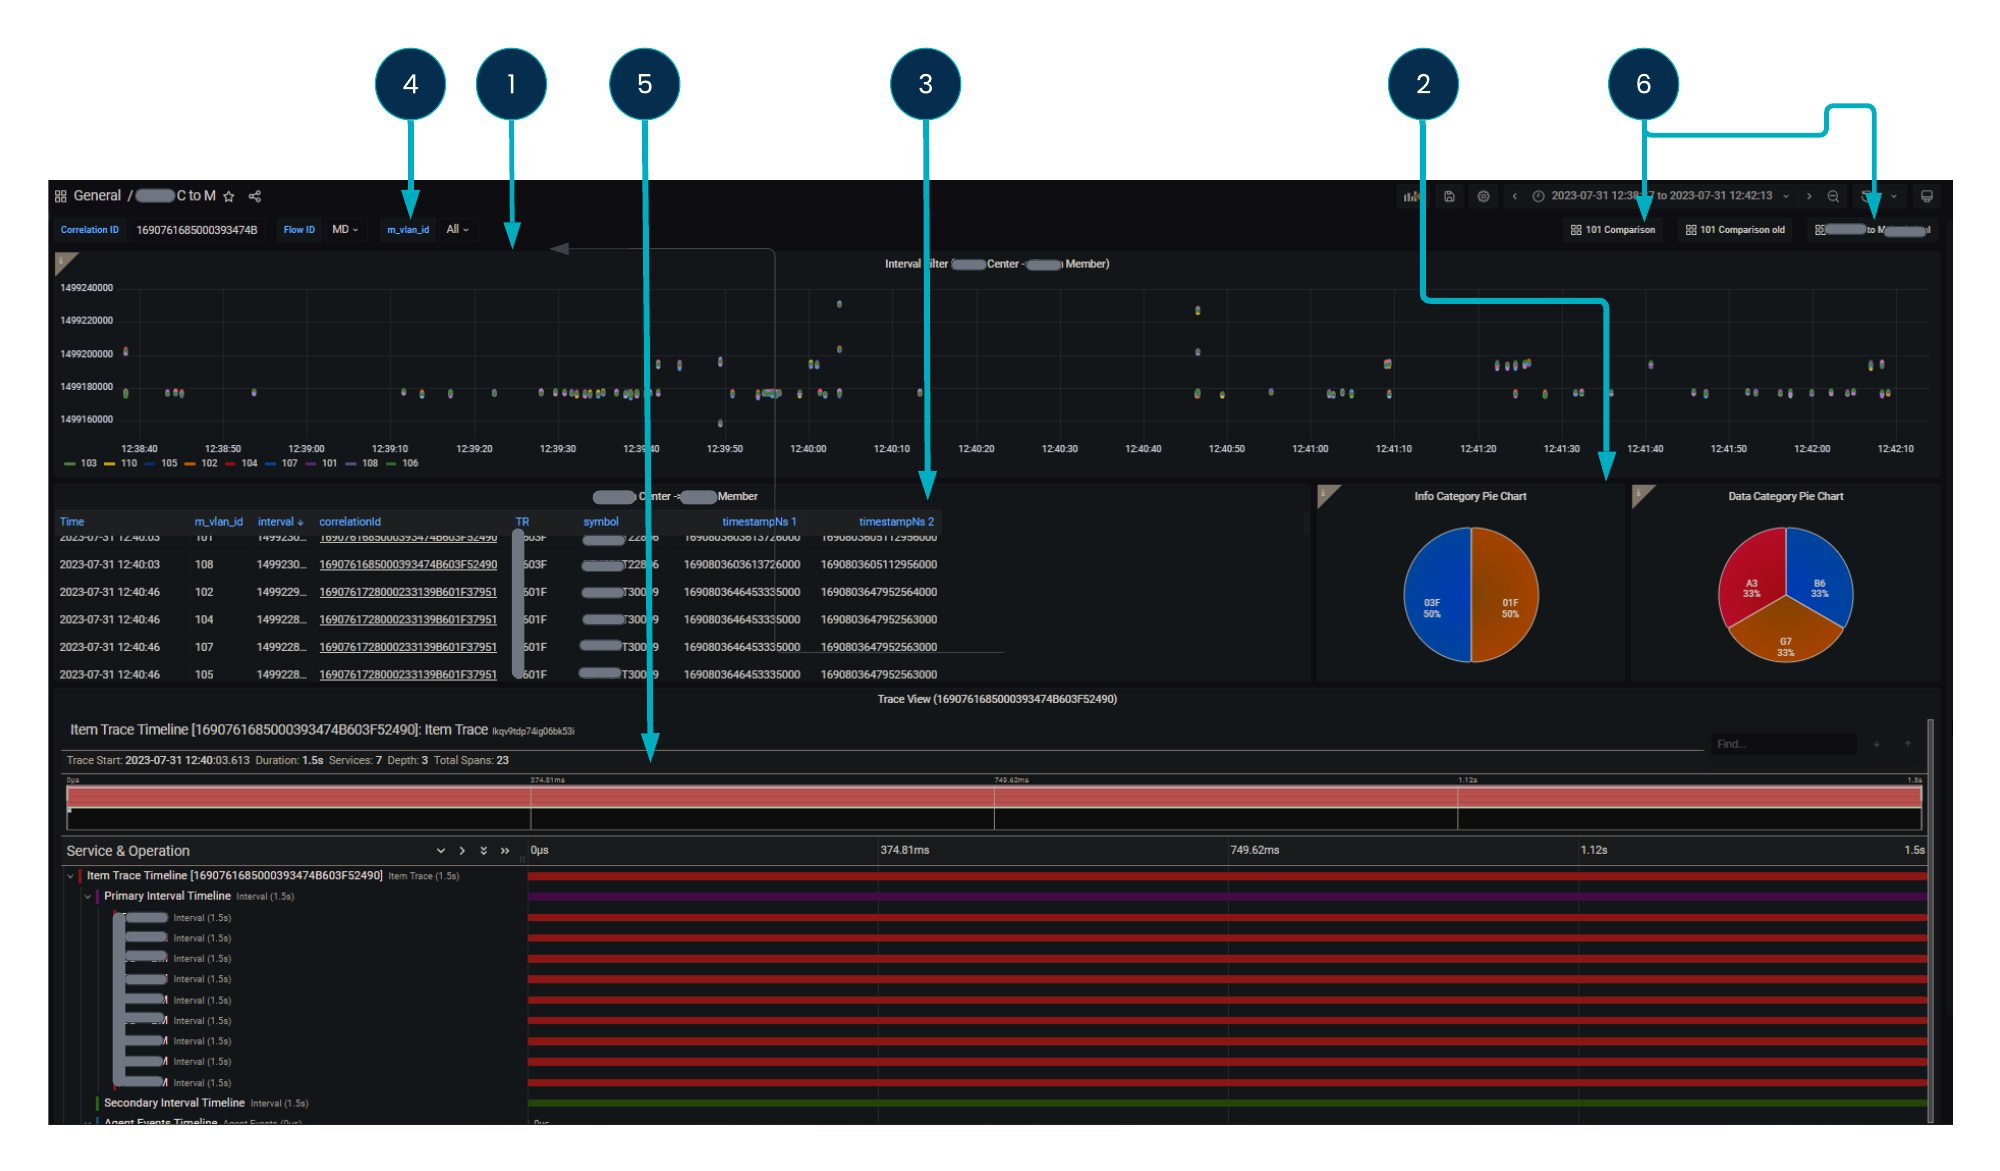
A scatter chart (1) that displays the intervals in the specified time period for a set of members (represented here by vlan tags). All members should have as close a latency to each other as possible.
Pie charts (2) show the distribution of different message types.
The table (3) contains details of each of the transactions that are displayed in the scatter, and can be sorted and filtered with the column headings. Select the correlationID (underlined) to populate the gantt view at the bottom (5) with all the hops associated with this particular transaction.
Select buttons (6) labelled 101 Comparison, C to M Statistical to use the variables and time window to populate the reference comparison dashboard. Other dashboards can be linked in the same way, enabling you to present data in different ways and filter them by whatever variables are revealed as important by the initial search.
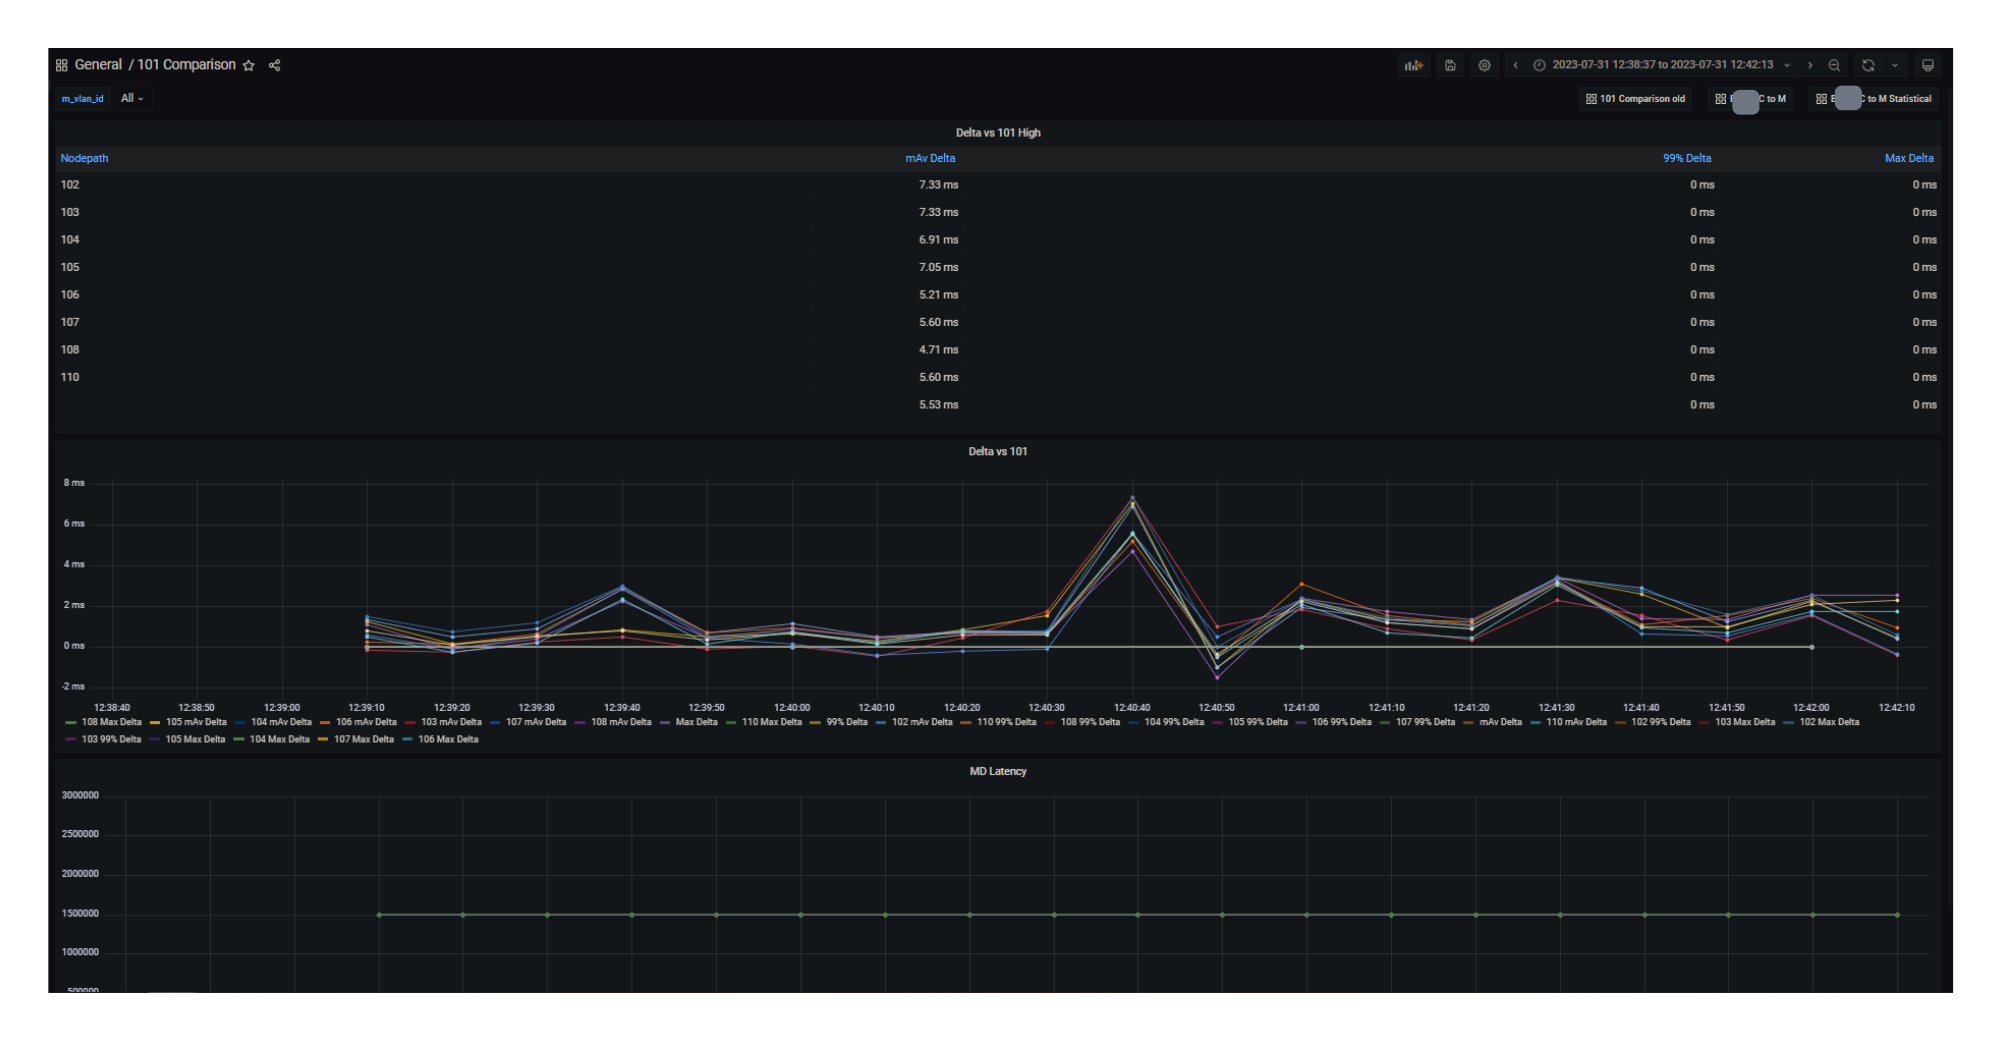
In the example below that shows the 101 Comparison dashboard, the VLAN ID isn’t set so it defaults to ALL, giving you a view of the latency for all VLANs in the time period compared to the baseline.