The Time Series endpoint allows you to query time series data when Time Series recording is enabled on aggregator cells. See Using dashboard variables in queries for information about using variables when querying time series.
The following steps assume that you have previously created a panel and added the Beeks Analytics data source.
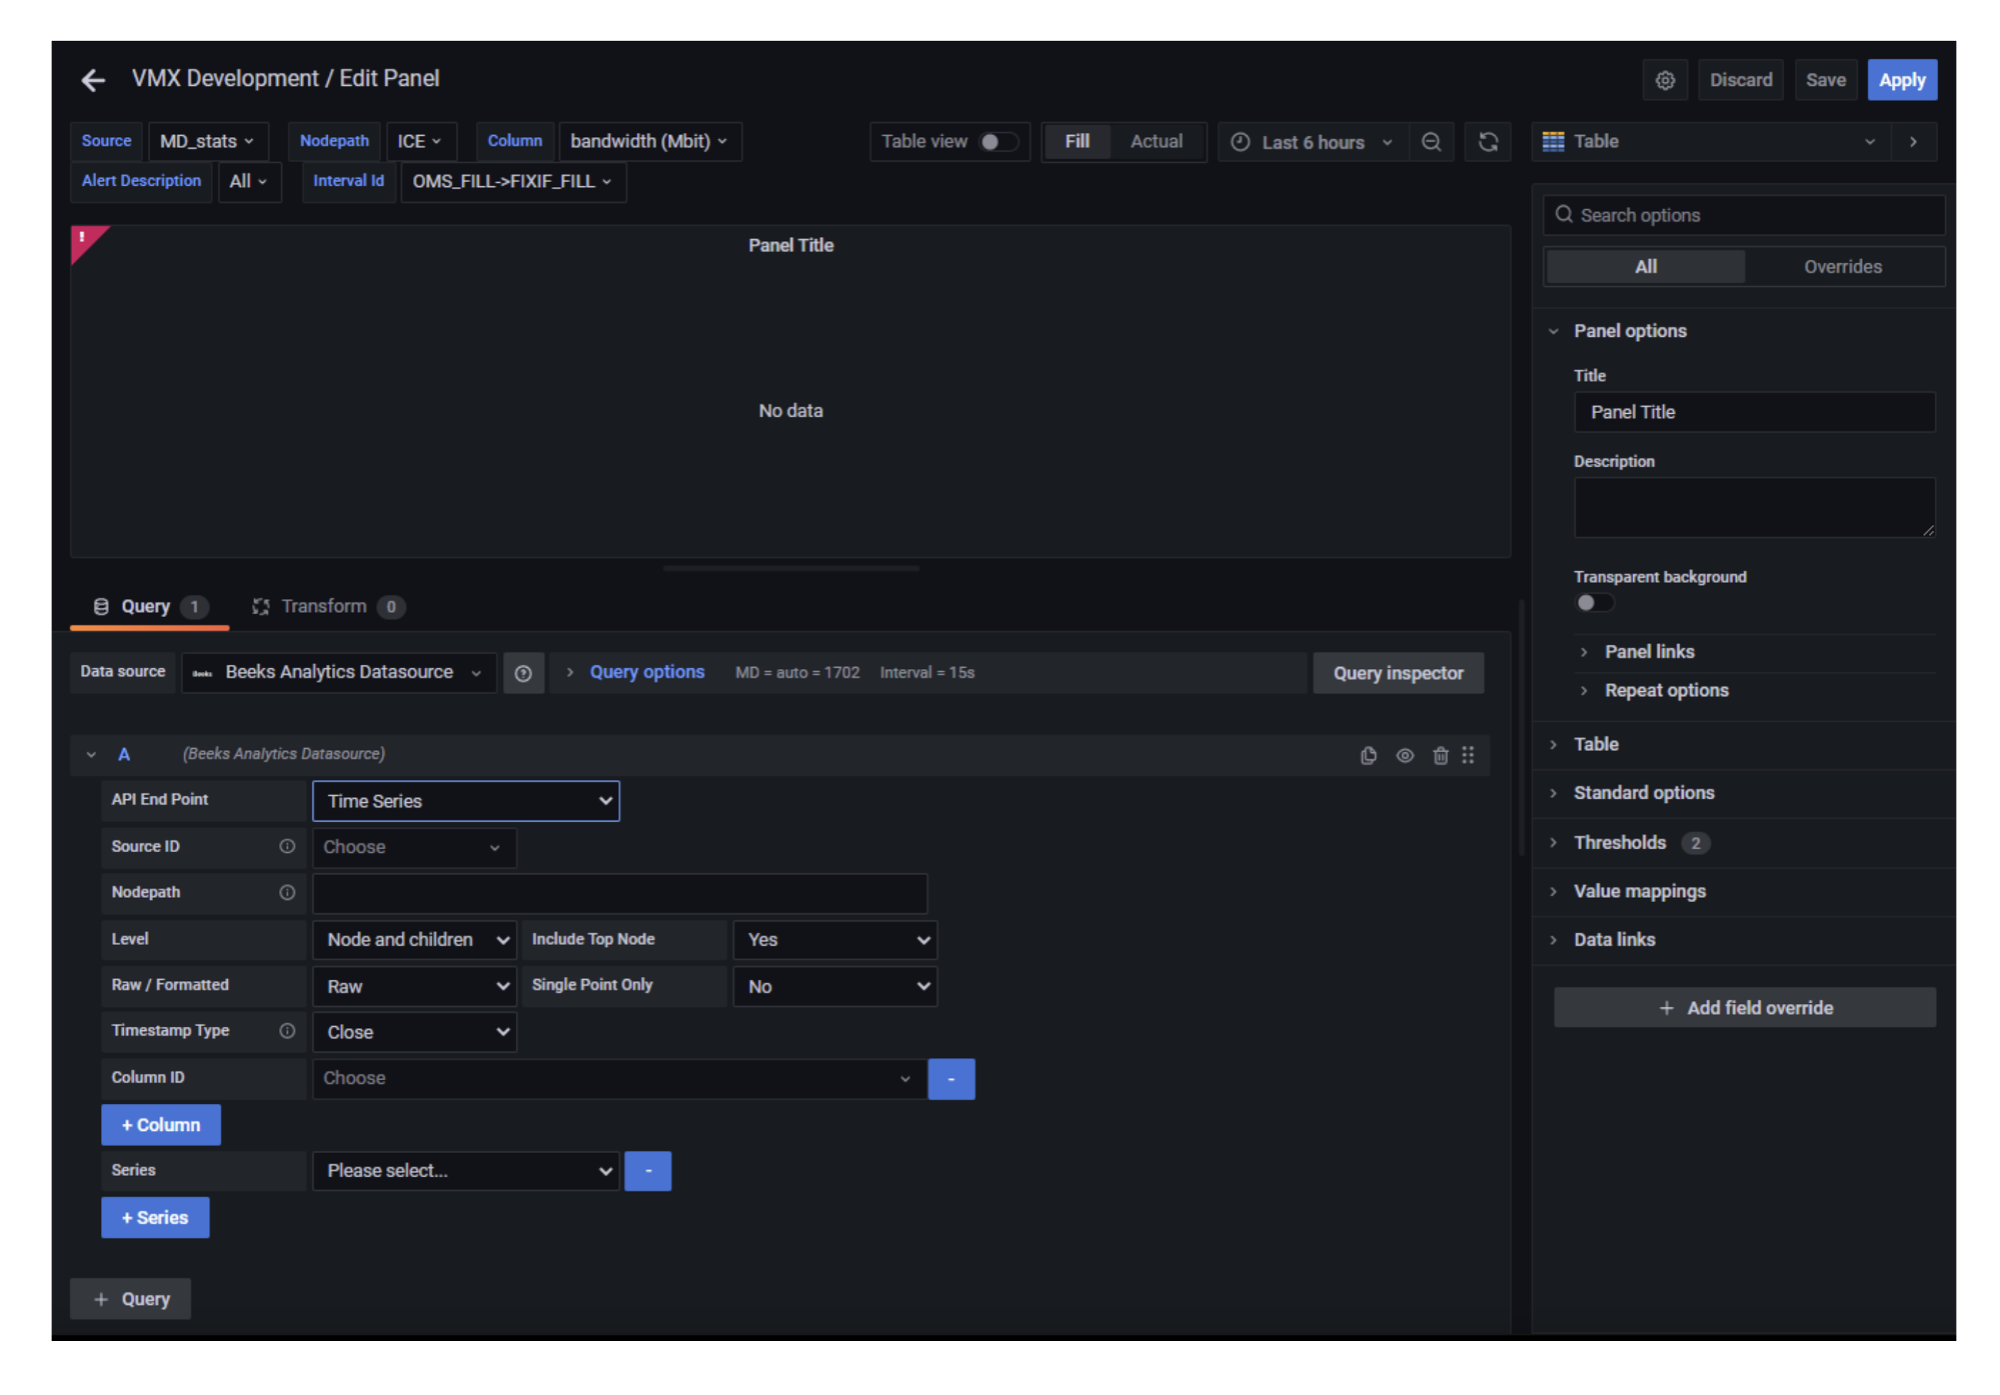
Complete the following fields:
API End Points: Select Time Series.
Stream Results: See Configuring query results section.
Source ID: Select the identifier of the source.
Enable Nodepath Matching: If checked, will use supplied nodepath to retrieve aggregator regions.
Nodepath: [Optional] Enter the path to the node.
Level: [Optional] Select the number of child levels to return below the configured node path.
Include Top Node: [Optional] Select Yes to include the Nodepath in the results. Select No to include only children in the results.
Enable Regex Matching: If checked, will use supplied regex to retrieve aggregator regions.
Note: If you enable both nodepath and regex matching, both sets of conditions must be satisfied for any data to be returned, i.e., a boolean AND.Match Expression: [Optional] Match nodepath with a regular expression
Match Raw Expr: [Optional] Match using raw (standard) regular expression. Default is VMX specific regex, which uses / as a nodepath separator.
Match Shorter Paths: [VMX Regex only] Match shorter paths
Match Longer Paths: [VMX Regex only] Match longer paths
Raw / Formatted: [Optional] Either formats the data for readability, or returns the unformatted (raw) data.
Timestamp Type: [Optional] Select Open, Mid, or Close to return an open, mid, or close timestamp with each tick.
Single Point Only: [Optional] Select Yes to compress the time-series to a single point with open from the first tick and close from the last. All other values will be appropriately compounded.
Explode Nodepath: Split nodepath into multiple columns, 1 per level
Sort By Column: Choose column to sort single point data by
Sort By Field: Choose field to sort single point data by
Sort Direction: Sort direction for single point data
Sort Series: Sort returned series by name. Default is to order as returned by the REST API.
Include Labels: Include additional aggregator metadata on series name.
Series Name: Template used to build series name. Available values are $nodepath, $column, $field and $units.
Column Id: Select the columns to include. You must specify at least one column.
+Column: Add further columns.
Series: A list of series to return. You must specify at least one series.
+Series: Add further series'.
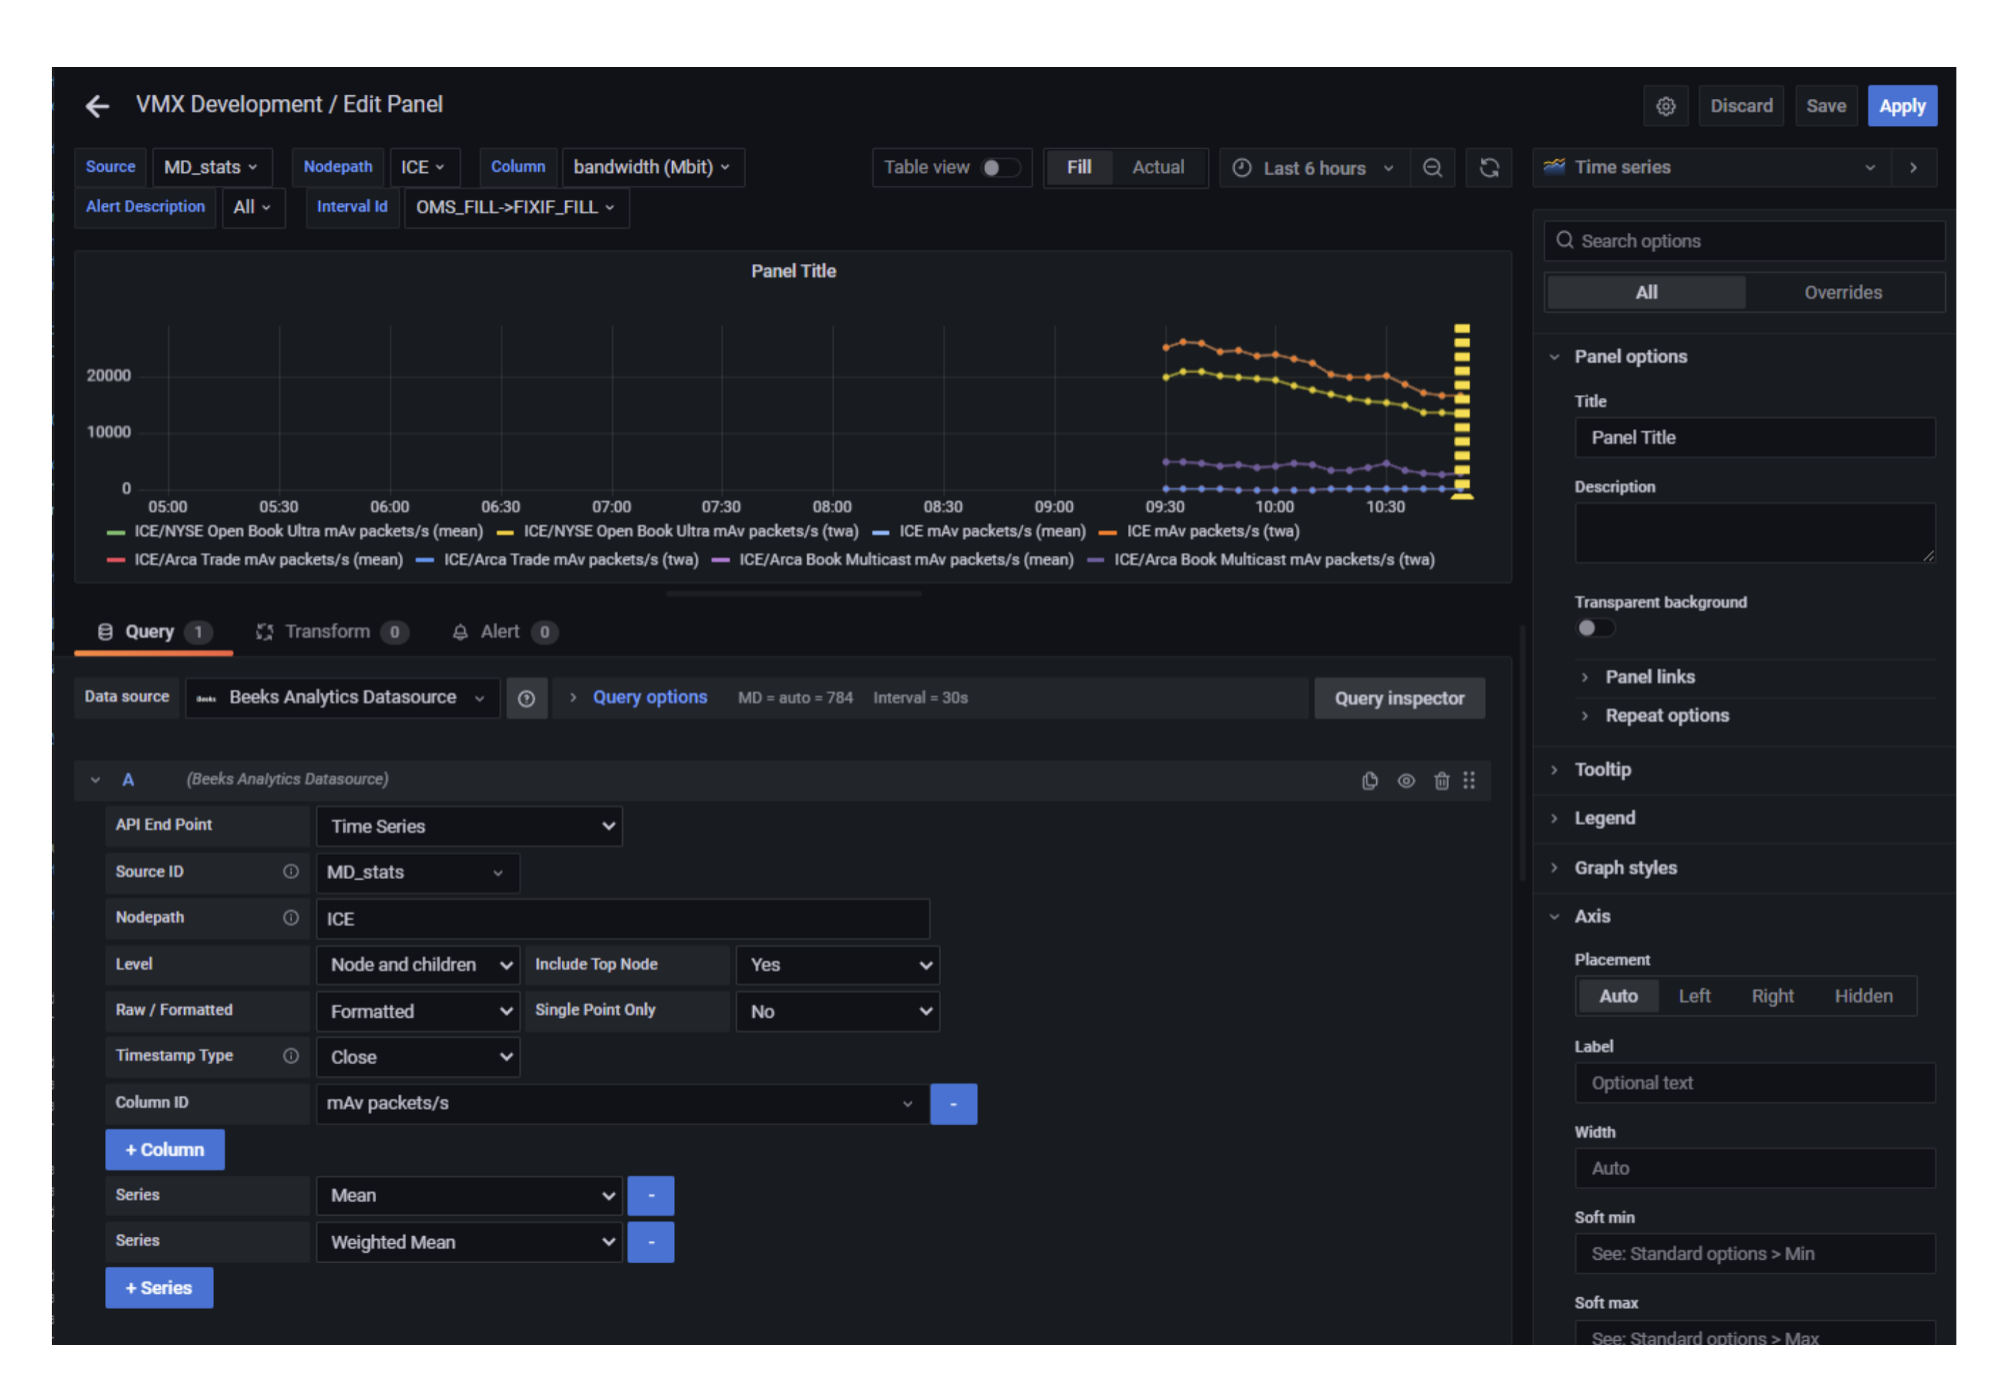
The panel will update with a visualisation of the requested data. For example, the dashboard below shows a query on the ICE nodepath of the MD Stats aggregator. It is constrained to the ICE node and its 3 children, and is querying 2 time series from a single column, resulting in 8 series on the chart (1 parent node plus 3 children x 2 series).