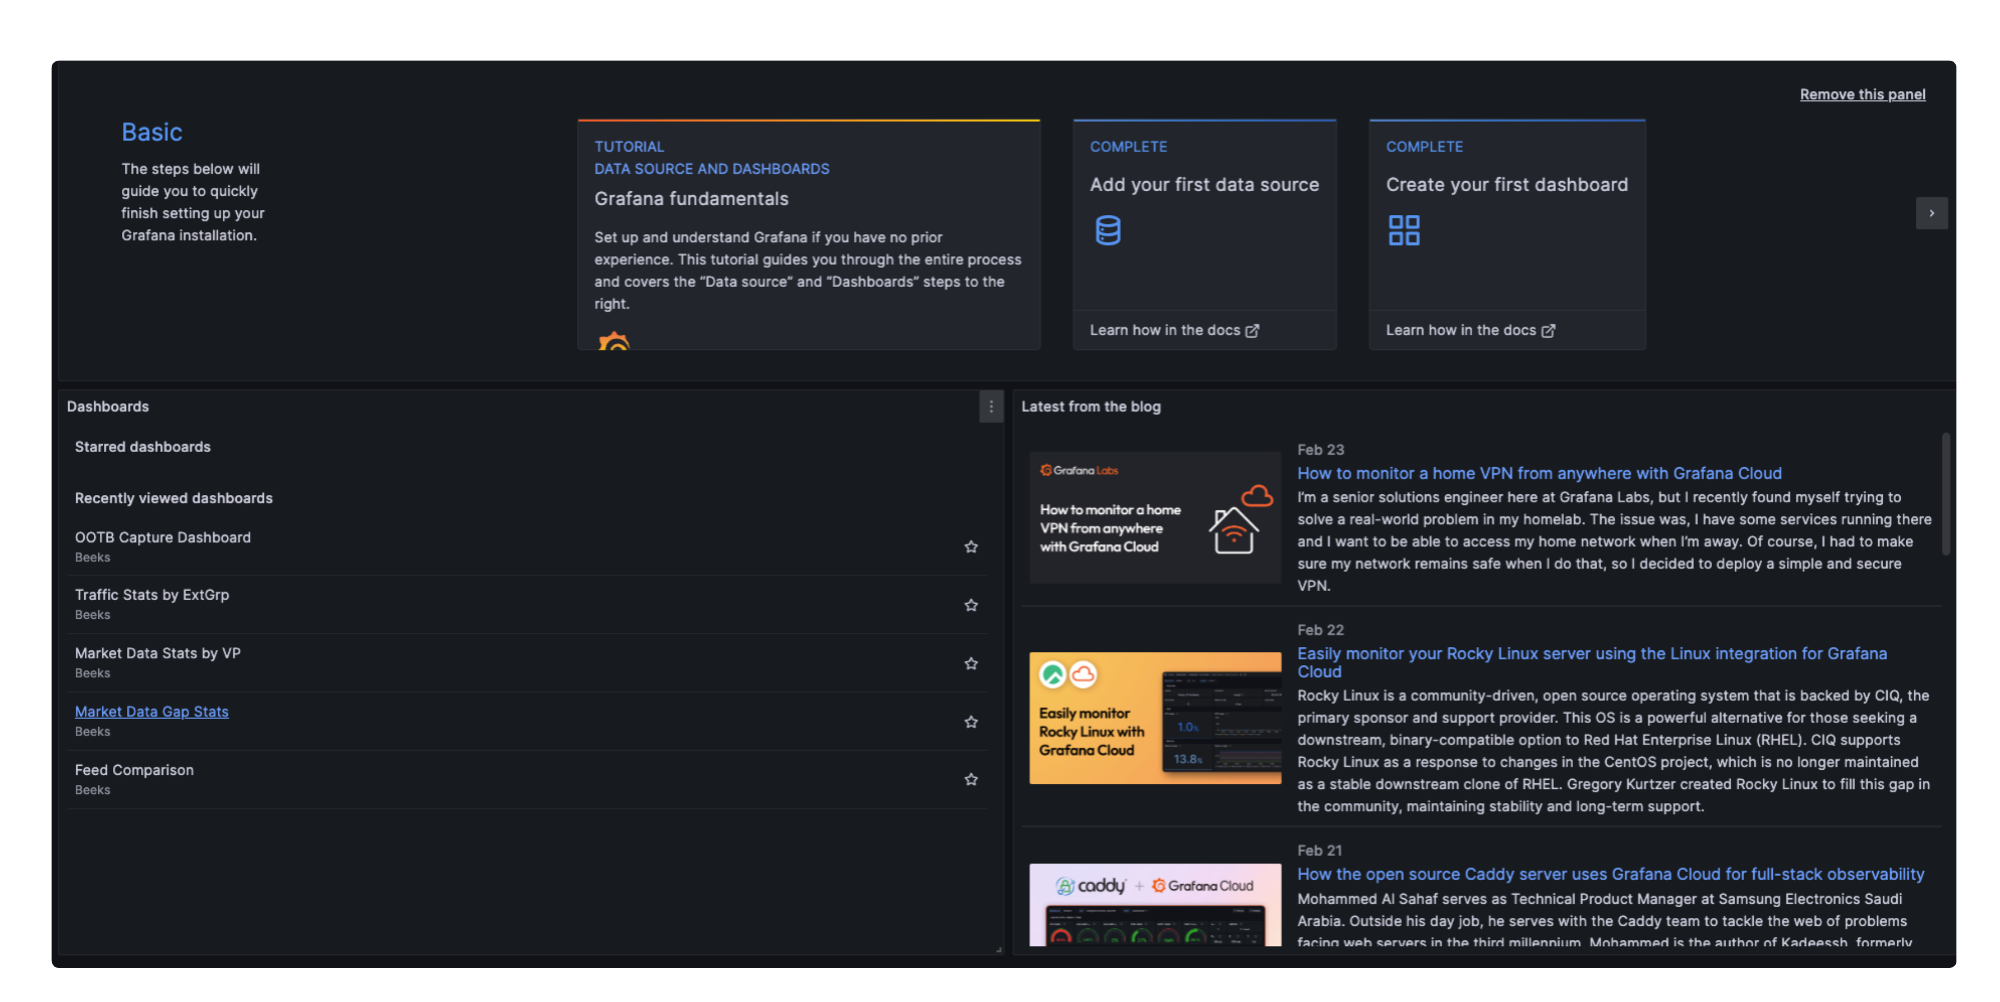
VMX-Explorer opens in your browser and displays the Home Dashboard if configured, otherwise it will display the default Grafana welcome page.
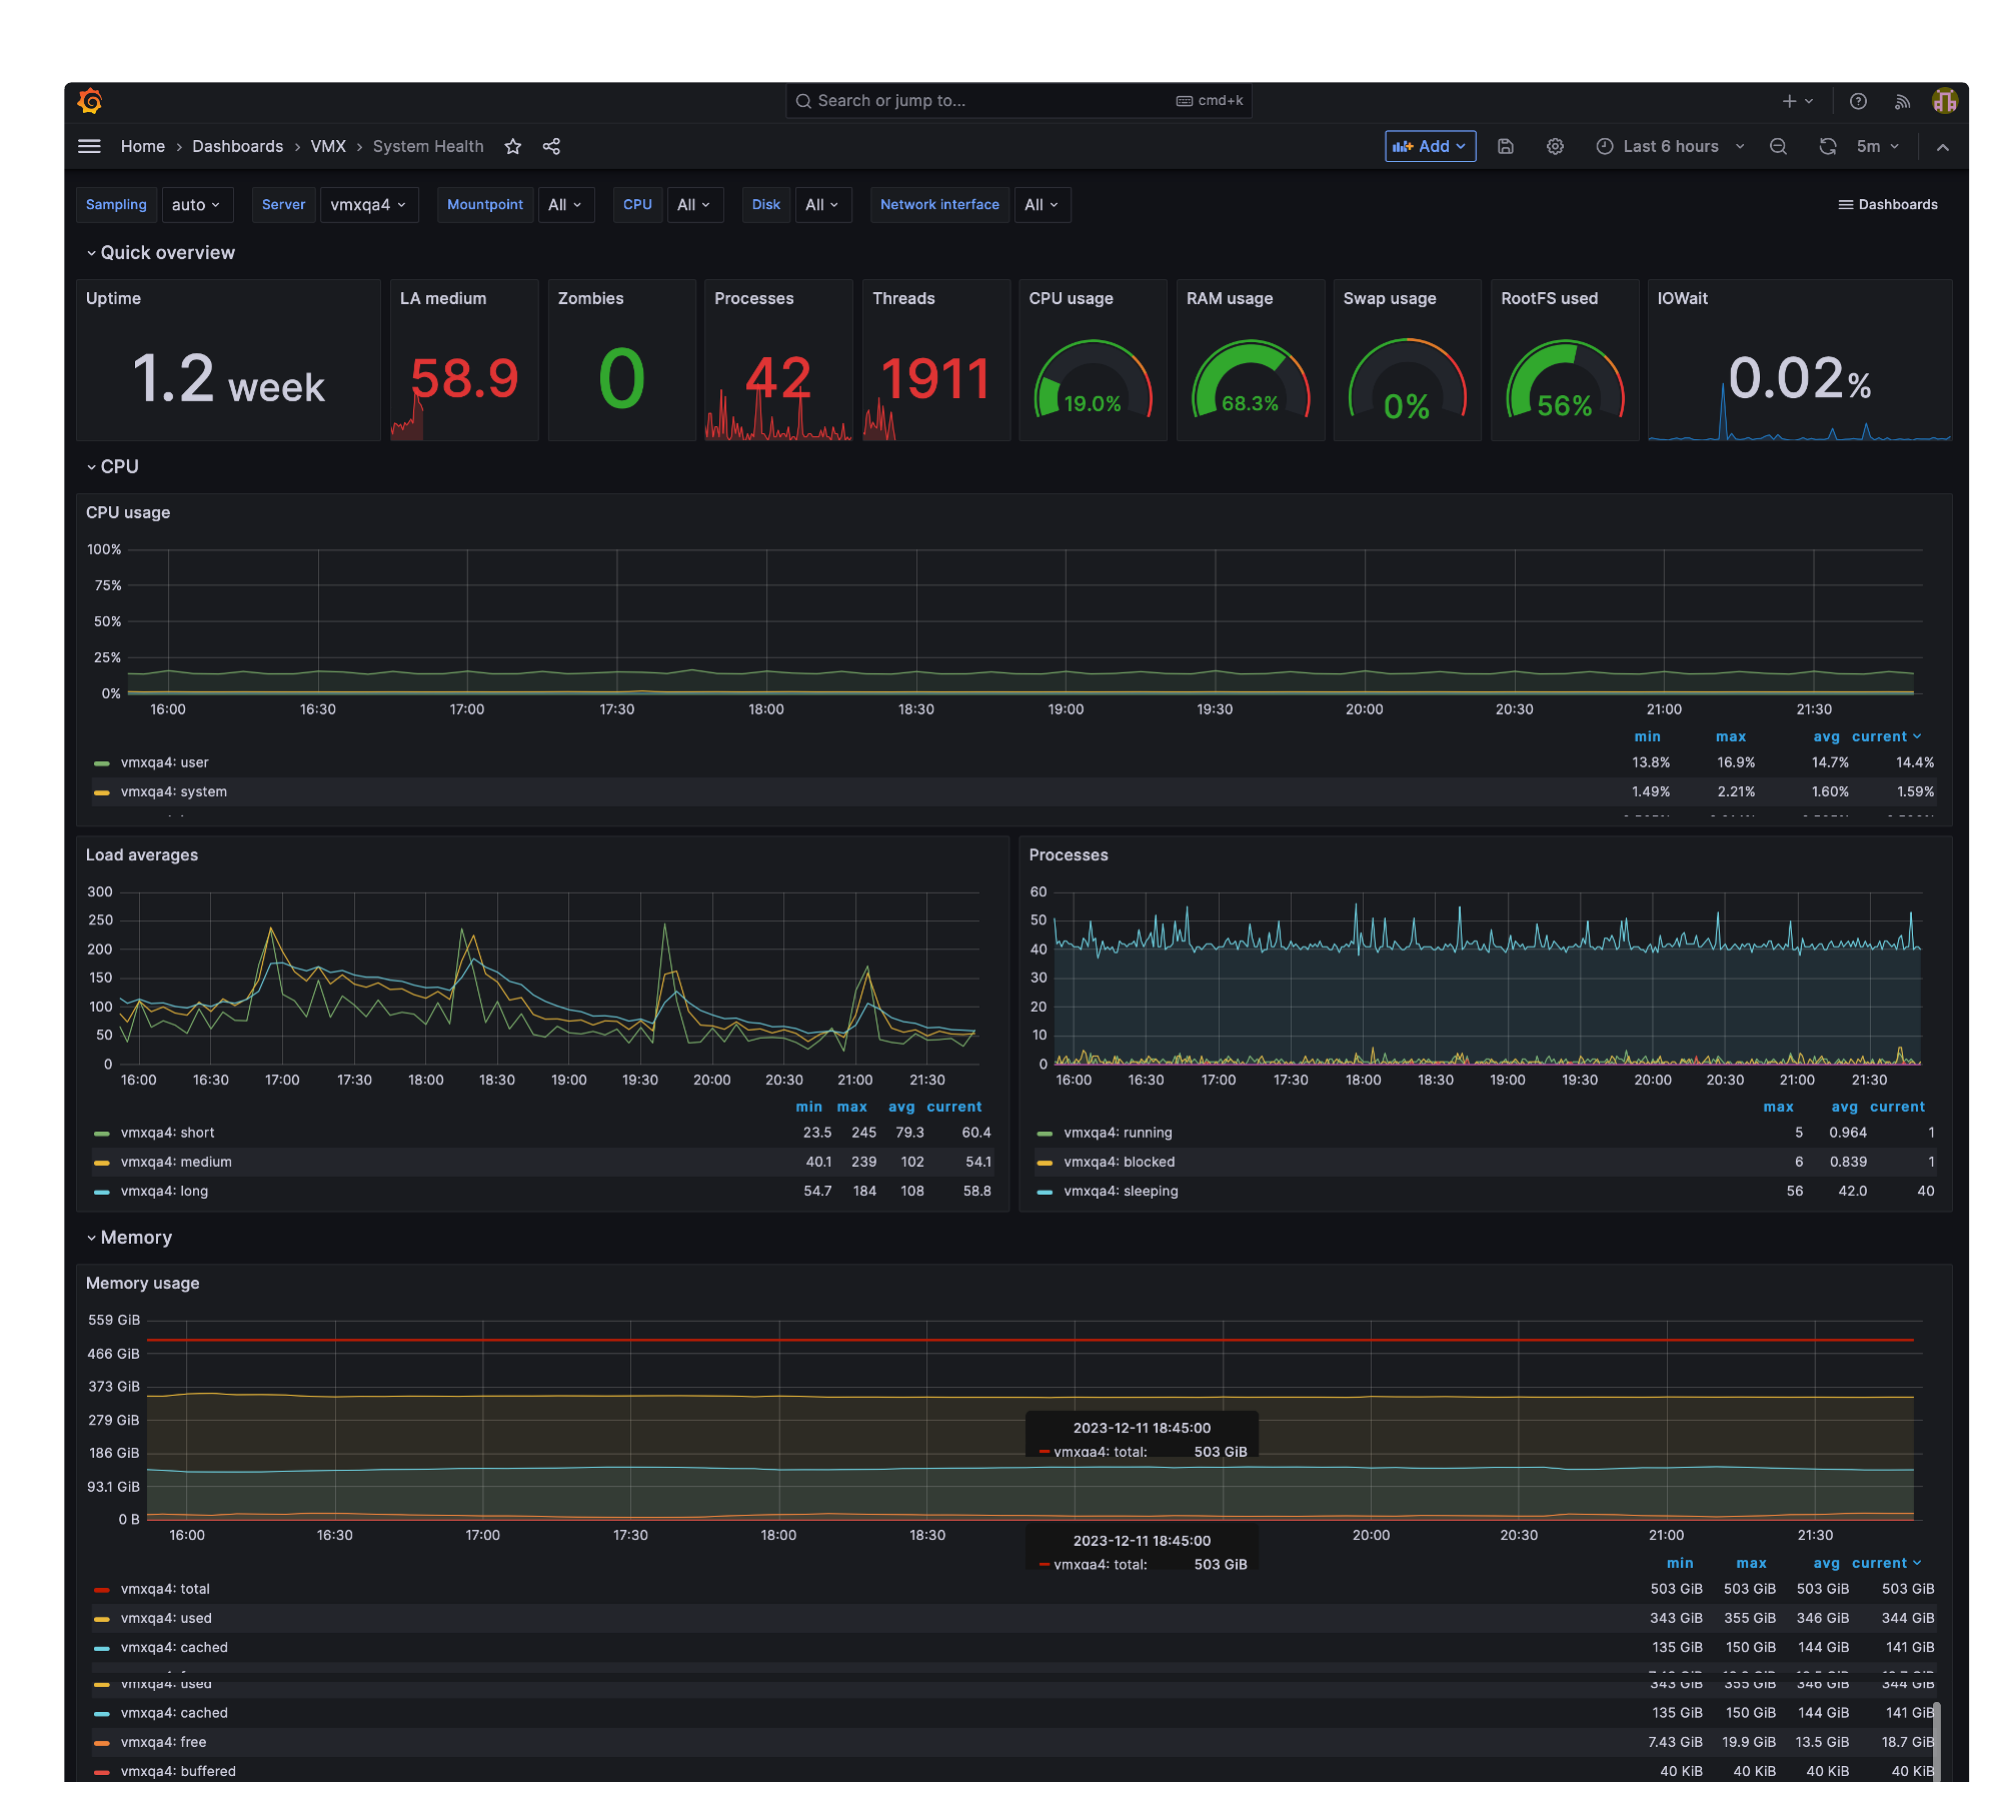
At the top of the page:
Search dashboards
Search dashboards by dashboard title and panel title.Add
Add a new visualisation (panel), row, or import to this dashboard.
Not shown if dashboard is set to Read Only.Time Picker
Select the time range for this dashboard.
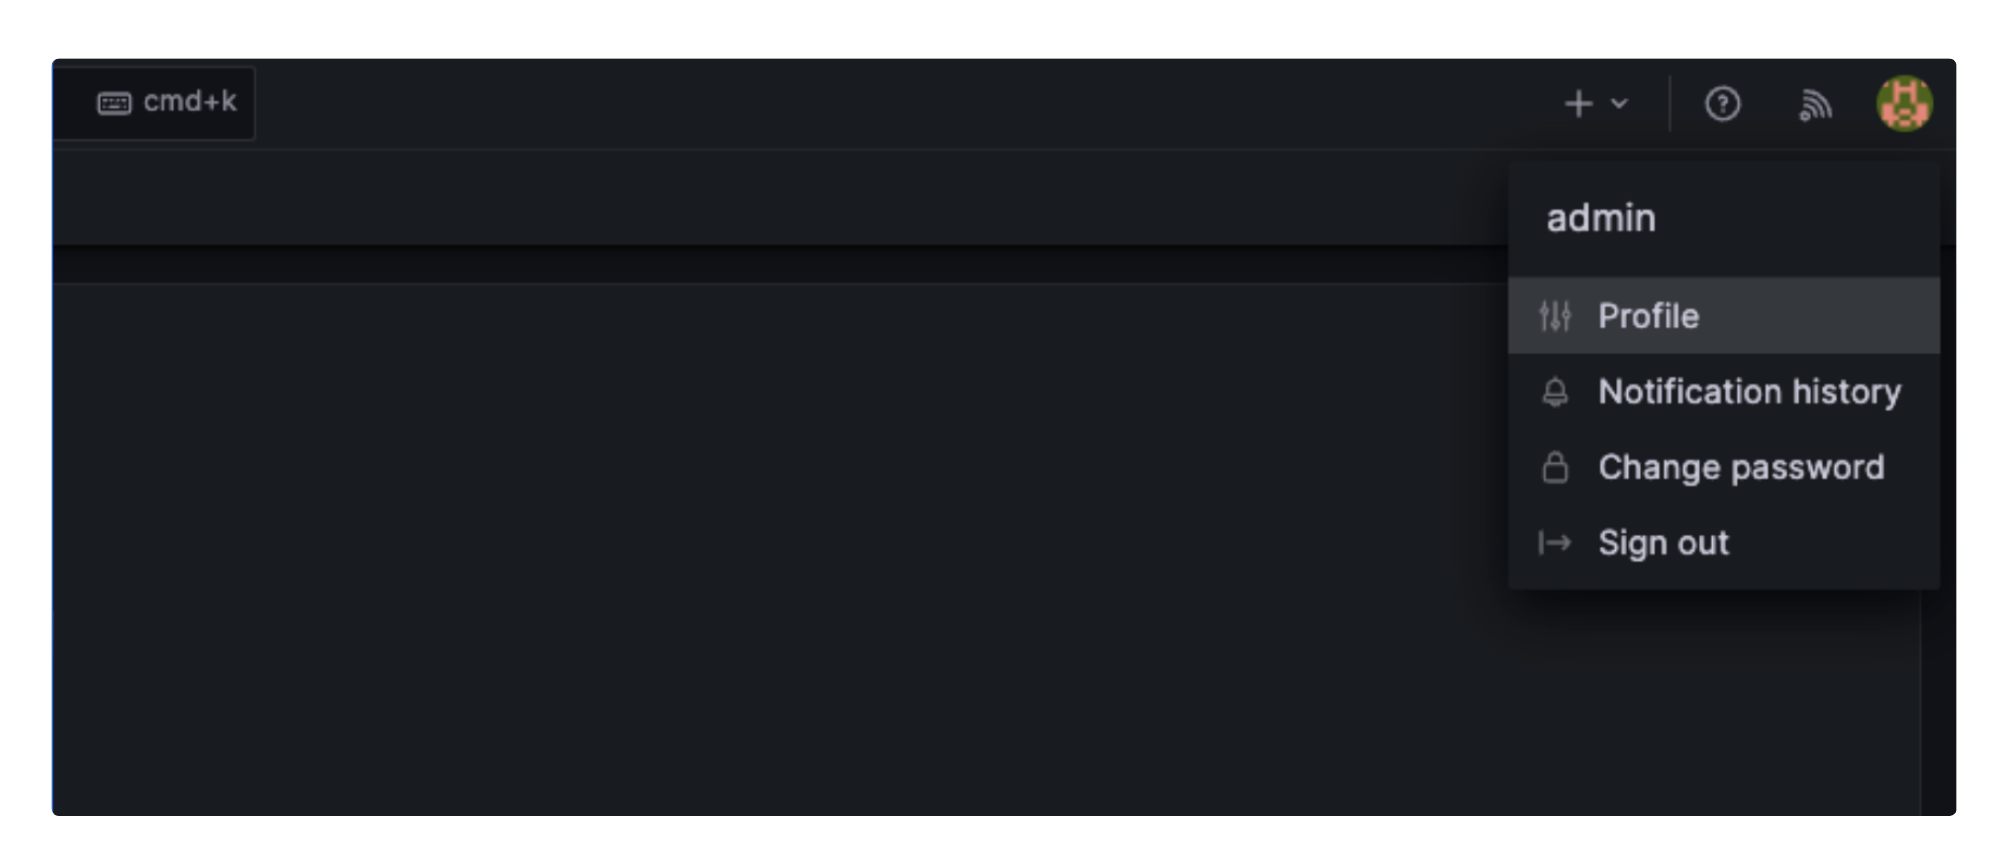
Select the menu button in the top left to display a navigation menu containing the options:
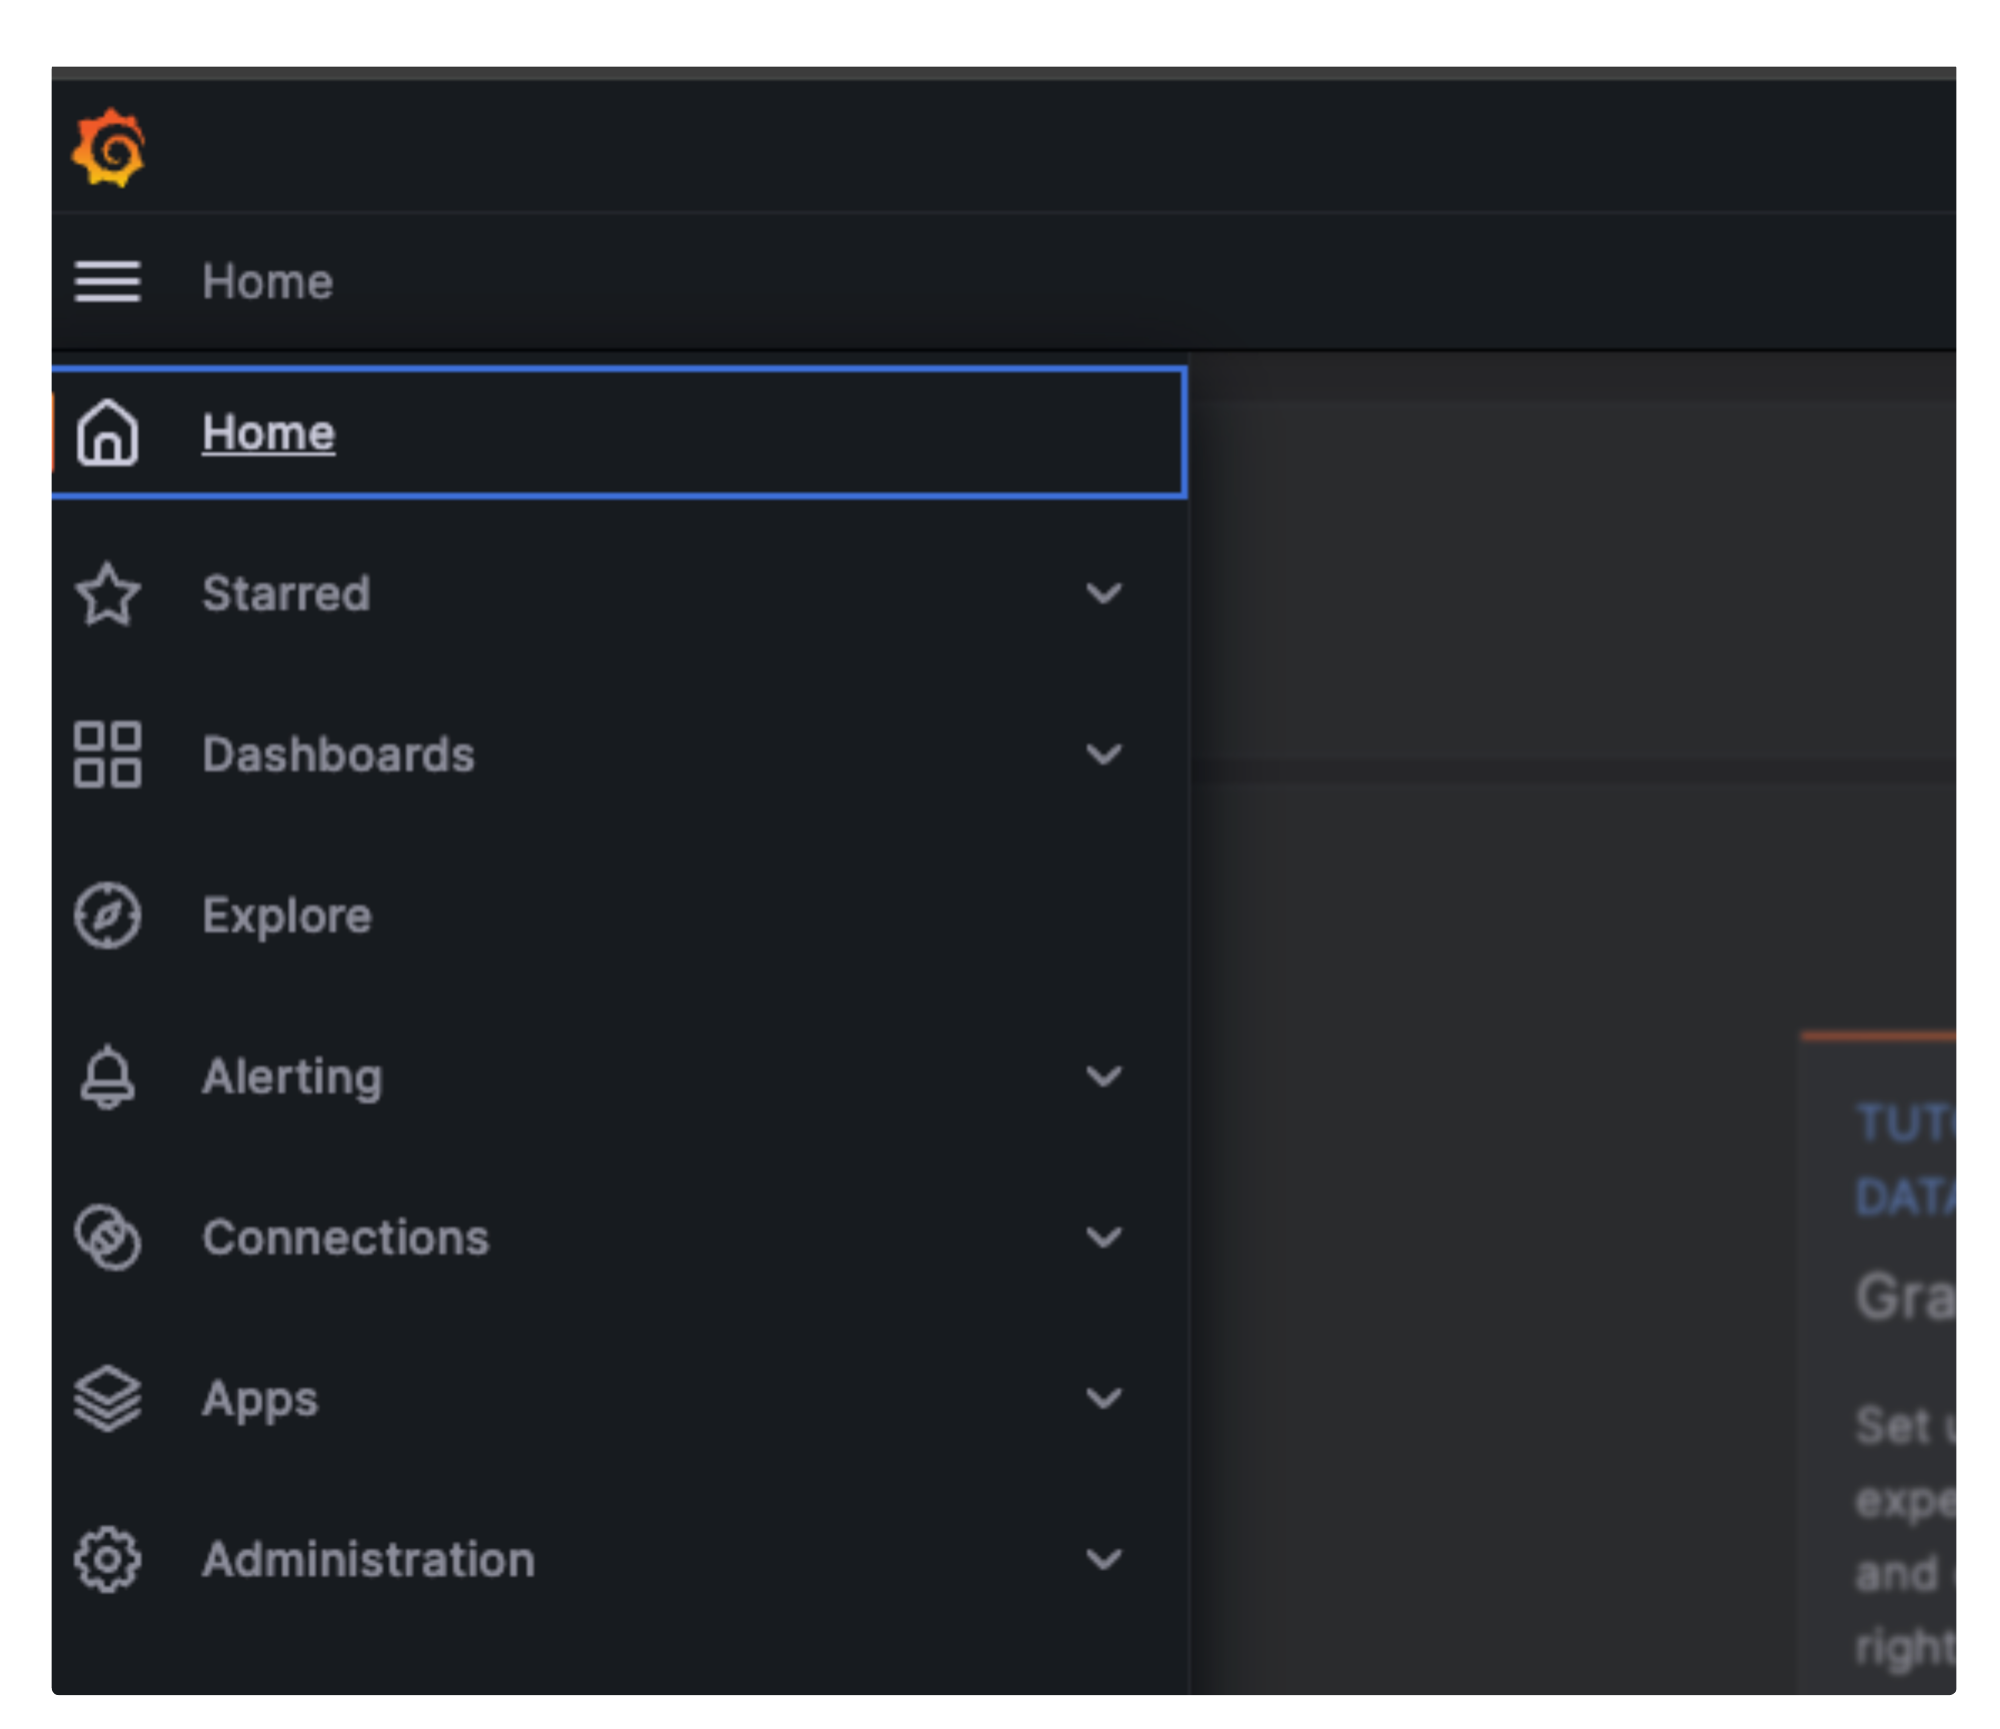
Home
Displays the Home Dashboard set either by the Organisation or User.Starred
A list of the dashboards you’ve favourited for quick access. Star a dashboard by opening the dashboard and selecting the star icon by the dashboard title.Dashboards
(browse, playlists, snapshots, library panels, + new dashboard, + new folder, + import)
Create, browse, share, and manage your dashboards, folders, and panels. The standard dashboards provided by Beeks are listed here.Explore
Create, run and test a query without a dashboard, with the option to create a visualisation for it later.Alerting
(alert rules, contact points, notification policies)
View alert status, history and manage rules and contact points - for users with admin access.Connections
(Data sources)
Manage Data sources - only for users with admin access.Apps
Open the Beeks Analytics app that provides further features to your Grafana instance.Administration
(Data sources, Plugins, Users, Teams, Service accounts, API keys, Default preferences)
Perform administration and set up - only for users with admin access.
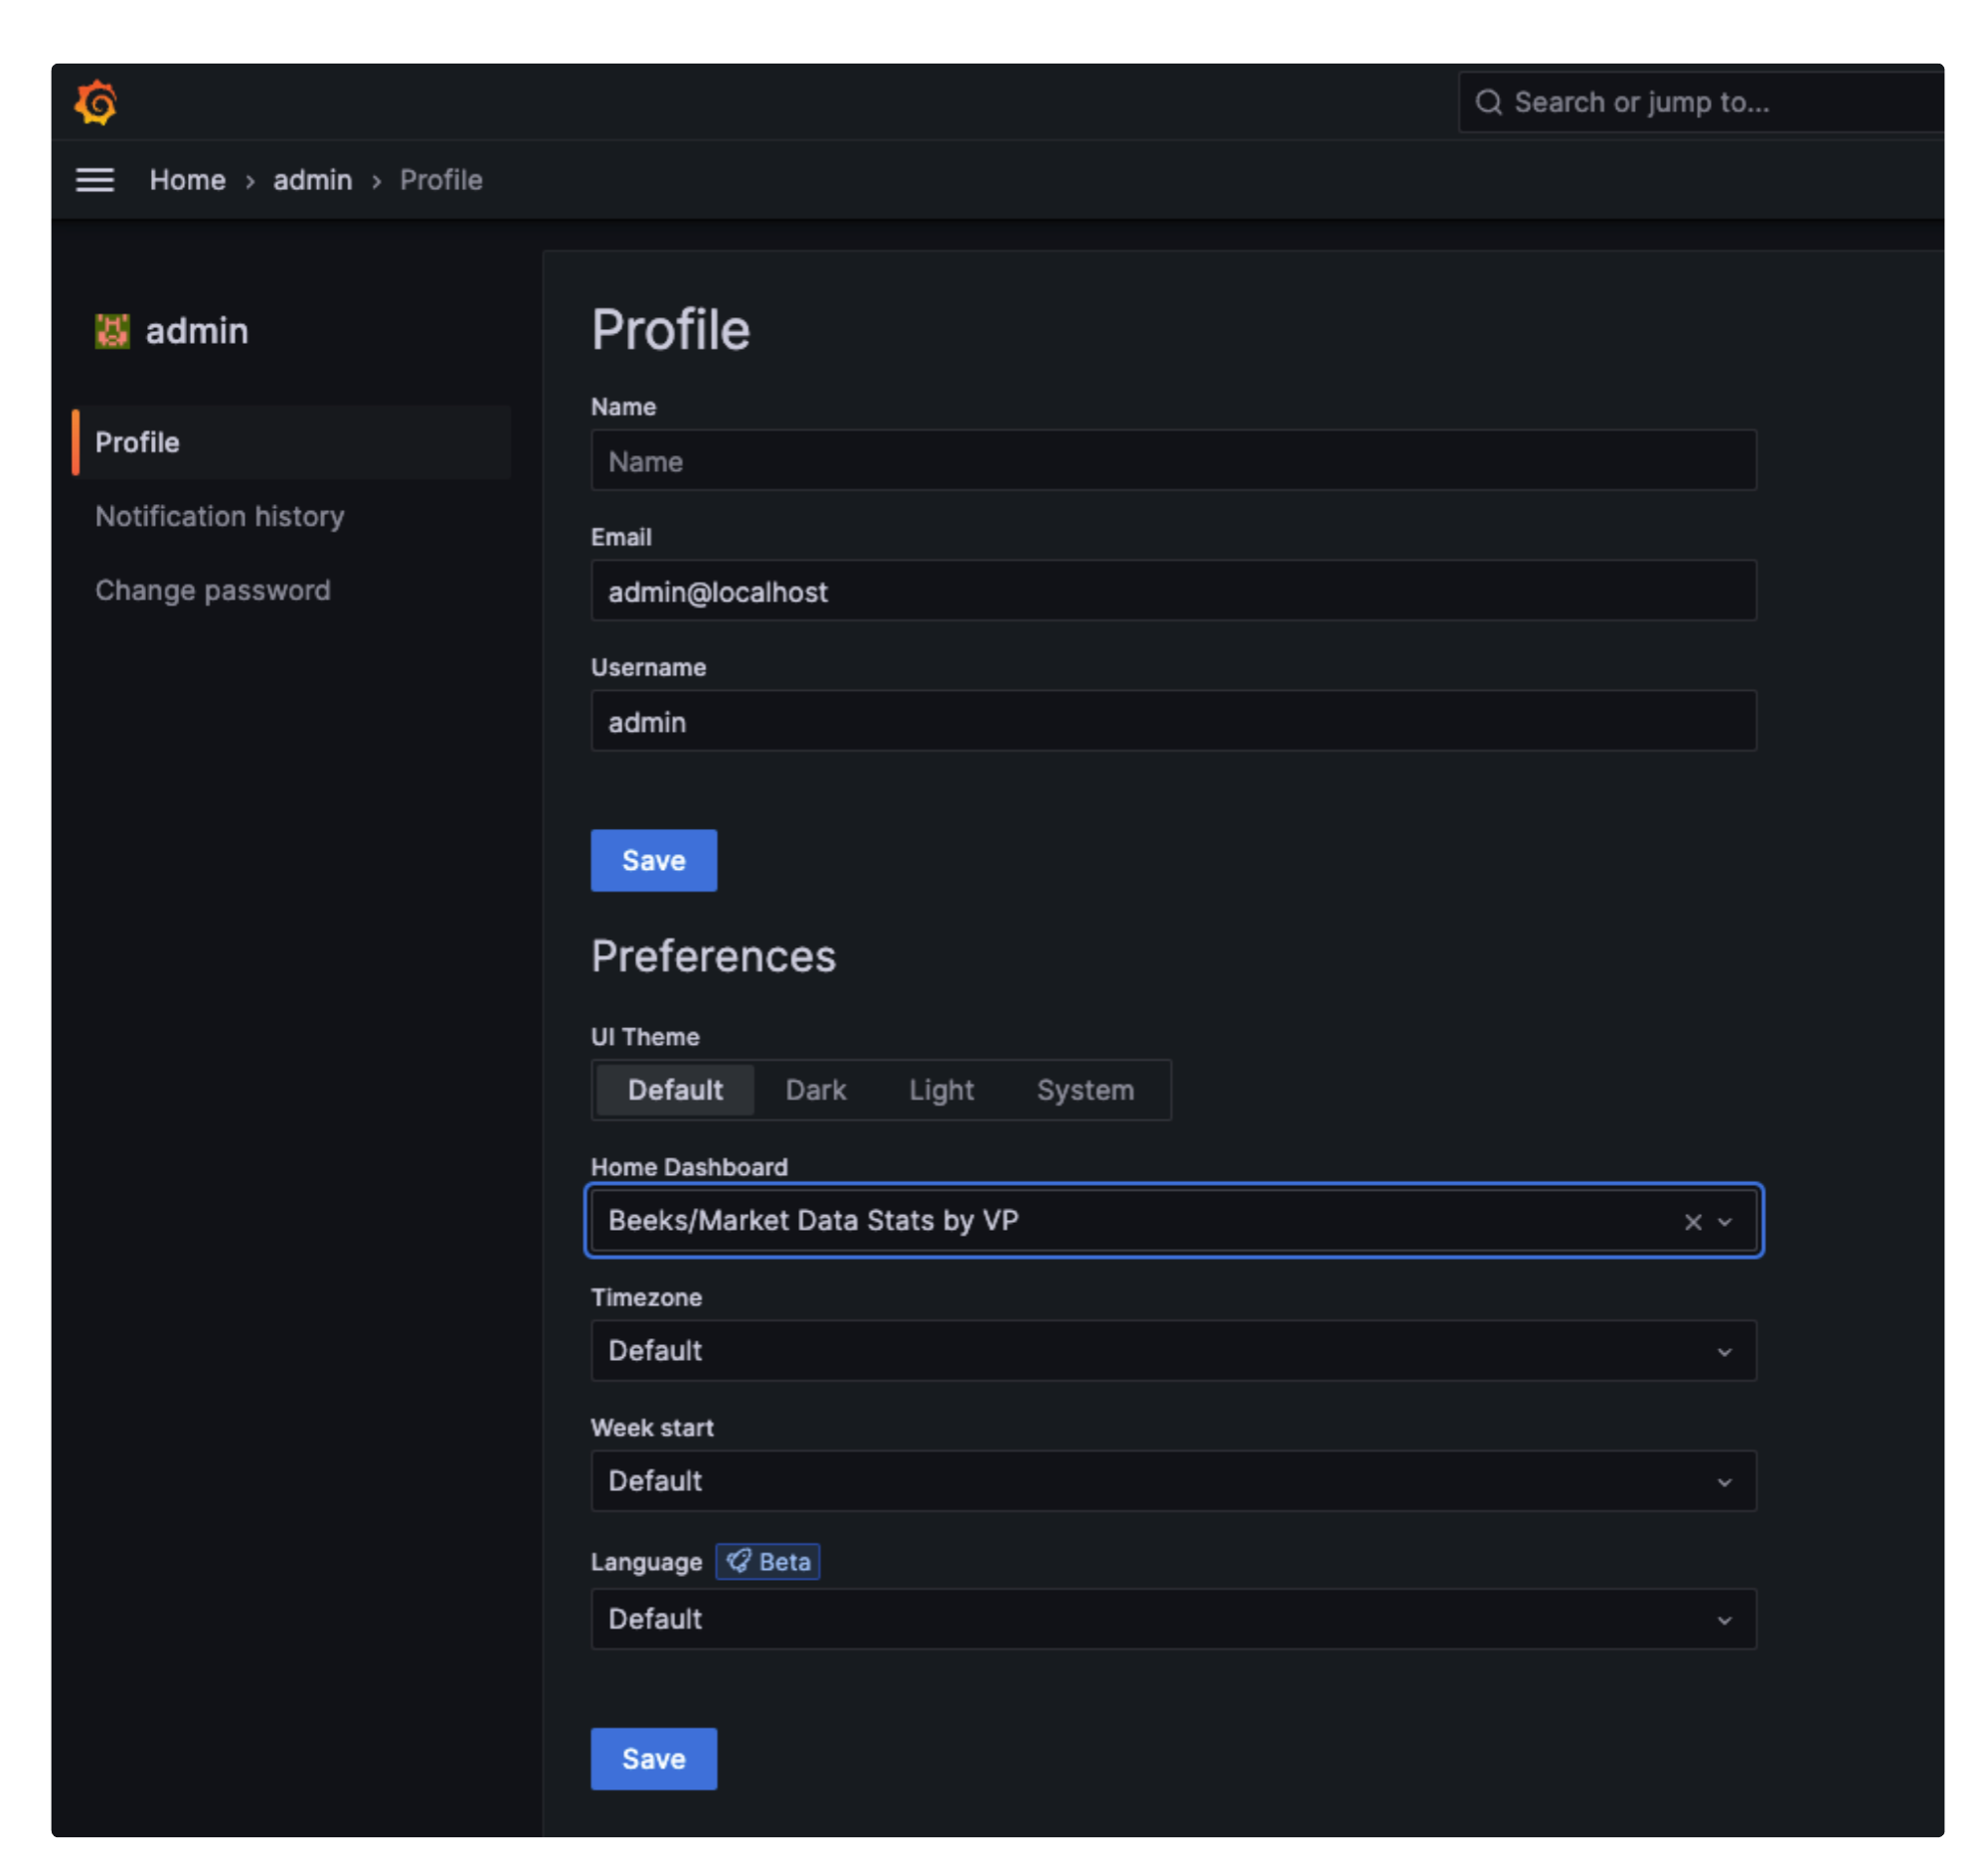
Configuring your Home Dashboard
Note in the following screenshot that the Home Dashboard field is set to Default Dashboard.
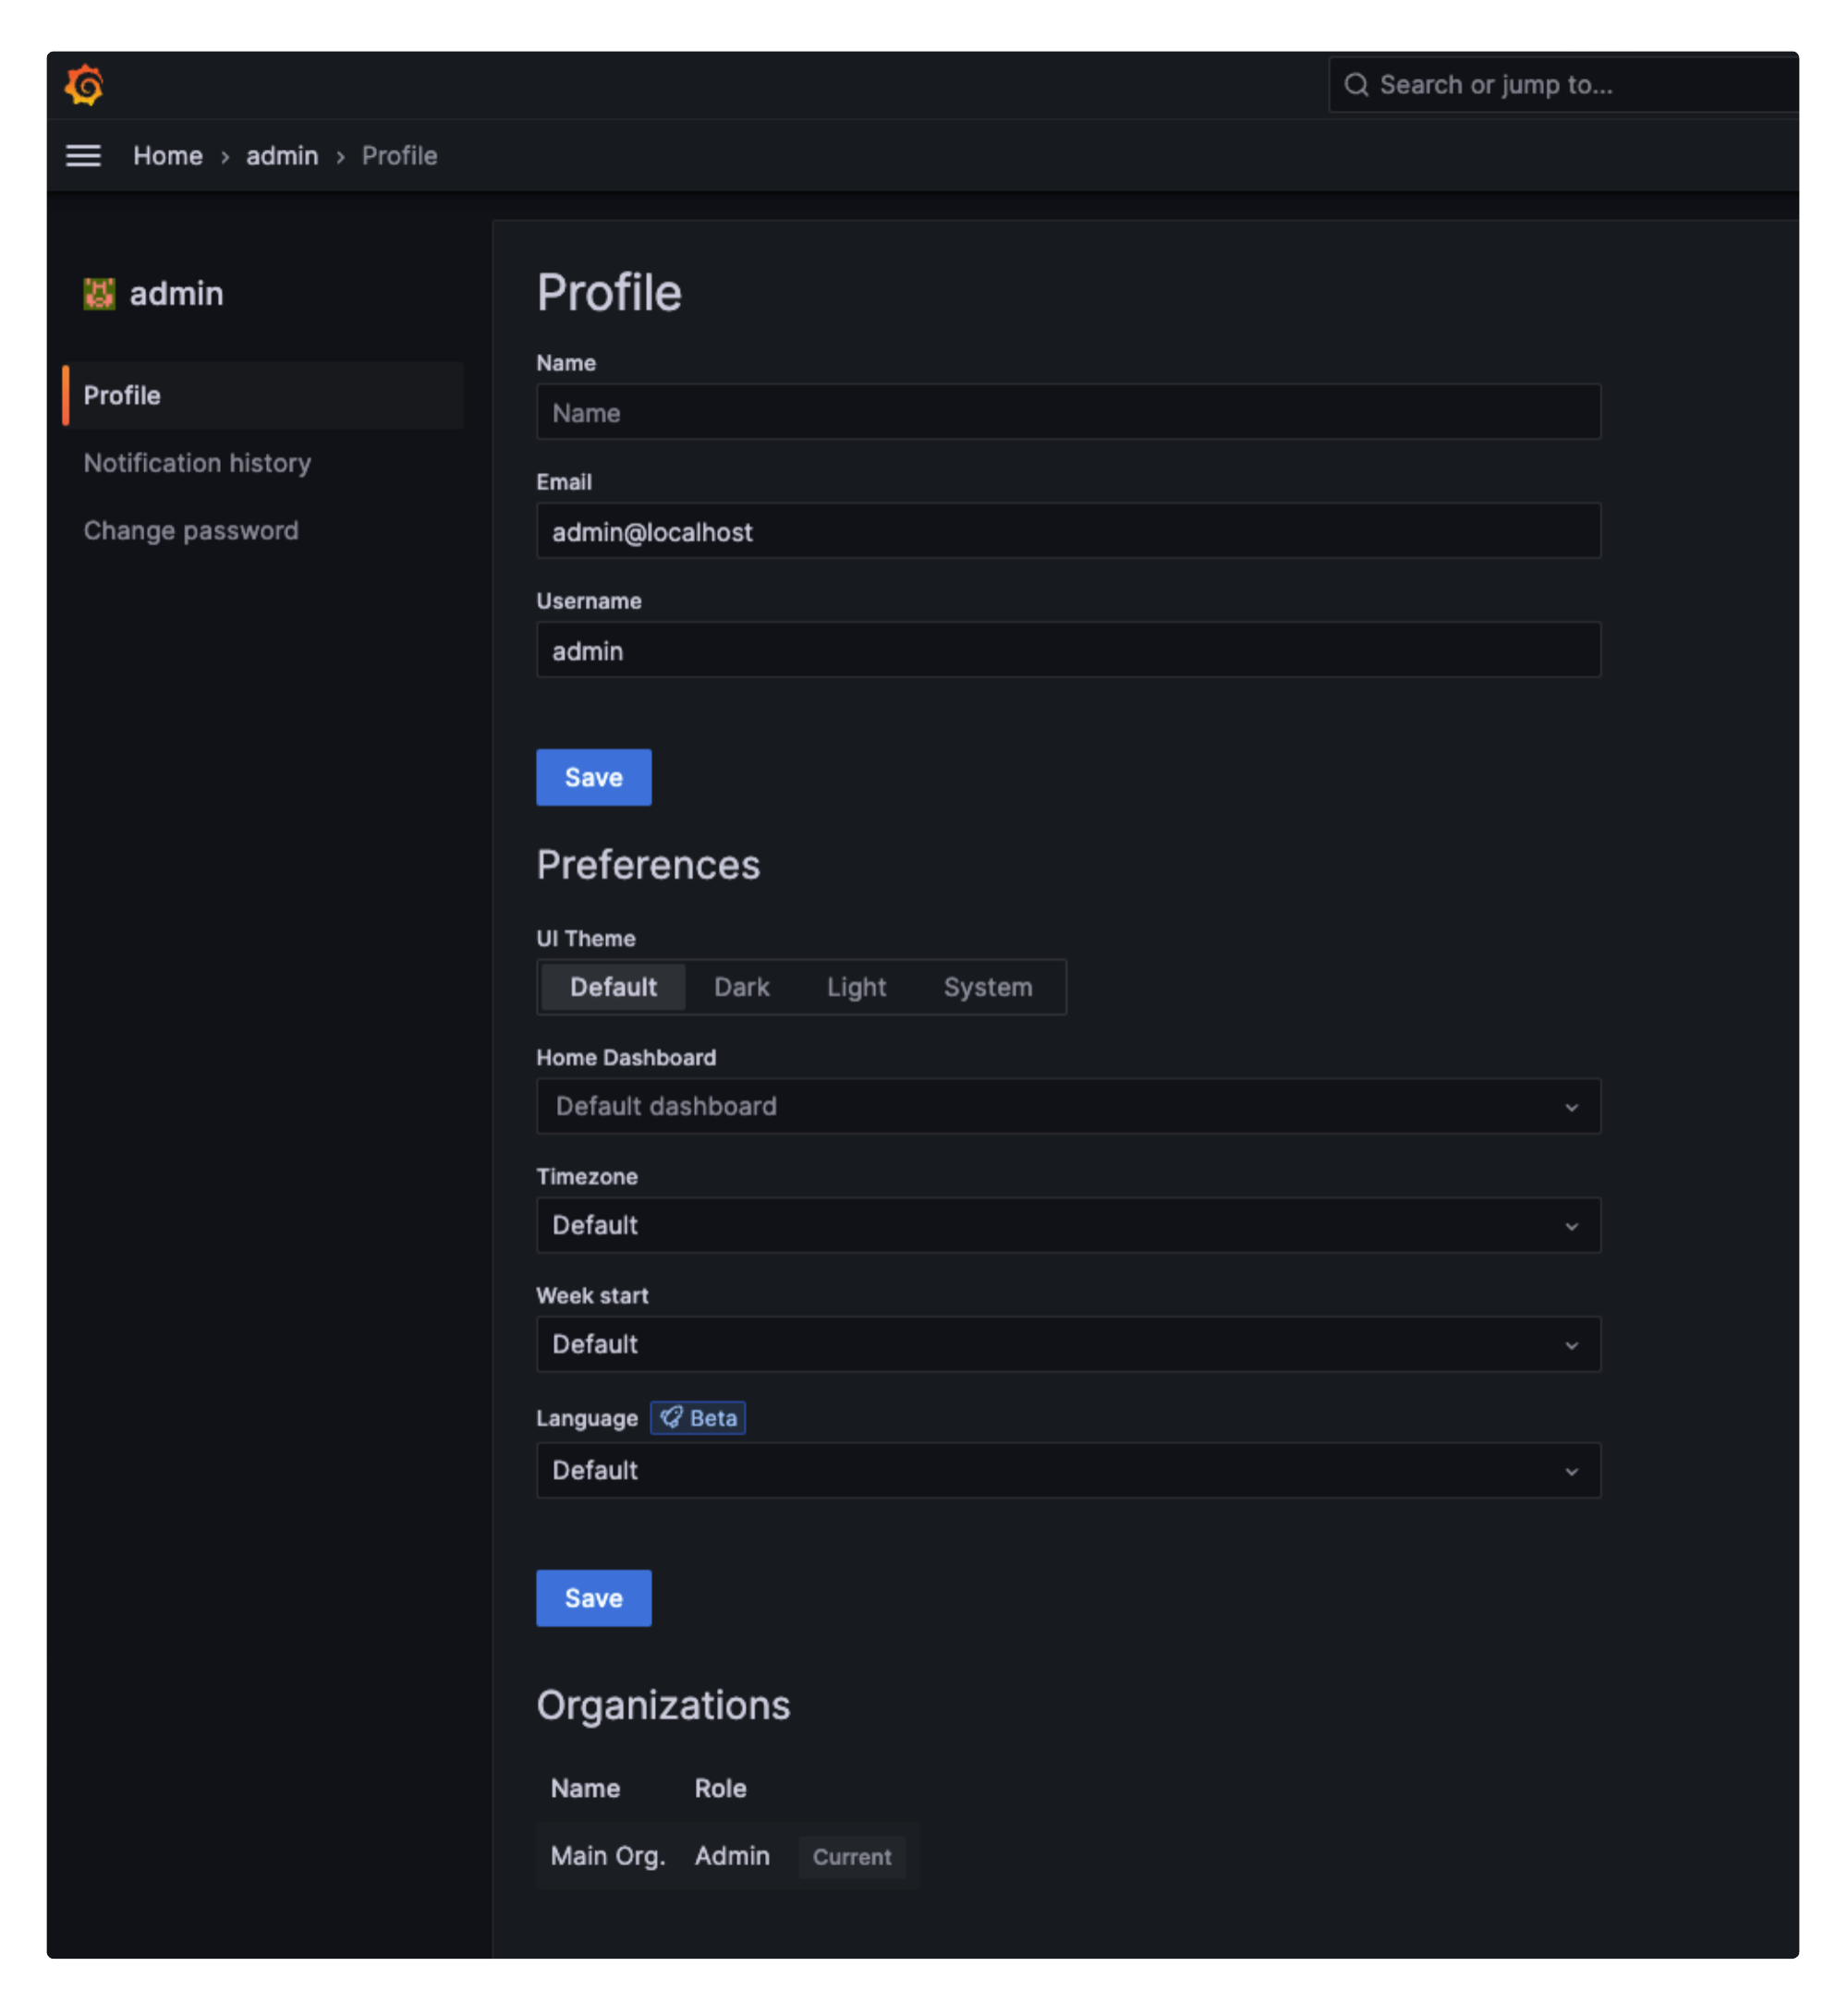
Enter the name of your preferred dashboard into the Home Dashboard field.