VMX-Explorer is available with a suite of additional Beeks Analytics features (as required) that are enabled via Beeks plugins.
One of these plugins is the Beeks Analytics App, which offers further Beeks features. If the Beeks Analytics App is installed, you’ll see a Beeks Analytics app in the Apps page that opens when you select Apps from the navigation menu.
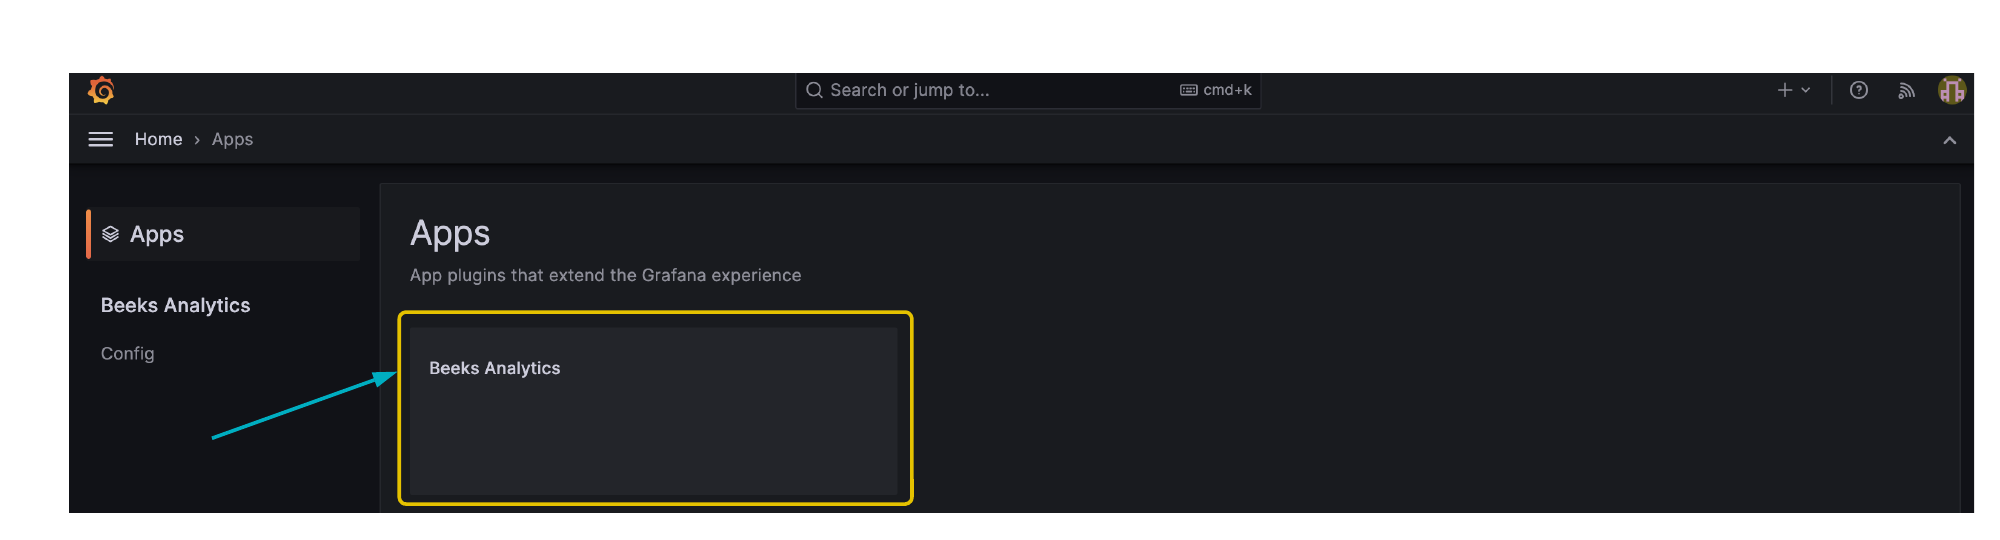
Select the Beeks Analytics app to access the optional features that have been enabled for you. Each feature has a dedicated tab in VMX-Explorer.
The tabs are:
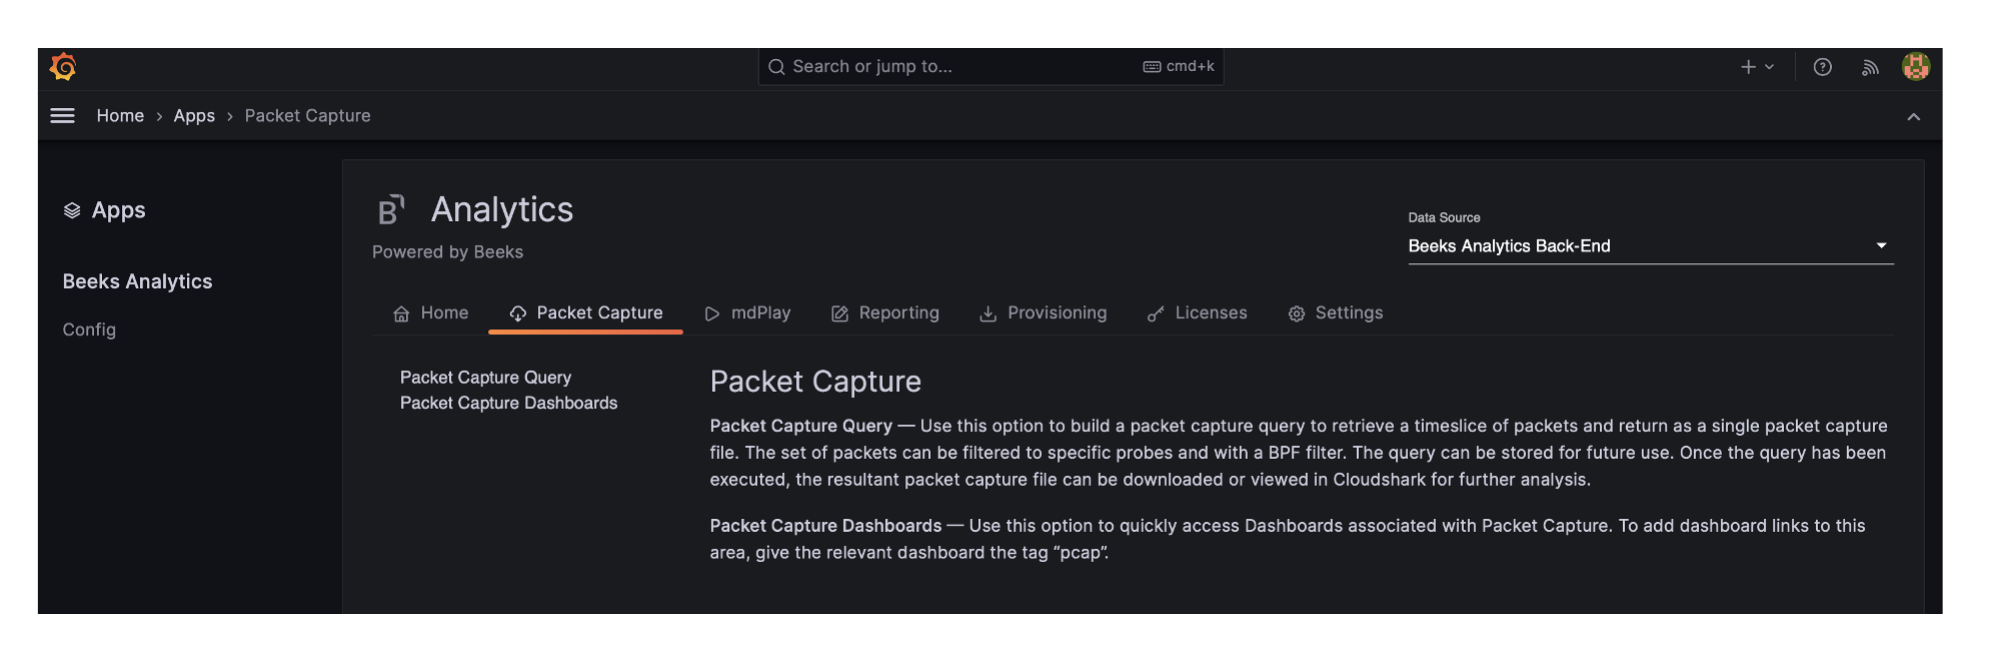
Packet Capture
Packet Capture Query
Build a packet capture query to retrieve a timeslice of packets and return it as a single packet capture file. You can filter the set of packets by specific probes and with a BPF (Berkeley Packet Filter). You can save the query for future use. Once the query has been executed, you can download the resultant packet capture file or further analysis.Packet Capture Dashboards
Provides a shortcut to your existing dashboards that are associated with packet analysis.
mdPlay
This tab is available only if your licence includes mdPlay. For more details on mdPlay, see the Analytics Concepts Guide.
This tab offers the following:
mdPlay Control
Select and playback one or more previously created mdPlay scenarios.Add New mdPlay Scenario
Record new scenarios for playback using the mdPlay Control option.mdPlay Scenario Manager
Manage scenario data.
mdPlay Dashboards
Provides a shortcut to your existing dashboards that are associated with mdPlay.
Reporting
This tab is available only if your license includes reporting, which is the ability to generate and download reports from the dashboards (.csv or .pdf).
This tab offers the following:
Create Report
Generate an ad-hoc report, or create a Report Definition, with or without a schedule.View Reports
Find and view generated reports, both Grafana and non-Grafana reports. The view can be filtered for a time range (default : last hour) and specific Report Definition.Report Definitions
Provides a shortcut to manage and make changes to Grafana Report Definitions.Report logo
Change the default logo used on reports.
If you are connected to a remote server, only the View Reports functionality is available.
Provisioning
Import provisioned dashboards.
Licenses
View and update your Beeks Analytics licence.
Settings
Change specific settings for the VMX system.