Use Case
The end user wants to view network level stats for a specific Trading Gateway in order to troubleshoot issues with a specific Exchange.
Dashboard
The TCP Stats per Trading Gateway dashboard displays TCP level stats per Trading Gateway from the TCP GW Stats Aggregator, as opposed to the standard TCP Aggregator, which only drills down the ExtGroup/DS level, and which is shown in the Traffic Stats dashboard.
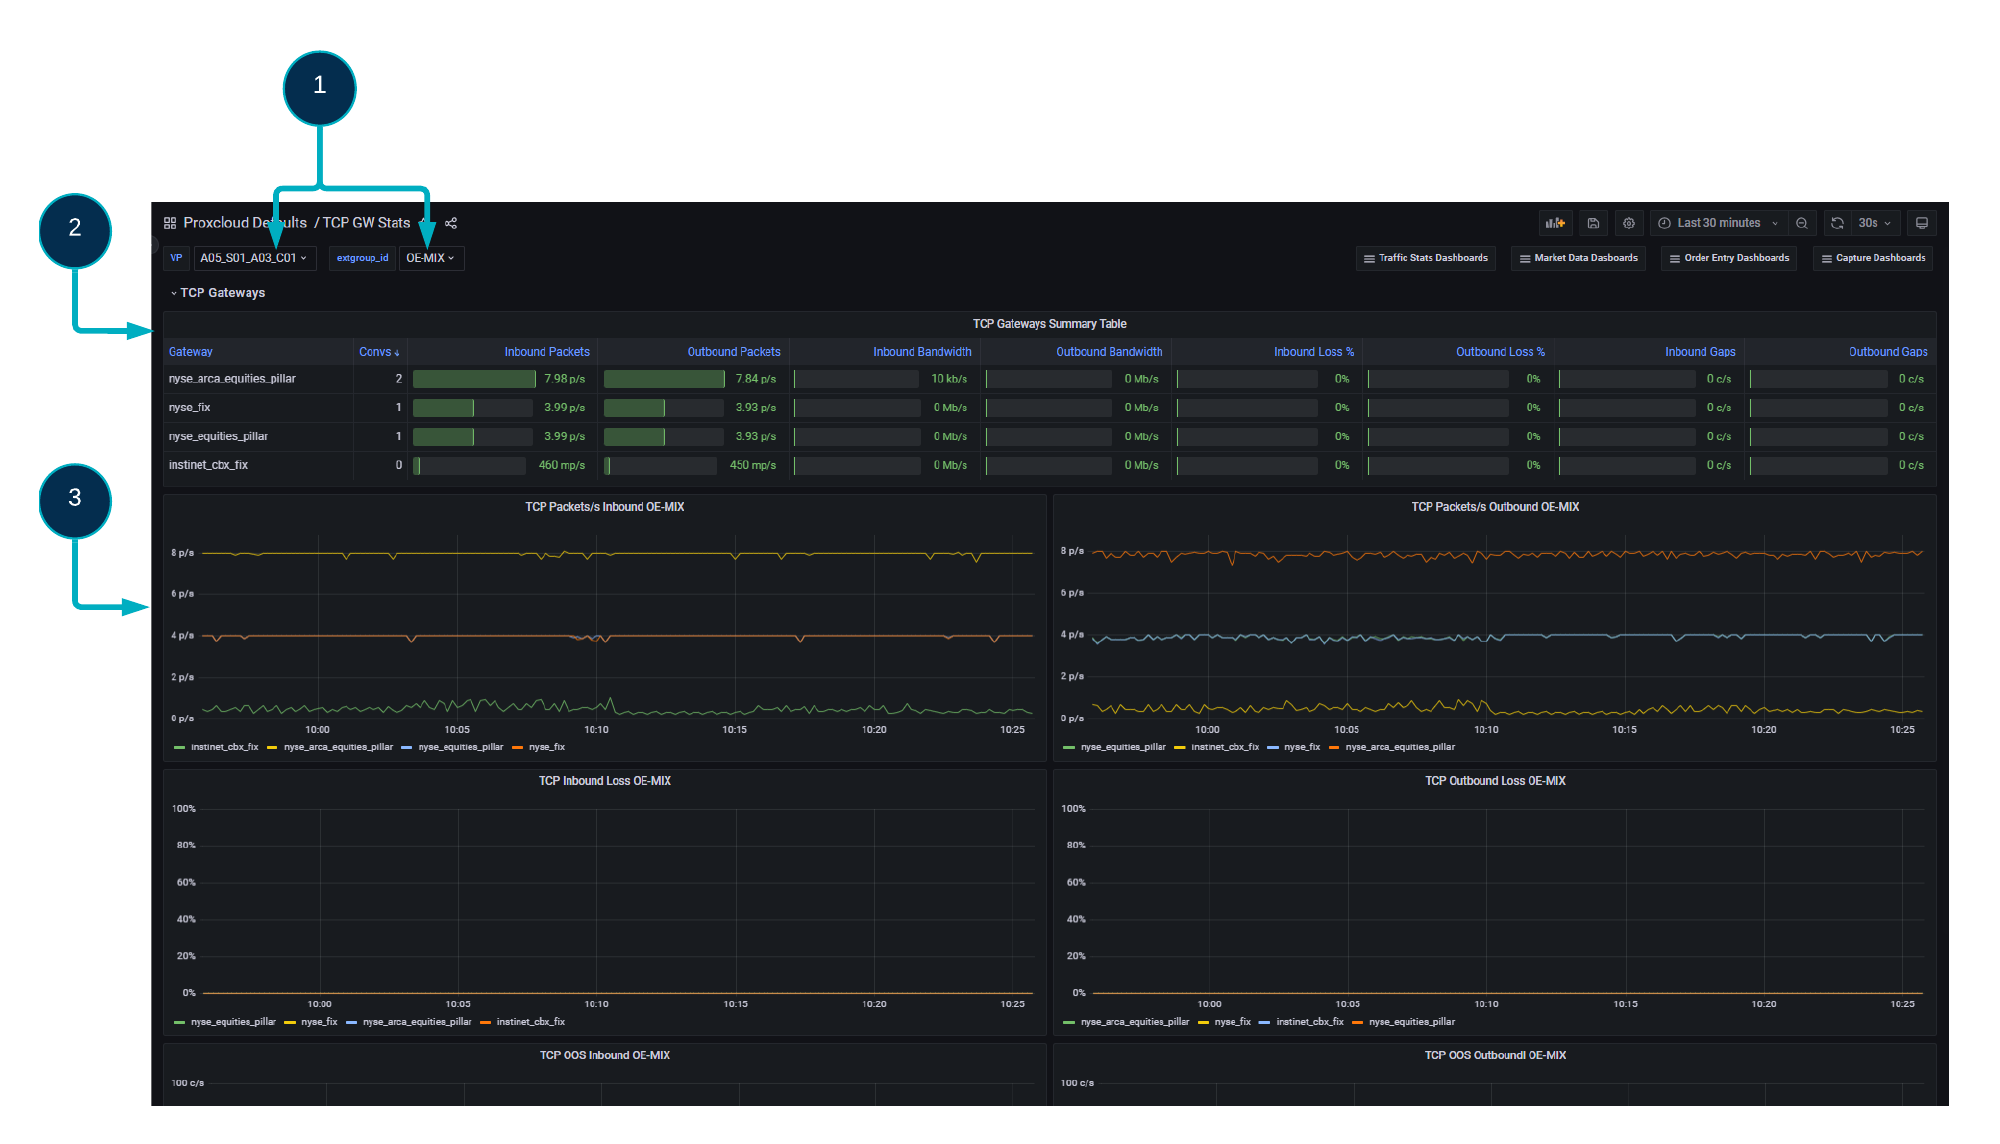
The dashboard is split out by Visibility Point (VP) & ExtGroup (extgroup_id), which are selectable variables at the top of the dashboard (1).
The first panel (2) shows a table with all Trading Gateways/Line’s for the selected VP/ExtGroup combination, detailing overall stats for the selected timeframe:
Conversations
Inbound/Outbound Packet Rate
Inbound/Outbound Bandwidth
Inbound/Outbound Loss %
Inbound/Outbound Gaps.
Below this, we have 6 Timeseries panels (3) which are:
Inbound/Outbound Packet Rate
Inbound/Outbound Loss %
Inbound/Outbound Out Of Sequence messages.