As part of its open architecture, Beeks Analytics offers many different points for you to access analytics output. This flexibility provides Beeks Analytics users with the following benefits:
Match the interface to your requirements
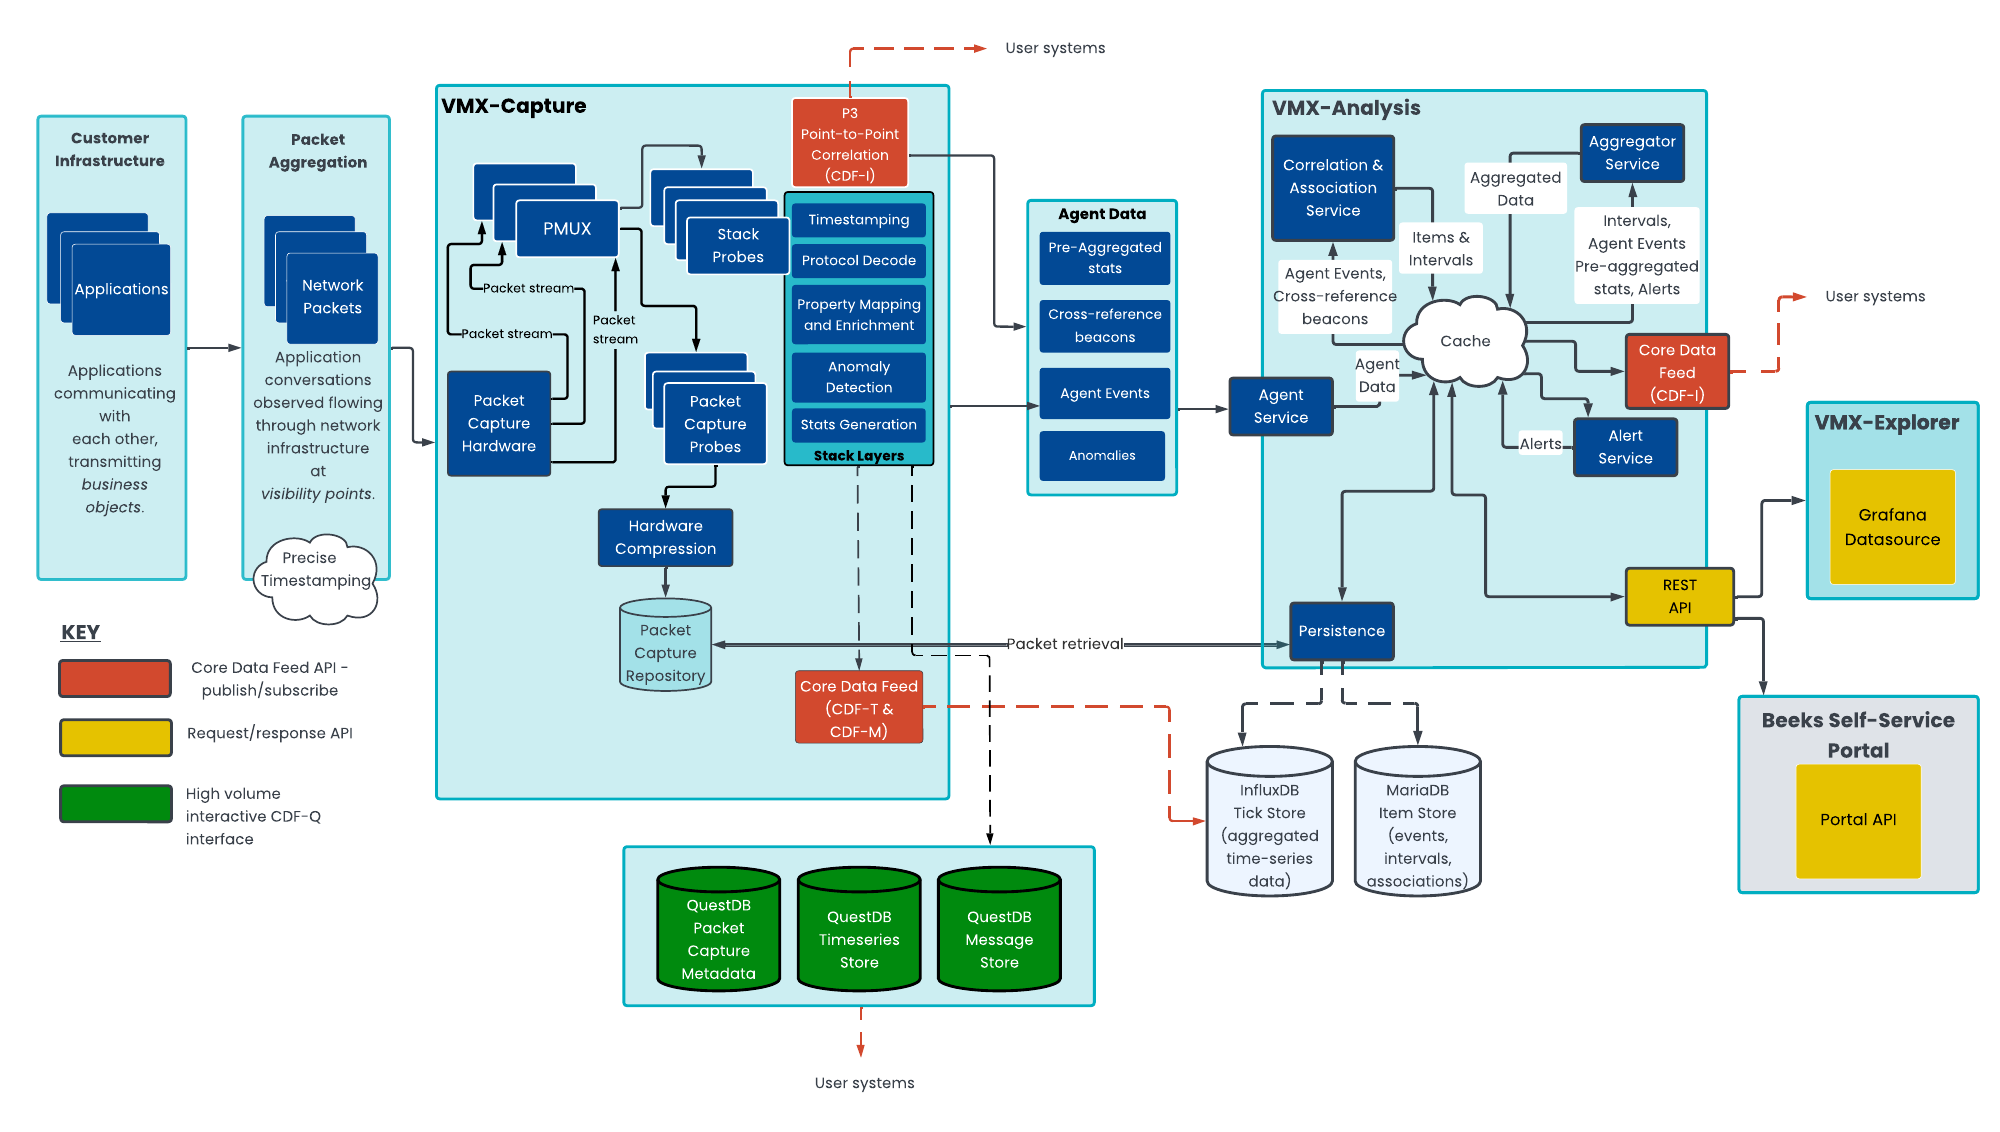
Use a RESTful API for request/response access to analytics or use a publish/subscribe streaming interface for consumption of individual messages or ongoing big data system integration.Consume high-volume data as close to the source as possible, with minimal processing overhead
If you want to consume high-volume data cost-effectively (e.g., near real-time message decodes or notifications of gaps), you’ll need to be able to scale your costs and deployments linearly, as opposed to the wasteful step costs involved in appliance-based licencing models.Perform interactive analysis directly within the analytics platform using SQL
Use the Beeks Analytics CDF-Q interface to query decoded messages and statistics in situ from the QuestDB timeseries store, ideal for dynamic exploration, rapid prototyping, or building ad hoc dashboards without needing to egress the data.
Request/response APIs
Beeks Analytics REST API
The REST API provides an interface to programatically access information from within the Beeks Analytics system. The Analysis Server (part of the VMX-Analysis component of the overall Beeks Analytics architecture) presents this REST API to users.
The REST API is a request/response API.
Although the REST API is presented by the Analysis Server, which is part of the VMX-Analysis architectural layer, the REST API is also used to query data from the VMX-Capture architectural layer.
Clients can deploy appliances, which are exclusively for packet capture and/or streaming of decoded data to their own systems. These systems do not have the overhead of running a full VMX-Analysis instance. In these cases, a thin deployment of VMX-Analysis that provides a more limited REST API and Grafana data source can be installed on the appliance.
For more information on the REST API, see the Beeks Analytics REST API Worked Examples Guide, which also contains links to the Swagger documentation.
VMX-Explorer Grafana Datasource
VMX-Explorer presents two Beeks Analytics Grafana data sources to the user. The advantages of a dedicated Beeks Analytics Grafana data source over direct access to the REST API are as follows:
Each data source provides its own query editor, which allows you to easily create, edit, and modify custom queries to access the data that you need.
Having a data source allows you to use the Grafana Explore interface to understand the underlying data and to help fast-track the development of custom queries and visualisations.
The back-end data source allows you to take advantage of Grafana’s rich alerting rules to create custom alerts.
For more information on the VMX-Explorer Grafana datasources, see the Beeks Analytics User Guide for VMX-Explorer.
Beeks Self-Service Portal REST API
Beeks Analytics is an integral part of the Beeks Proximity Cloud and Exchange Cloud offerings. These services make available a REST API for managing your compute items and networking. This REST API is documented on Postman and does allow you to query Analytics information. We recommend that Proximity Cloud and Exchange Cloud users who wish to query analytics information programatically do so directly via the Beeks Analytics REST API rather than using the Portal REST API.
For more information on the Portal API for Proximity Cloud and Exchange Cloud, see the Proximity Cloud: API Worked Examples .
Publish/subscribe APIs
Beeks Analytics also makes available a publish/subscribe API called the Core Data Feed (CDF) which is more suited to interfacing with VMX-Capture layer directly, or for maintaining a streaming list of updating information from the VMX-Analysis server.
The Core Data Feed:
is a Publish/Subscribe messaging feed.
outputs Agent Events, Intervals, Timeseries, Associations, Alerts, and configuration messages.
offers pre-filtering of messages to reduce volume.
offers reliable rather than guaranteed messaging, to allow for drops if there are problems consuming.
The Beeks CDF has been designed to handle large volumes of data. Given a reliable connection and enough processing power, it will send 100% of messages. However, if it detects any kind of problem in processing or transmitting events, then it will drop messages to protect itself.
For more information on the Core Data Feed see the Beeks Analytics Core Data Feed Guide.
Open Telemetry
Observability for Capital Markets
Beeks' mission is to bring cloud-like flexibility to capital markets co-location and on-premise environments.
One of the key gaps in the current hyperscalers is around observability. Capital markets clients require precision timing, from the wire, in order to manage their trading and pricing activities. This has not been available in the public cloud.
Looking at the challenge of observability for capital markets from the other perspective, existing widespread capital markets observability solutions have often been developed in proprietary silos which limit interoperability with other tools. The capital markets -specific tools are often lacking in open interfaces and industry engagement, and have not evolved to include some useful improvements to observability that have been pioneered by organisations such as the Cloud Native Computing Foundation (CNCF) project.
Beeks Analytics aims to bridge these two worlds by bringing the CNCF outlook to our capital markets analytics tools. This will provide the following benefits for users:
Monitor cloud-native style deployments (such as Kubernetes clusters and public cloud deployments) and capital markets colo and on-premises deployments using consistent dashboards and monitoring techniques.
Consistent language for describing the monitoring and data exhaust requirements for observability tooling, whether we’re talking about public cloud deployments, colo, or on-premise deployments.
See the OpenTelemetry website for more information about the project.
OpenTelemetry overview
The public cloud is starting to address some of these challenges.
OpenTelemetry is an observability framework for instrumenting, generating, collecting, and exporting telemetry data.
OpenTelemetry allows you to learn a single set of APIs and conventions for accessing information about your application.
Although the OpenTelemetry project’s main focus is around cloud-native software instrumentation, we believe that extending this framework to enable combined application-oriented visibility of the underlying infrastructure performance is a key requirement for performance-sensitive capital markets deployments, which require minimally invasive monitoring with high precision timing and without application overhead.
Key OpenTelemetry terminology
Observability allows users to understand a system’s performance from the outside. In order to do this, the system must be properly instrumented by sending signals that communicate its performance. OpenTelemetry breaks these signals down into three main areas:
Logs
A timestamped message emitted by services or other components. These are not necessarily related to a specific business transaction.Span
A span represents a unit of work or operation. A log may be included within a span, but a span adds metadata ('Attributes') to provide information about the operation it tracks.Distributed Traces (more commonly known as a Trace)
A distribute trace records the path taken by business requests as they propagate through multi-service architecture. A trace is made of one or more spans.
In addition, open telemetry often talks about metrics - a metric is a measurement of a service captured at runtime.
How Beeks Analytics takes an OpenTelemetry approach to observability
The integration points that our Core Data Feed makes available are based around the OpenTelemetry distributed tracing concepts.
Each Agent Event can be considered a Span.
Each Item can be considered a Trace.
The Core Data Feed is made available at different points in the Beeks Analytics architecture to expose the following data:
CDF-T (Telemetry)
CDF-M (Messages)
CDF-I (Items, Intervals, and richer information)
These are summarised in the next sections.
CDF-T (Telemetry)
CDF-T provides a stream of Telemetry metrics about the data we observe at a single measuring point, such as:
Information about Packet Capture files.
Layer 1 to 4 telemetry.
Microburst.
Market data analytics - for example, gap statistics, wiretime statistics.
CDF-T context is limited to a specific source decoder stack probe. Multiple stack probes can publish CDF-T output concurrently to the same topic, but each individual message can only contain data from the context of an individual decoder stack probe.
CDF-M (Messages)
A stream of decoded Messages that we observe at single measuring points, such as:
Decoded messages, including nanosecond wire receive time.
Simple latency calculations.
Like the CDF-T, CDF-M context is limited to a specific source decoder stack probe.
Each Message can be enriched with additional attributes to allow it to be considered equivalent to an OpenTelemetry span.
CDF-I (Items, Intervals, and richer information)
CDF-I is a second-level analysis that brings together CDF-T and CDF-M data from multiple points to create traces comprised of Items, Intervals, and richer Information, such as:
Agent Events. I.e. normalised messages.
Latency Intervals between Agent Events.
Associations between one Agent Event and many others.
Alerts.
Aggregated Statistics.
Anomalies
CDF-I can combine information from multiple stacks, including doing calculations and enrichment that involve information that is provided by different stacks. It also provides support for rich correlations and associations.
Direct Data Access APIs
The REST API and Grafana datasource make it easy to query statistics and items in Beeks Analytics, and they have been extended to allow access to packet captures via the VMX-Prism API.
Beeks Analytics version 14 introduces a powerful new way to interactively query analytics data: the CDF-Q. This direct SQL interface allows you to query statistics and decoded messages from within the new QuestDB time series layer. The QuestDB database is introduced in the next section.
What is CDF-Q?
CDF-Q (Core Data Feed - Query) is a new SQL interface that gives users direct access to the underlying data tables stored in QuestDB. It can be used to explore and analyse any data that has been normalised and stored in this timeseries store — such as item statistics, latency measurements, and protocol-decoded messages.
With CDF-Q, users can perform dynamic queries without needing to export data into an external database or tool. This reduces friction and delay in the analytics workflow, particularly when testing hypotheses or building new dashboards.
Benefits of SQL via CDF-Q (vs REST API or CDF streaming)
Faster iteration and exploration: Perform interactive queries directly in situ, instead of extracting data to external tools.
Dynamic aggregations: SQL makes it trivial to group, filter, and aggregate data by any field or combination of fields (e.g. latency by symbol and venue over 5-minute buckets).
Join support: Easily join across multiple tables (e.g. correlating Orders with Market Data or with Gateway health metrics).
Standard tools: SQL can be used with common libraries (e.g. pandas, dbt, Metabase) for seamless analysis and dashboarding.
Reduced infrastructure overhead: For many use cases, CDF-Q can eliminate the need for a downstream time series database or ELT pipeline.
Improved observability: Investigate anomalies on demand using ad hoc queries without needing to write custom API requests.
Comparison with REST API
Feature | REST API | CDF-Q (SQL) |
|---|---|---|
Ease of use for developers | High | Moderate (some SQL knowledge needed) |
Dynamic aggregation & filtering | Limited to what’s exposed via endpoints | Full SQL power |
Joining datasets | Not supported | Fully supported |
Integration | REST-based tools (e.g. curl, Postman) | SQL-based tools (e.g. JDBC, pandas) |
Security model | Role-based access to predefined endpoints | Query-level control may require tighter governance |
Query performance | Fast for fixed use cases | Fast for interactive work, scales with table/index design |