VMX-Prism is a Beeks Analytics packet capture system that runs on your appliance to support advanced querying, analysis, and decoding of packet captures.
VMX-Prism is designed to support a distributed network of capture probes, and offers a unified way of navigating the capture repository and querying all captured data. VMX-Explorer includes a standard dashboard that visualises VMX-Prism data.
Use VMX-Prism to:
Get individual packet capture information from a specific Prism instance on a specific appliance via the Prism REST API.
Get amalgamated packet capture information from multiple Prism instances on different appliances via the Prism REST API.
VMX-Prism is a key element that contributes to the Beeks Analytics distributed capture capability. Raw packet data from multiple separate capture appliances can be easily queried from a single location, making life much easier for clients with global Analytics deployments or with high capacity demands which require multiple capture appliances to record their traffic.
VMX-Prism can be driven from VMX-Explorer or alternatively clients can directly access VMX-Prism’s capabilities using the REST API.
Programmatic access to PCAPs, and data derived from PCAPs such as statistics and packet decodes, are a key part of the Beeks Analytics open architecture.
Example Distributed Capture Use Case - New Jersey Equity Triangle
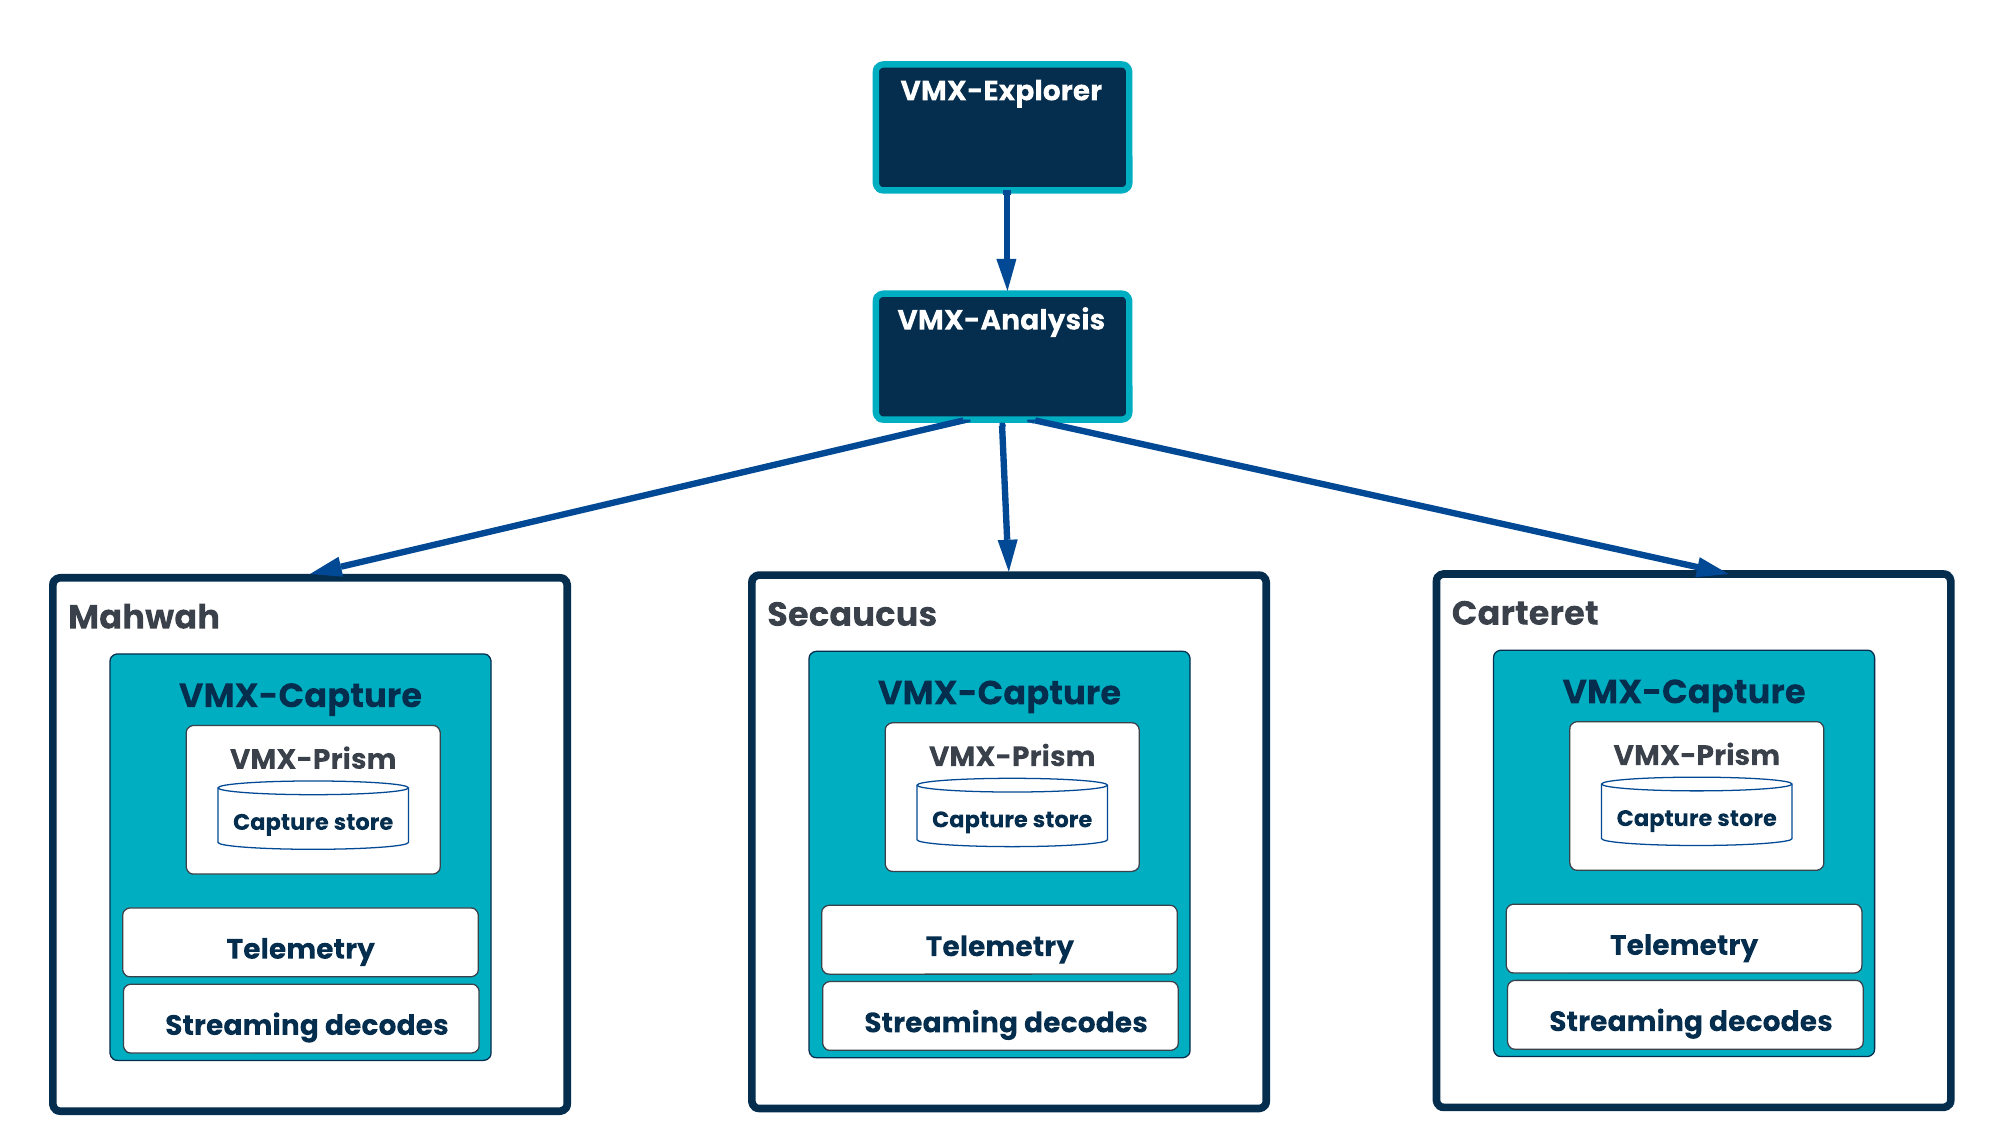
The diagram above shows an example deployment of VMX-Prism to provide access to packet captures at all three sites in the New Jersey equity triangle.
VMX-Prism in more detail
The diagram below shows how, in VMX-Explorer, each different data source targets an individual environment that has one or more capture boxes and an Analysis server. These multiple data sources can all present data within the same dashboard. Each VMX-Capture appliance has an instance of VMX-Capture, VMX-Prism, PCAP files, a Packet file re-analyser, and a Time Series Store. All Prism queries from VMX-Explorer are routed to the Beeks Analytics REST API and target either one capture box or multiple capture boxes. The queries are executed independently, in parallel, on the different appliances, with the REST API amalgamating the different results before returning these to the originating Data Source.
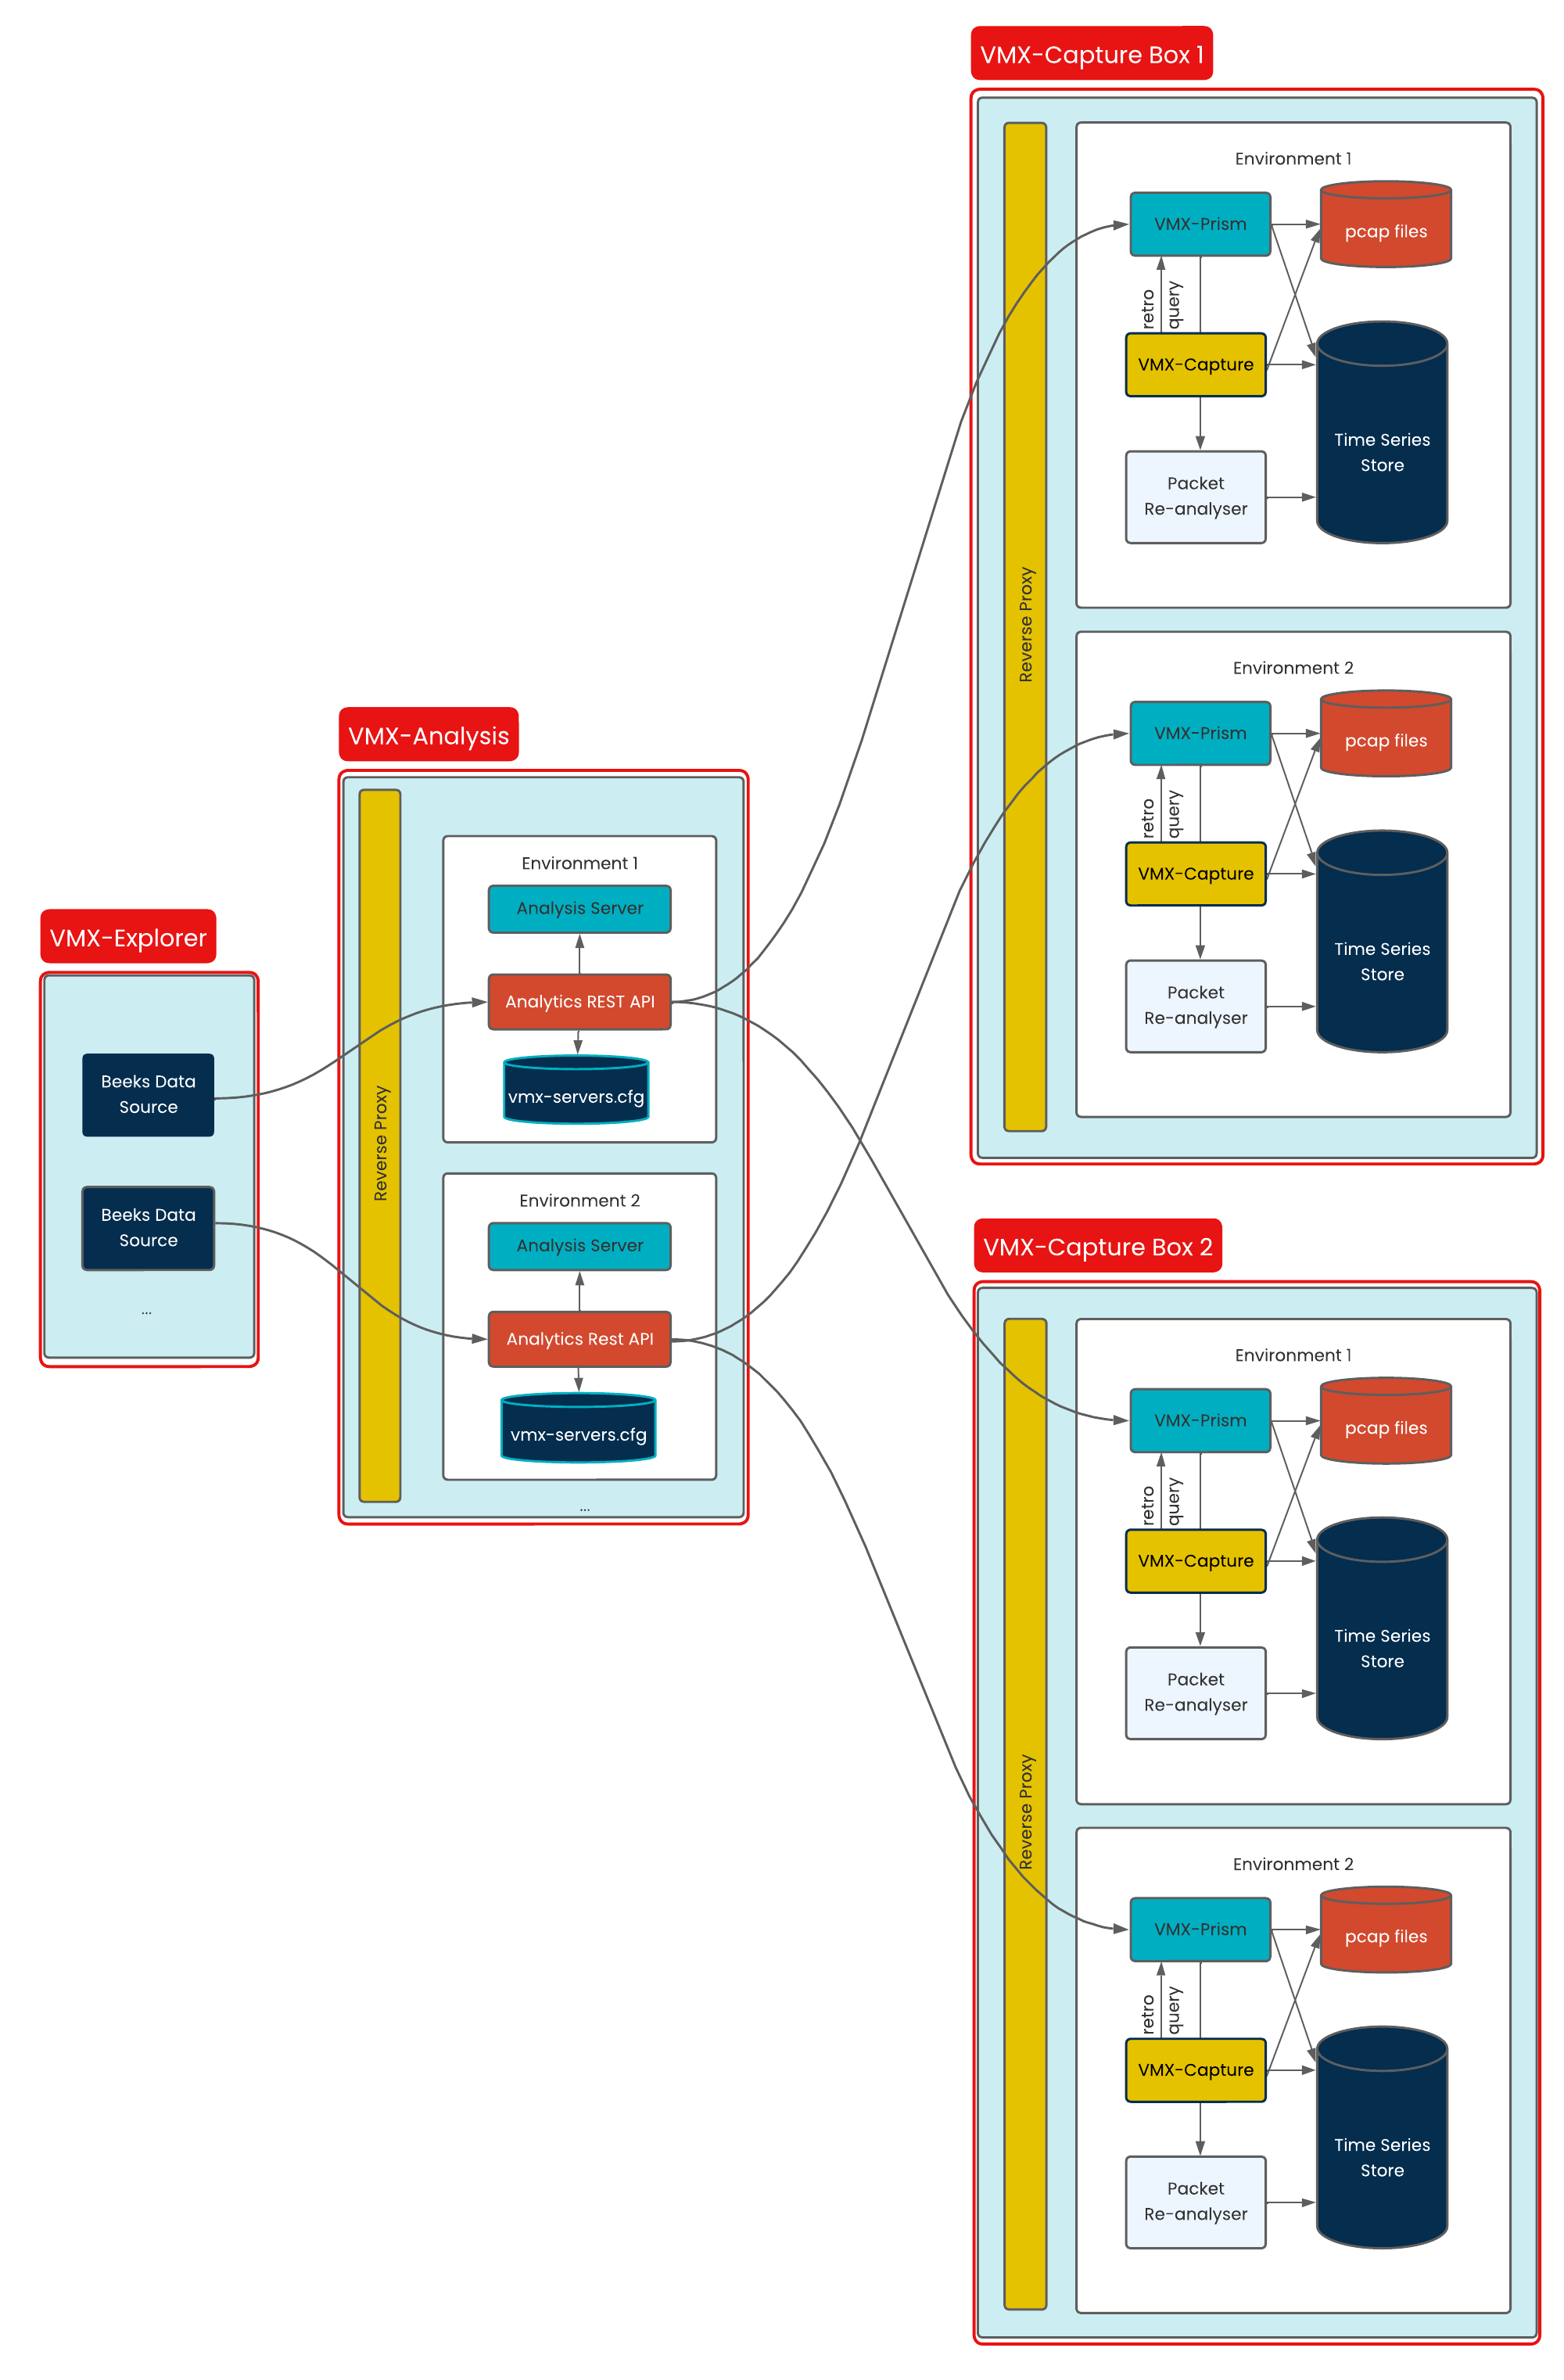
VMX-Analysis and VMX-Capture are not necessarily on different hardware in this example.
Beeks Analytics REST API Prism endpoint
The Beeks Analytics REST API includes a series of VMX-Prism calls for querying the following:
Capture Probes
Stack Probes
Stack Probe Filters
Retro Query job details
PCAP files by retro job
JSON files by retro job
JSON stats by retro job
The queries return individual or amalgamated results to the VMX-Prism dashboard in VMX-Explorer.
The REST API uses the local vmx-servers.cfg file to locate VMX-Prism instances in the distributed environment.
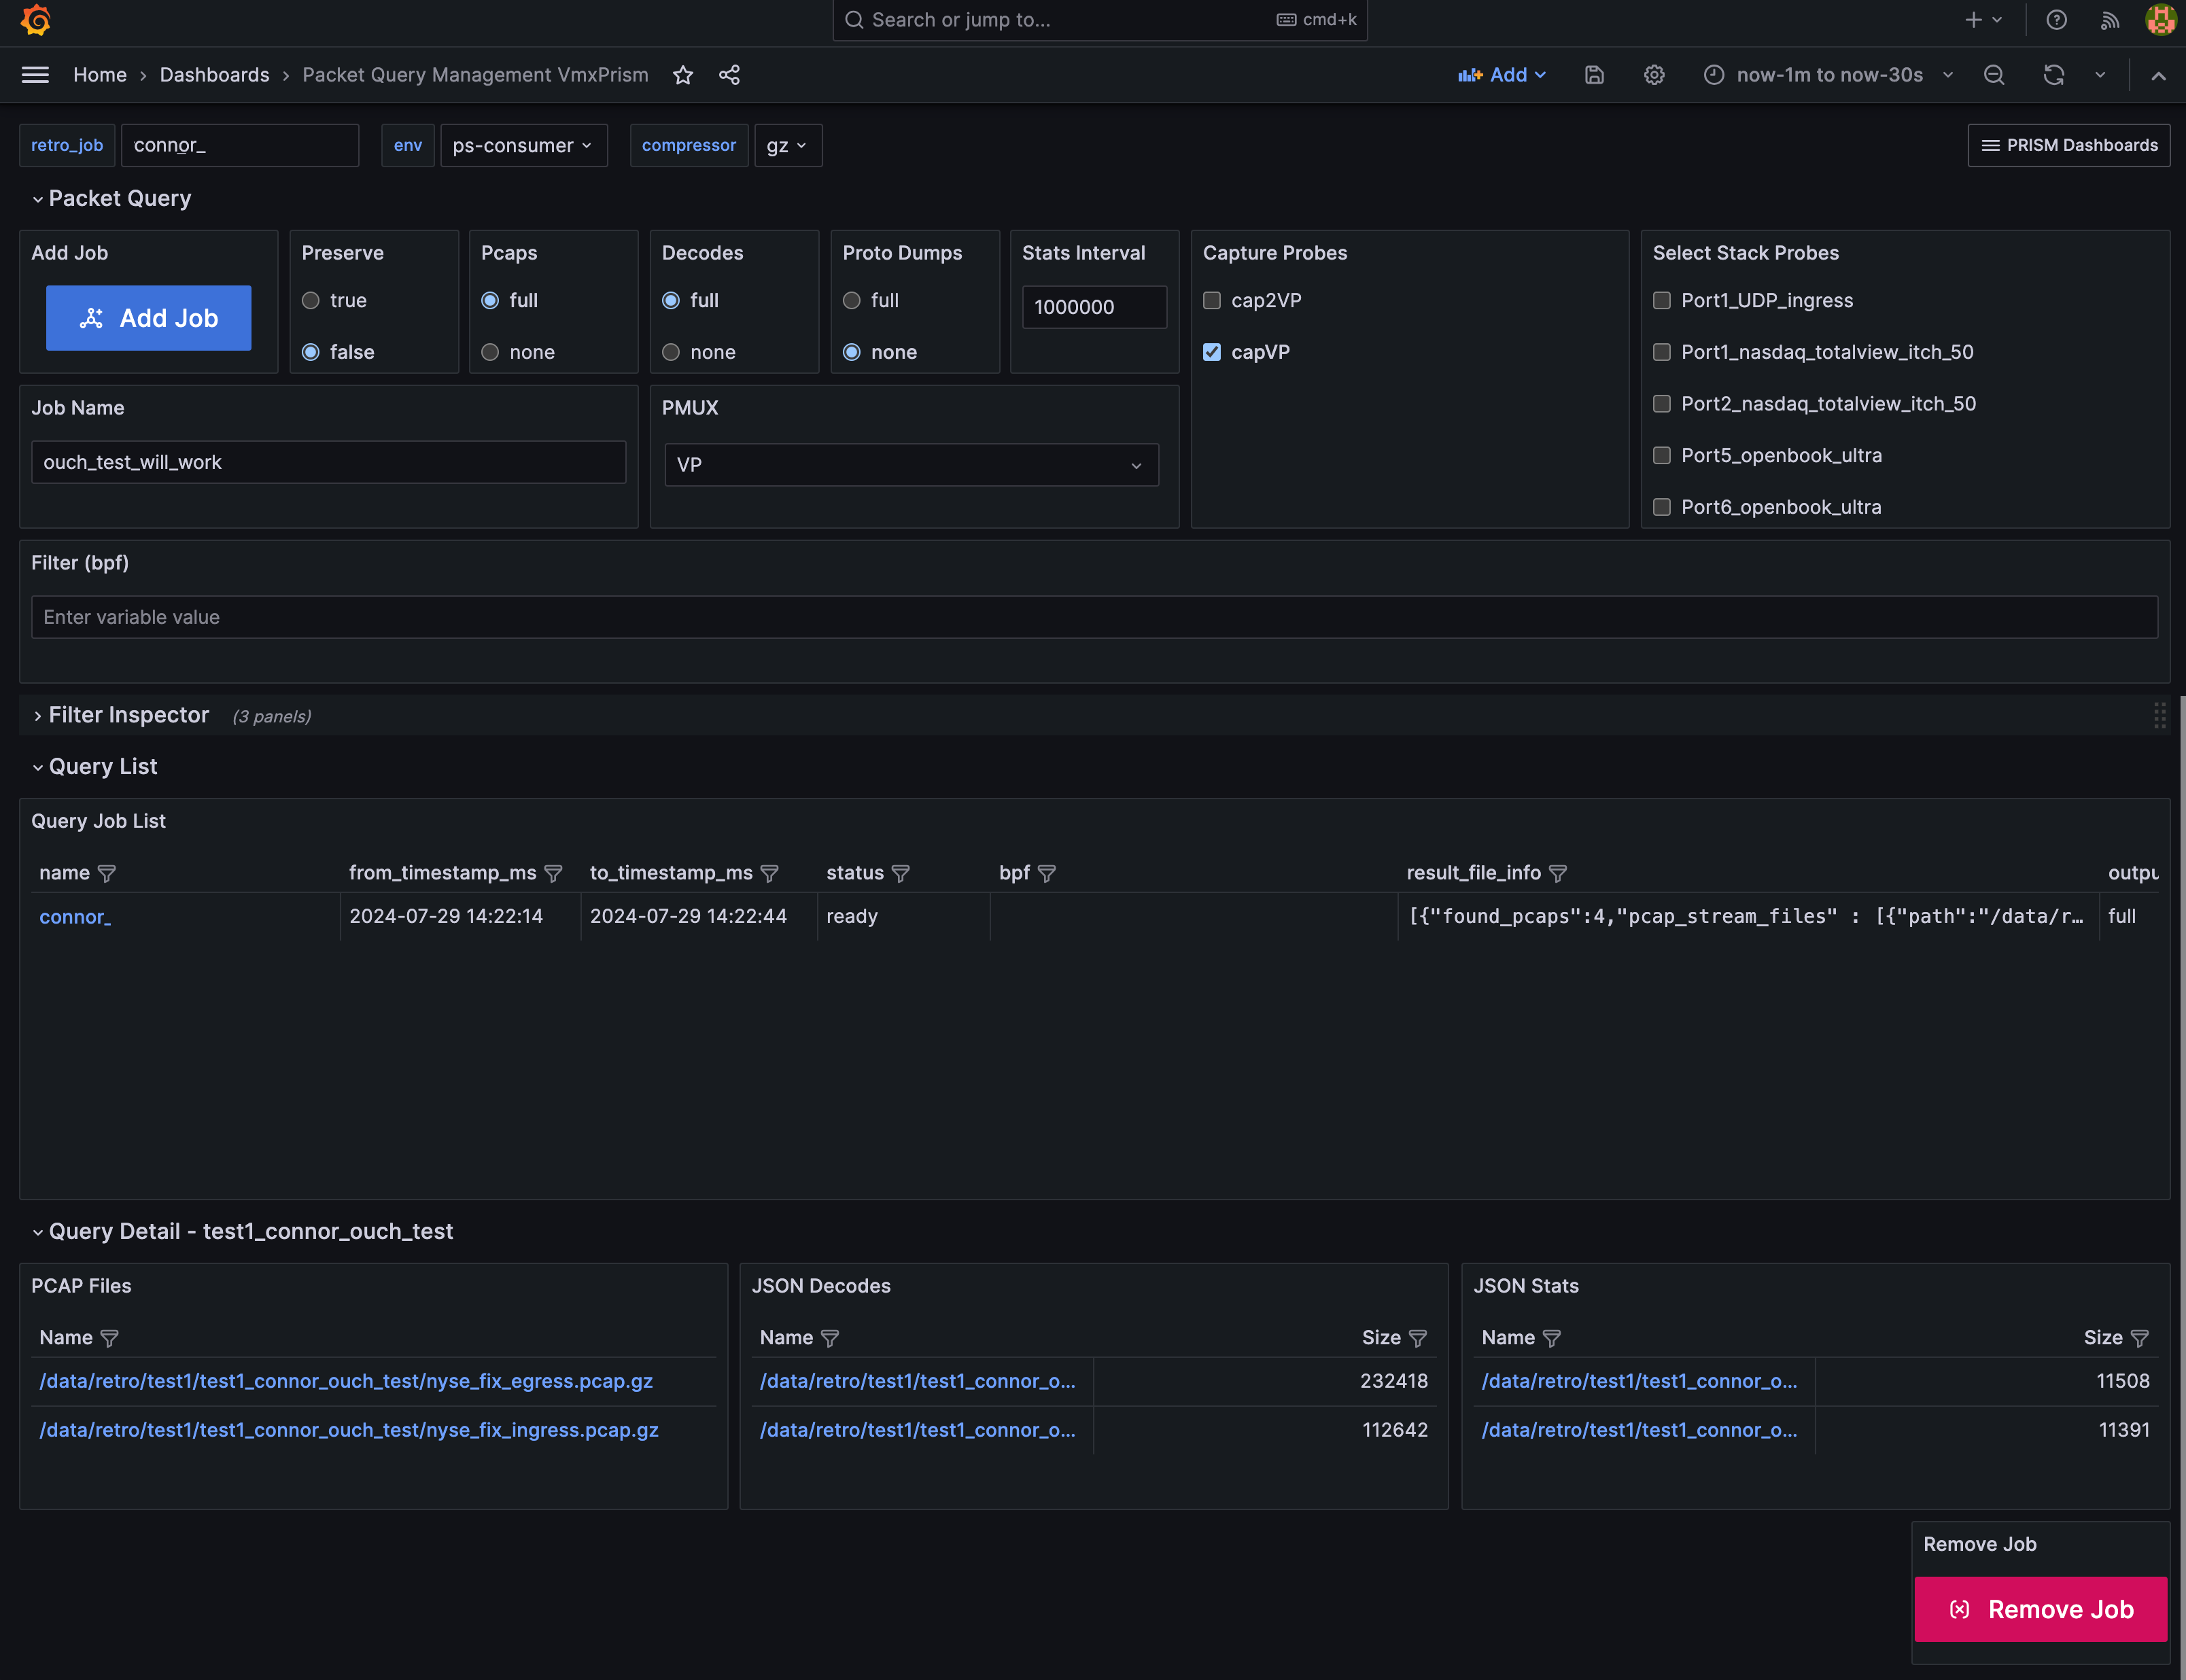
VMX-Prism dashboard
VMX-Explorer includes a standard VMX-Prism dashboard called Packet Query Management VMX-Prism, that allows you to specify the Prism instance you want to target. This dashboard requests and retrieves information via the REST API and offers:
PCAP file download.
PCAP saved query feature. Choose to persist a common query, so that you can re-run it on a new timeframe without having to re-enter the BPF filter.
JSON digest. The PCAP file can be processed through a decoder to produce a JSON digest, showing all the decoded fields of one or more protocol layers. You can use this to, for example, obtain a parseable history of FIX messages that are contained in a particular logfile.
Statistical summary of PCAP contents, including mappings and aggregations.
In order to help analyse the PCAP, the dashboard demonstrates:
how you can use the REST API to retrieve a list of PMUXs in the current environment with configuration information, and retrieve a list of Stack probes and their configuration in any given PMUX.
how to retrieve packet filter summary information from a list of Stack probes.
how to use advanced filtering including inclusive and exclusive filtering.
how to add selected stack probes and job options to a particular packet query Job.
how to construct a set of stack configurations and script to run to generate the query output.
VMX-Prism Installation
Please read this section before installing VMX-Prism.
Ensure the following are on the appropriate version. Your Beeks Contact can advise on versions if needed.
VMX-Prism dashboards
VMX-Prism dashboards are not yet included in the install process but are added via the Dashboard Provisioning app. Make sure that you use the appropriate versions of the dashboards for the installation.TipOff and VMX-Core
VMX-Prism requires both TipOff and VMX-Core to be on the latest appropriate version.Volkov plugins
The underlying Volkov plugins must be appropriate for the VMX version that’s installed.Grafana
Updates to Grafana can have an impact on VMX-Prism dashboards. Keeping up to date on versions should avoid this.
On most 13.1 builds of VMX-Prism, QuestDB will not be installed. Keep the decode option on JSON in these situations. On later builds, QuestDB will generally be installed, but will depend somewhat on systems.
Some features of VMX-Prism are only changeable by editing the underlying variable settings. This is to prevent users from accidentally changing defaults.
Specifically:compressionType : Defaults to gzip, but can be changed to alternatives such as zstd, null, etc. This setting should only be changed by an experienced user.
compressionLevel: Defaults to 4, but can be changed up or down. This setting should only be changed by an experienced user.
On multi-box solutions, it is a requirement that the Prism hostname in vmx-servers.cfg deployed on the Analysis Server matches that in the certificate deployed on the Capture Server. However, the hostname in vmx-servers.cfg deployed on the Capture Server must match the hostname as returned by uname -n (or fully qualified equivalent). It is therefore sometimes necessary to have different versions of this file on each server.
Known Issues
If a Prism job is run and there are no PCAPs in the timeframe for the job, no feedback is generated to alert the user. Instead you'll get a result with no generated PCAP, and the decodes and stats will be empty files.
In general, there is very little feedback for the user when running jobs. This is an area we have identified for improvement.
When specifying jobs, you may need to specify information such as the PMUX name, which is not readily visible. This is an area we have identified for improvement. In v14, you can specify a stack probe regex which contains the feed name, so you don’t need to know the PMUX name, but this is also on the list for improvement.