The following information applies generally to Grafana use outside of Beeks Analytics, but is useful to know if you are navigating in Grafana for the first time.
Introduction to Grafana
Grafana is an open-source monitoring and observability third-party application, which VMX-Explorer uses to display analytics. Grafana allows you to track a dataset over time and show how it changes. You can also query multiple sources and present the data as rich visualisations in a set of unified dashboards. Each dashboard contains one or more panels that each display a visualisation of the data, for example, a scattergraph, big number etc.
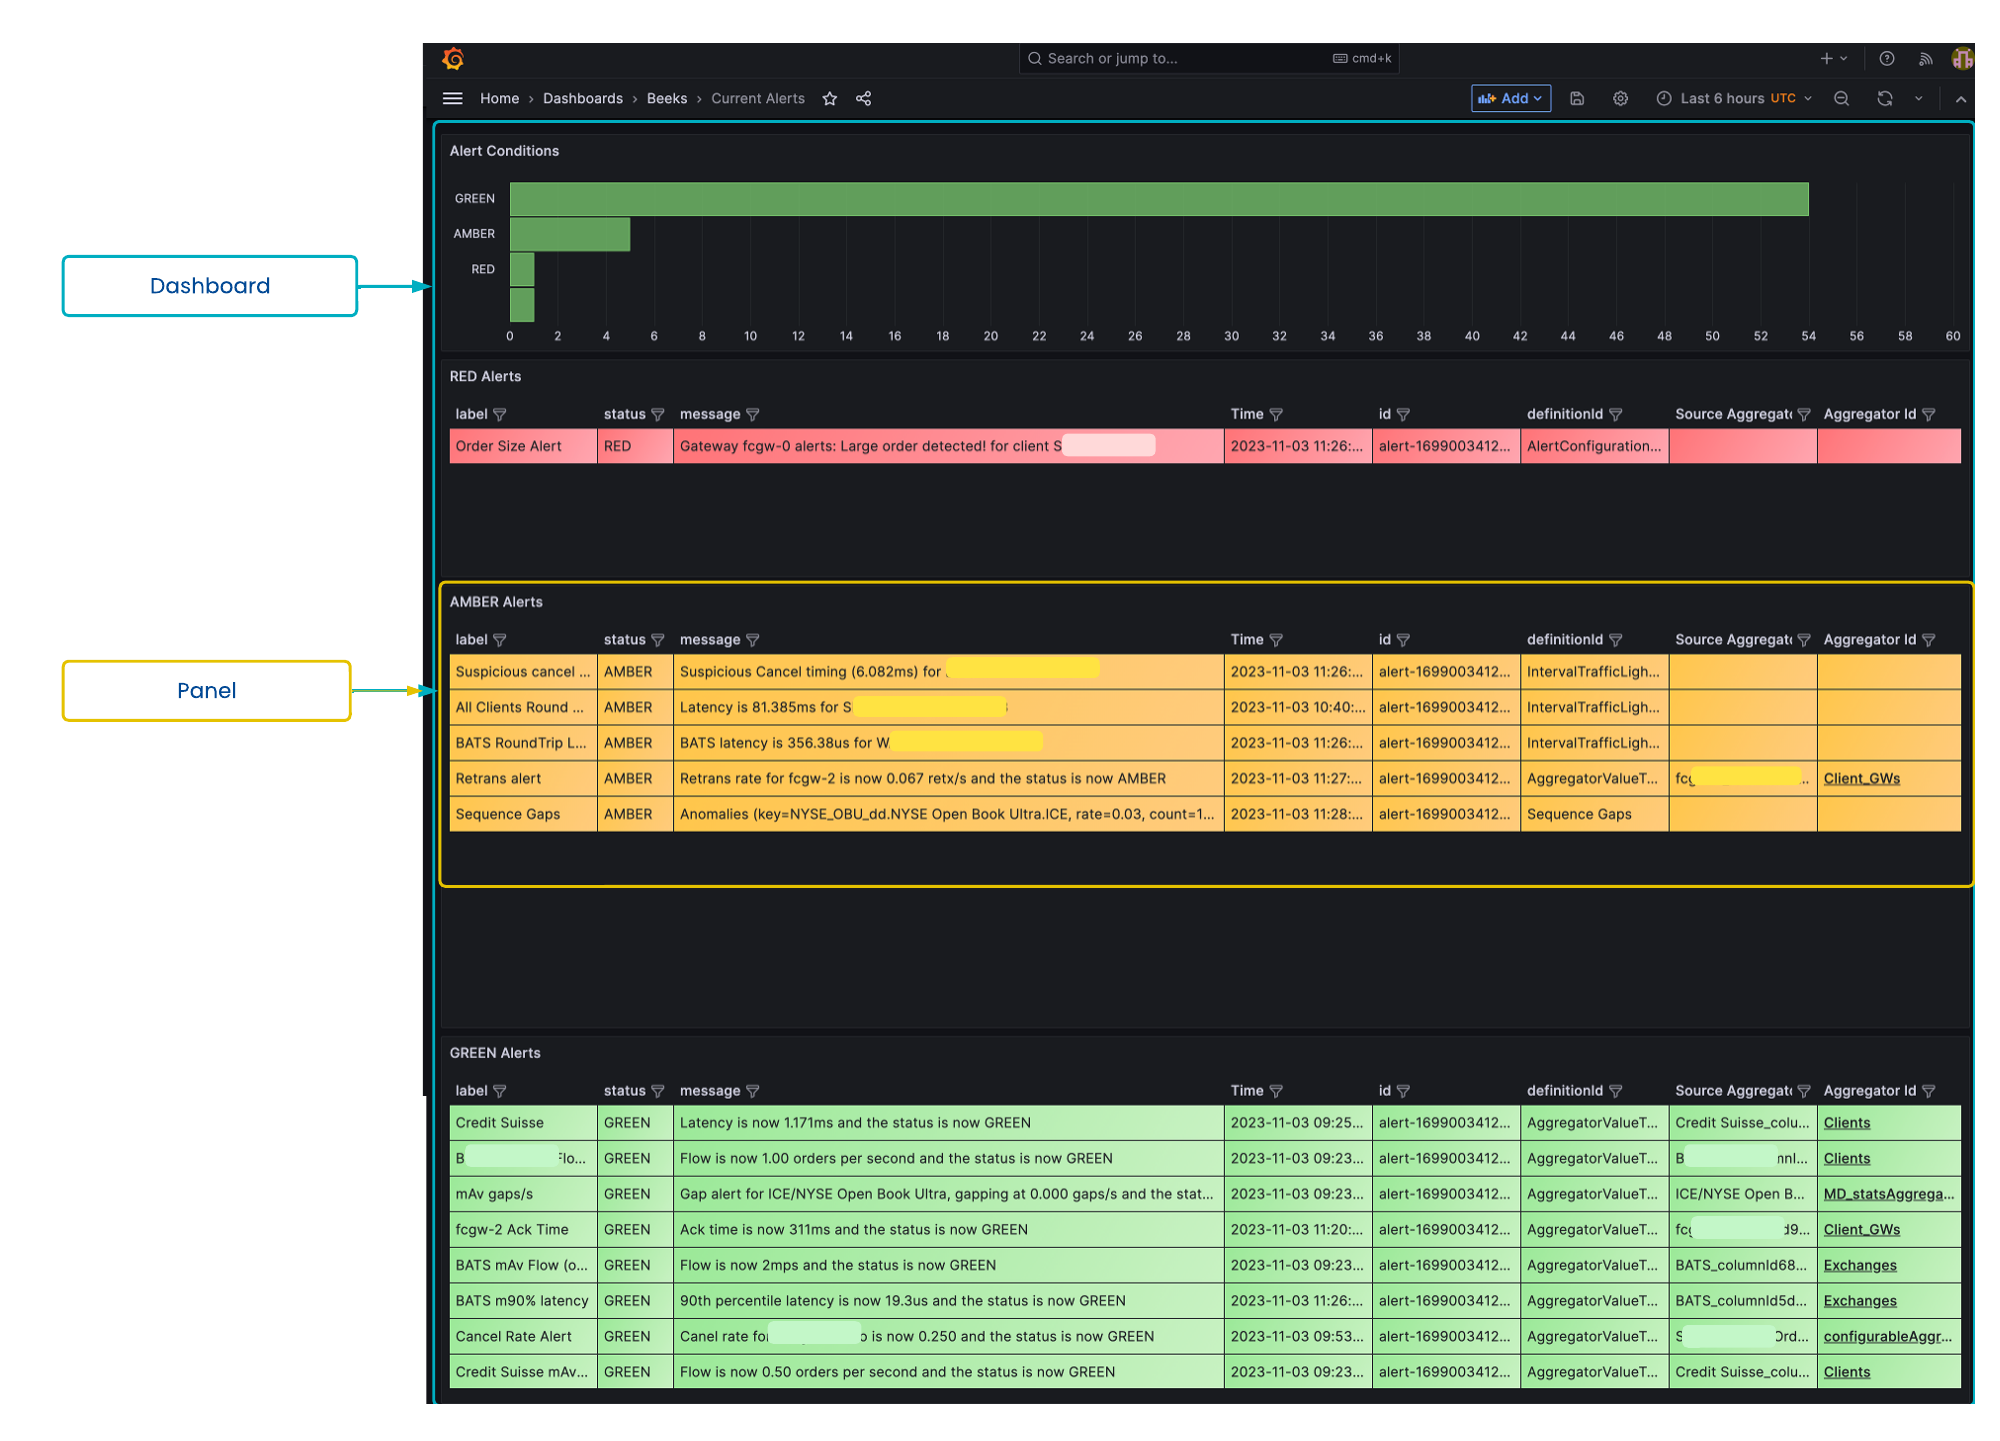
Screenshot: An Alerts dashboard in VMX-Explorer.