Home dashboard
The generic Grafana Home dashboard displays system health visualisations and provides shortcuts to the other dashboards. It also provides general guidance on learning to use Grafana.
The dashboards panel which shows starred dashboards will take you to the common dashboards referred to in this guide. However, you can navigate to these more easily using the dashboard navigation menu and Beeks dashboard folder.
Welcome to Beeks Analytics dashboard
The Welcome to Beeks Analytics dashboard provides an overview of the Beeks Analytics dashboards. In addition, the central Alerts panel provides information about the health of the Beeks Analytics appliance.
Note that some of the panels may not be populated. For example, if your Beeks Analytics system does not have any TradingGateways configured and/or no orders are being populated, the Item Trace and Trading Gateway panels will be blank.
Dashboard navigation menu
The dashboard menu can be used to explore the different dashboards that are configured on the Beeks Analytics appliance. The dashboards that we’ll be referring to in this guide can be found in the Beeks folder.
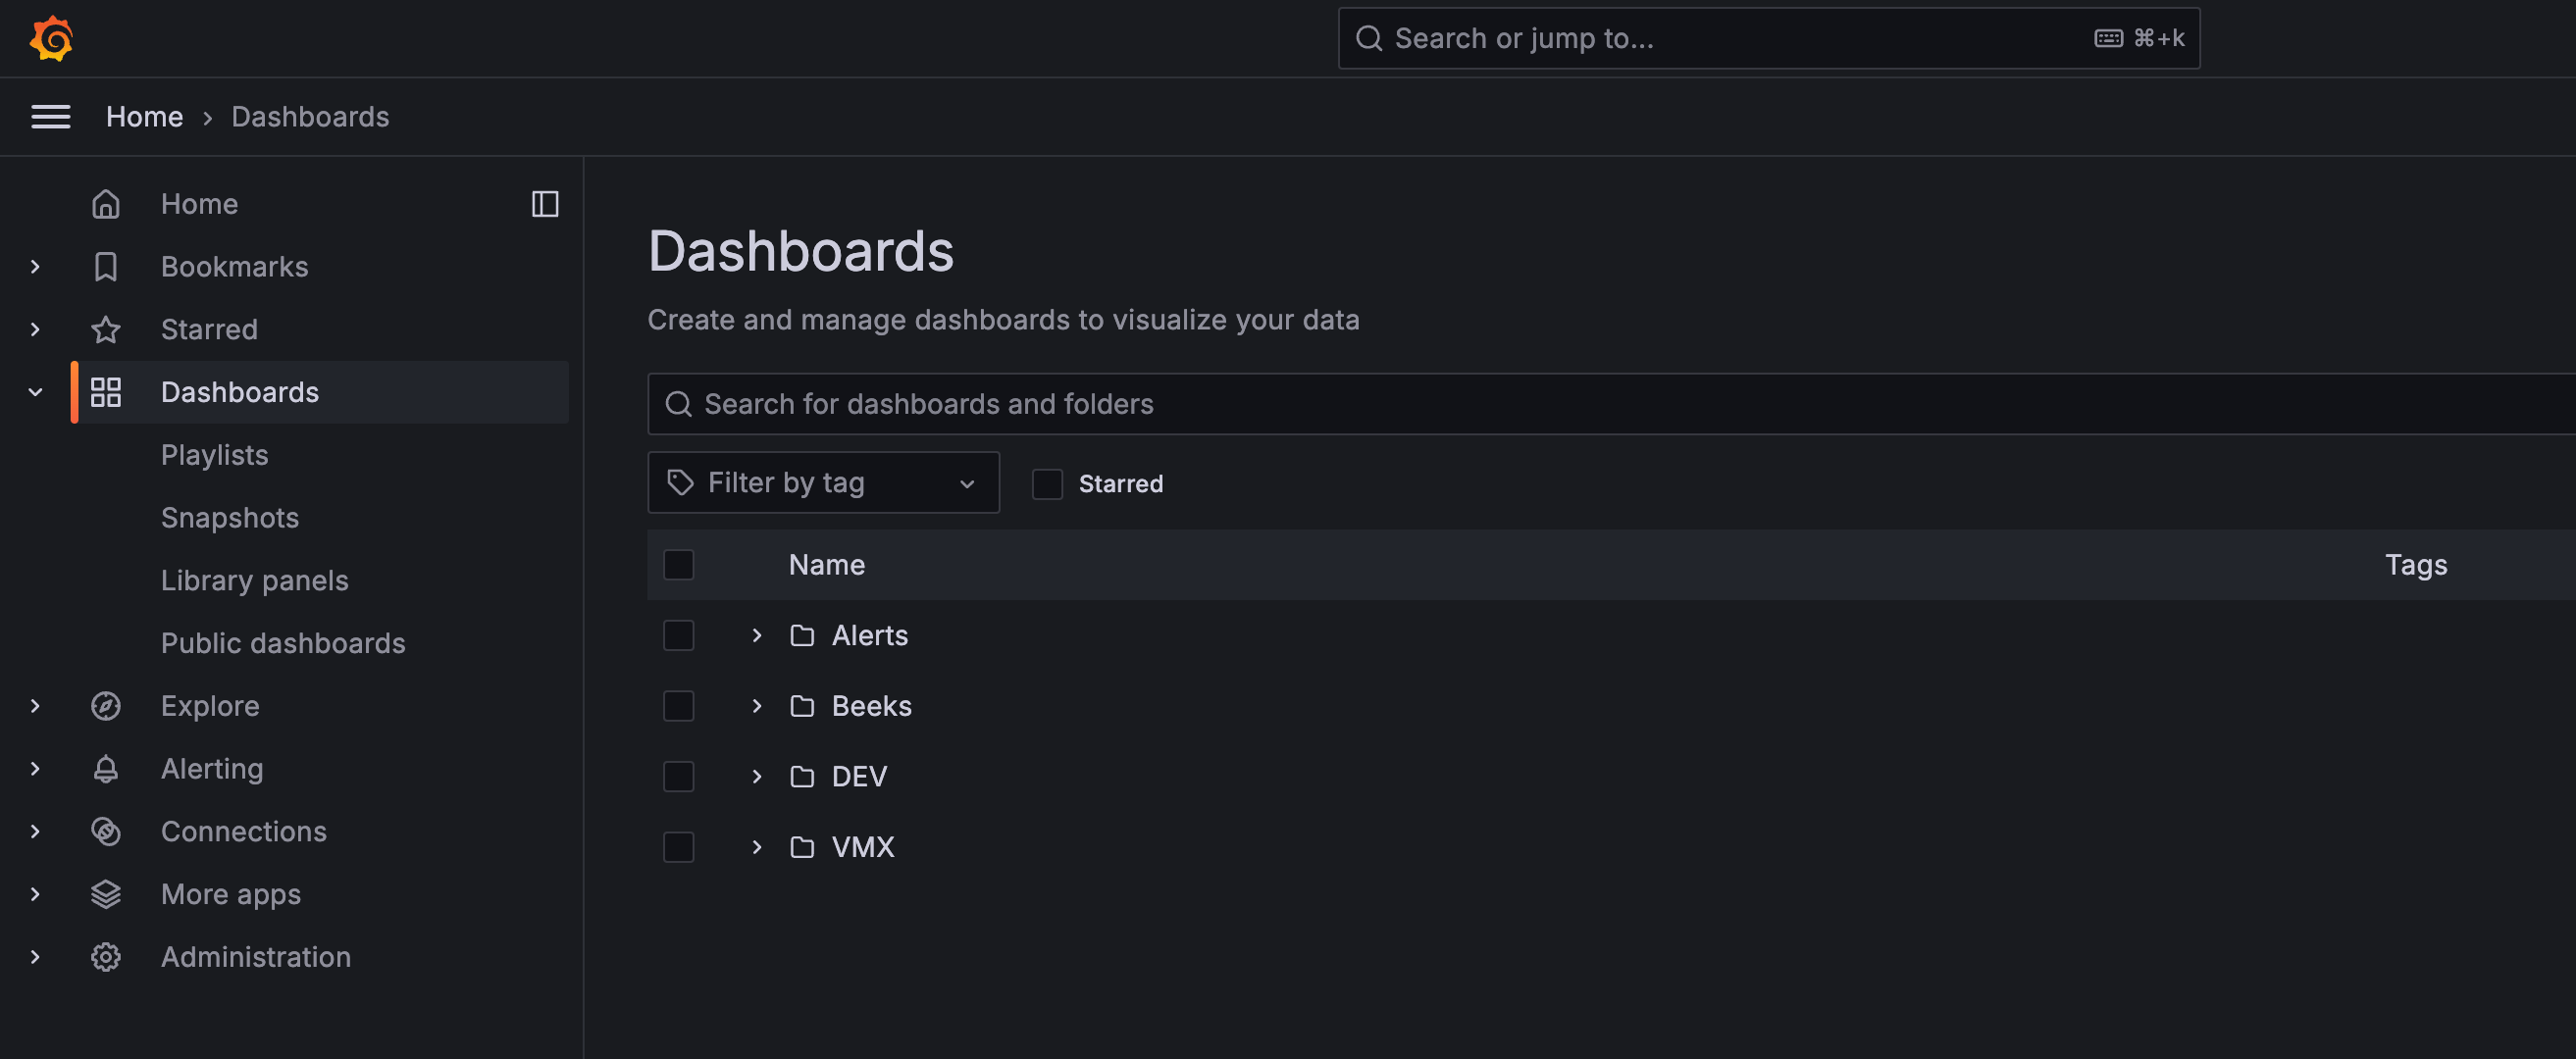
Beeks dashboard folder and tags
The Beeks dashboard folder shows the main dashboards for use by users of the Beeks Analytics appliance to explore the data captured by the appliance. The tags allows dashboards with a similar purpose to be collected together. These tags are used as part of the internal navigation between the dashboards.
Note that a dashboard can have multiple tags applied to it - so for example the Market Data Stats by VP dashboard is assigned the OOTB tag to indicate that it is a standard BAM dashboard, and the MD tag to indicate that it is a Market Data dashboard.
Tag | Type of Dashboard |
|---|---|
OOTB | This is a standard Beeks Analytics for Markets dashboard (BAM was formerly referred to as the Out-of-the-Box product). |
MD | Market Data |
TS | Traffic Stats |
OE | Order Entry |
PCAP | Packet Capture |
HEALTH | System Health |
The DEBUG tag is also used for dashboards which can be used for internal troubleshooting.
You can use the ‘Filter by Tag’ option to only disappears dashboards that match a particular tag. If you filter by multiple tags, the Dashboards that match ALL selected tags will be displayed.
Using tags to navigate between dashboards
Once you access a Beeks Analytics dashboard, you will find that there are links at the top right of each dashboard to take you to other dashboards. These are grouped by tag. There is also a search function if you find it easiest to search for a dashboard by name.
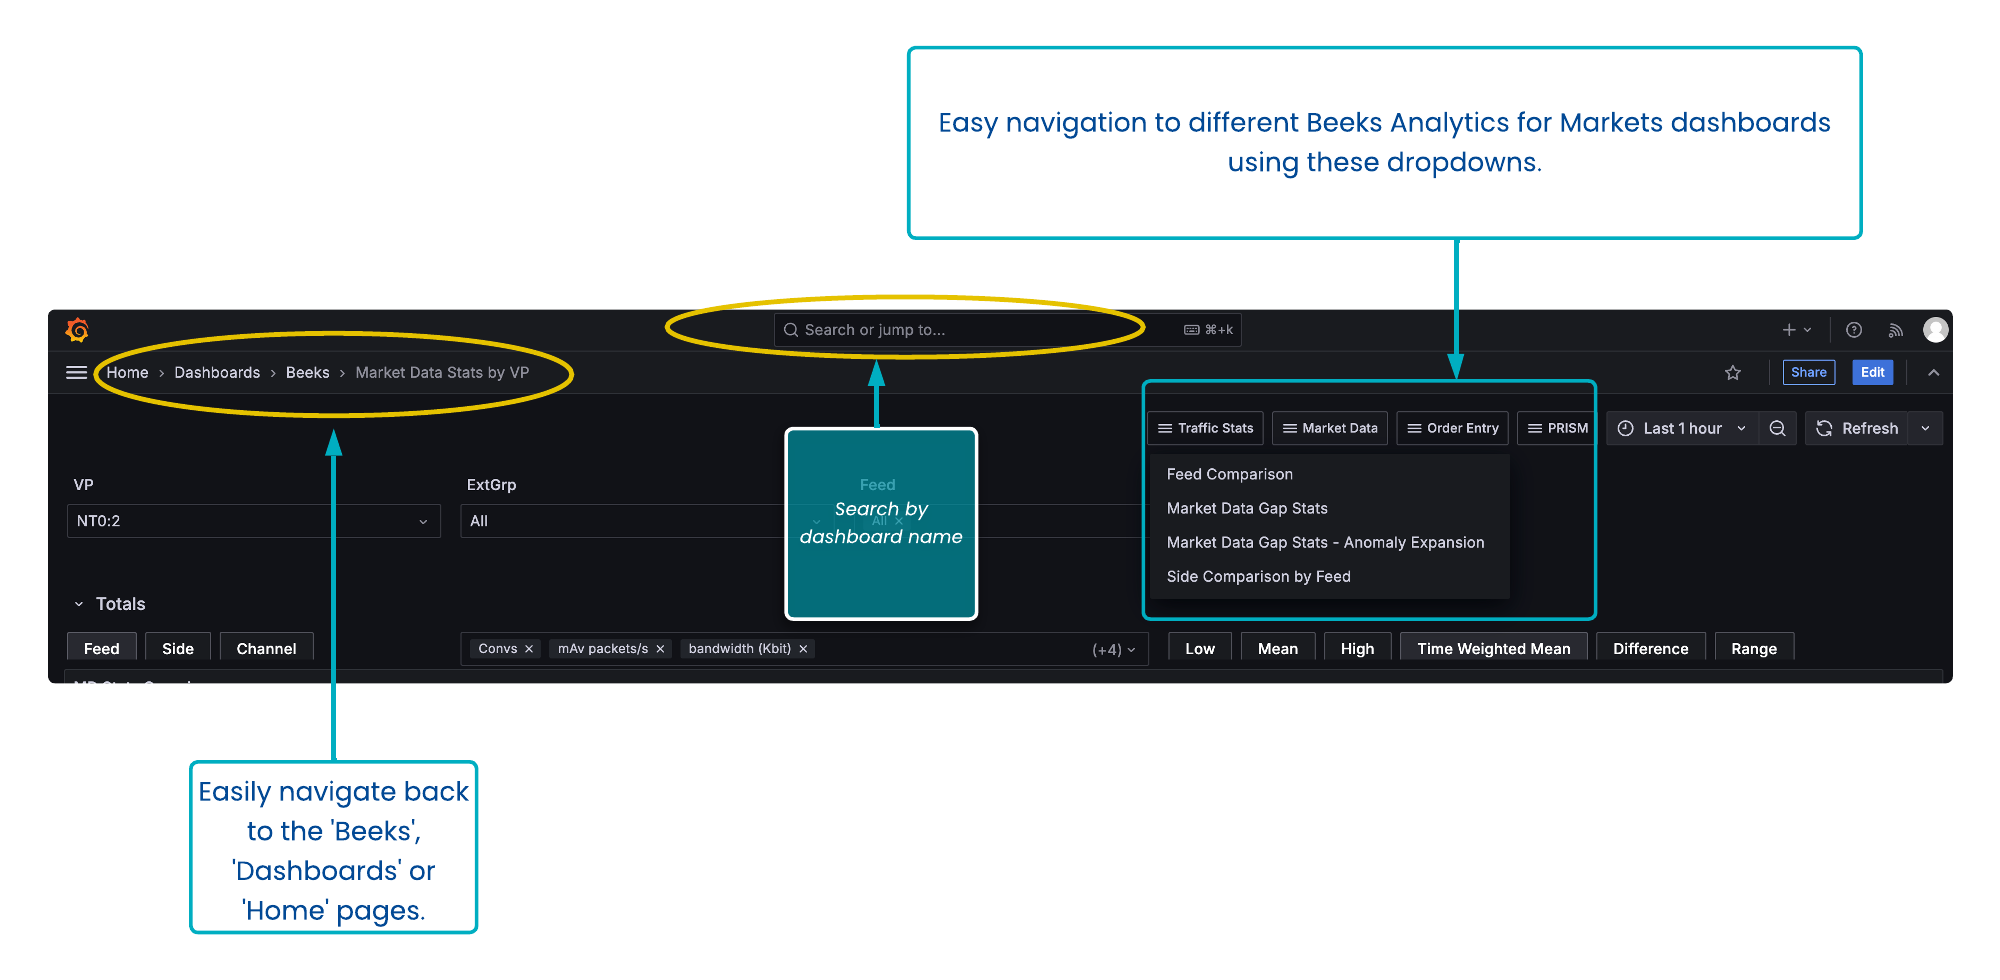
The advantage of using the top-right dropdown links to navigate between dashboards is that the time period of your current dashboard is maintained on the new dashboard.
If you select a different dashboard using Search or the top-left folder navigation, a new default time period will be applied to the new dashboard.