This dashboard shows the TCP statistics by gateway.
Usage instructions
The user can switch between Visibility Points and select the set of ExtGroup’s and Gateway’s to view.
In the visualisations, you can switch between Gateway and Session views.
You can also switch between Low, Mean, High, Time Weighted Mean, Difference and Range to view different aspects of the data.
Panel overview
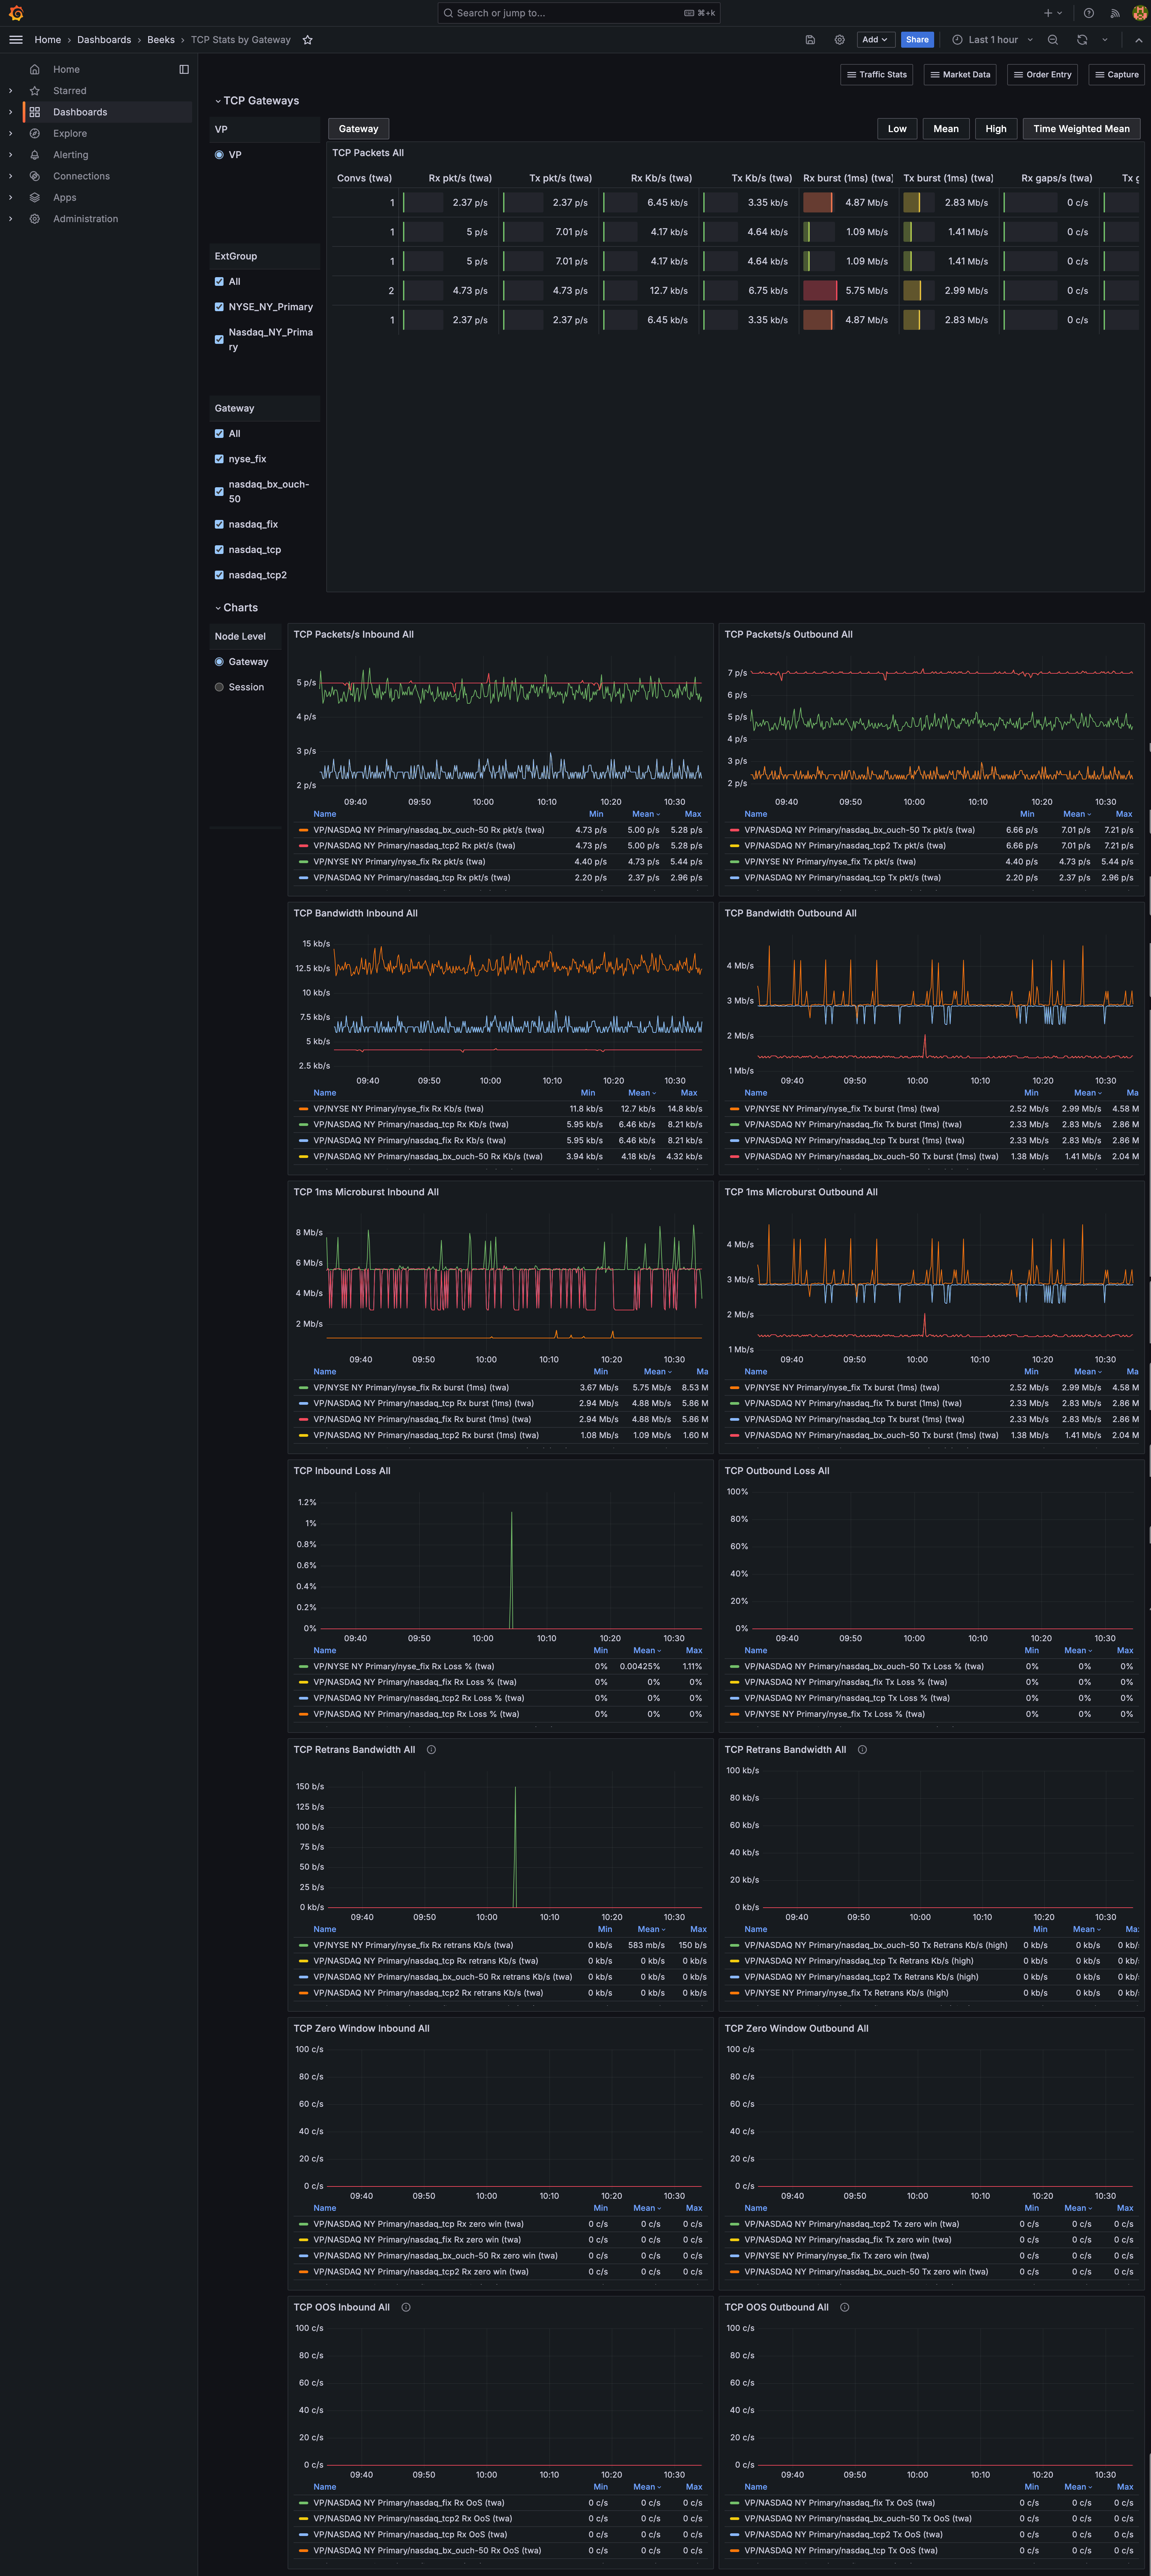
The TCP Gateways panel is:
TCP Packets All
The Charts panels are:
TCP Packets per second Inbound All
TCP Packets per second Outbound All
TCP Bandwidth Inbound All
TCP Bandwidth Outbound All
TCP 1ms MicroBurst Inbound All
TCP 1ms MicroBurst Outbound All
TCP Inbound Loss All
TCP Outbound Loss All
TCP Retrans Bandwidth All
TCP Retrans Bandwidth All
TCP Zero Window Inbound All
TCP Zero Window Outbound All
TCP OOS Inbound All
TCP OOO Outbound All
Use case: View network level statistics for a Trading Gateway
You want to view network level stats for a specific Trading Gateway in order to troubleshoot issues with a specific Exchange.
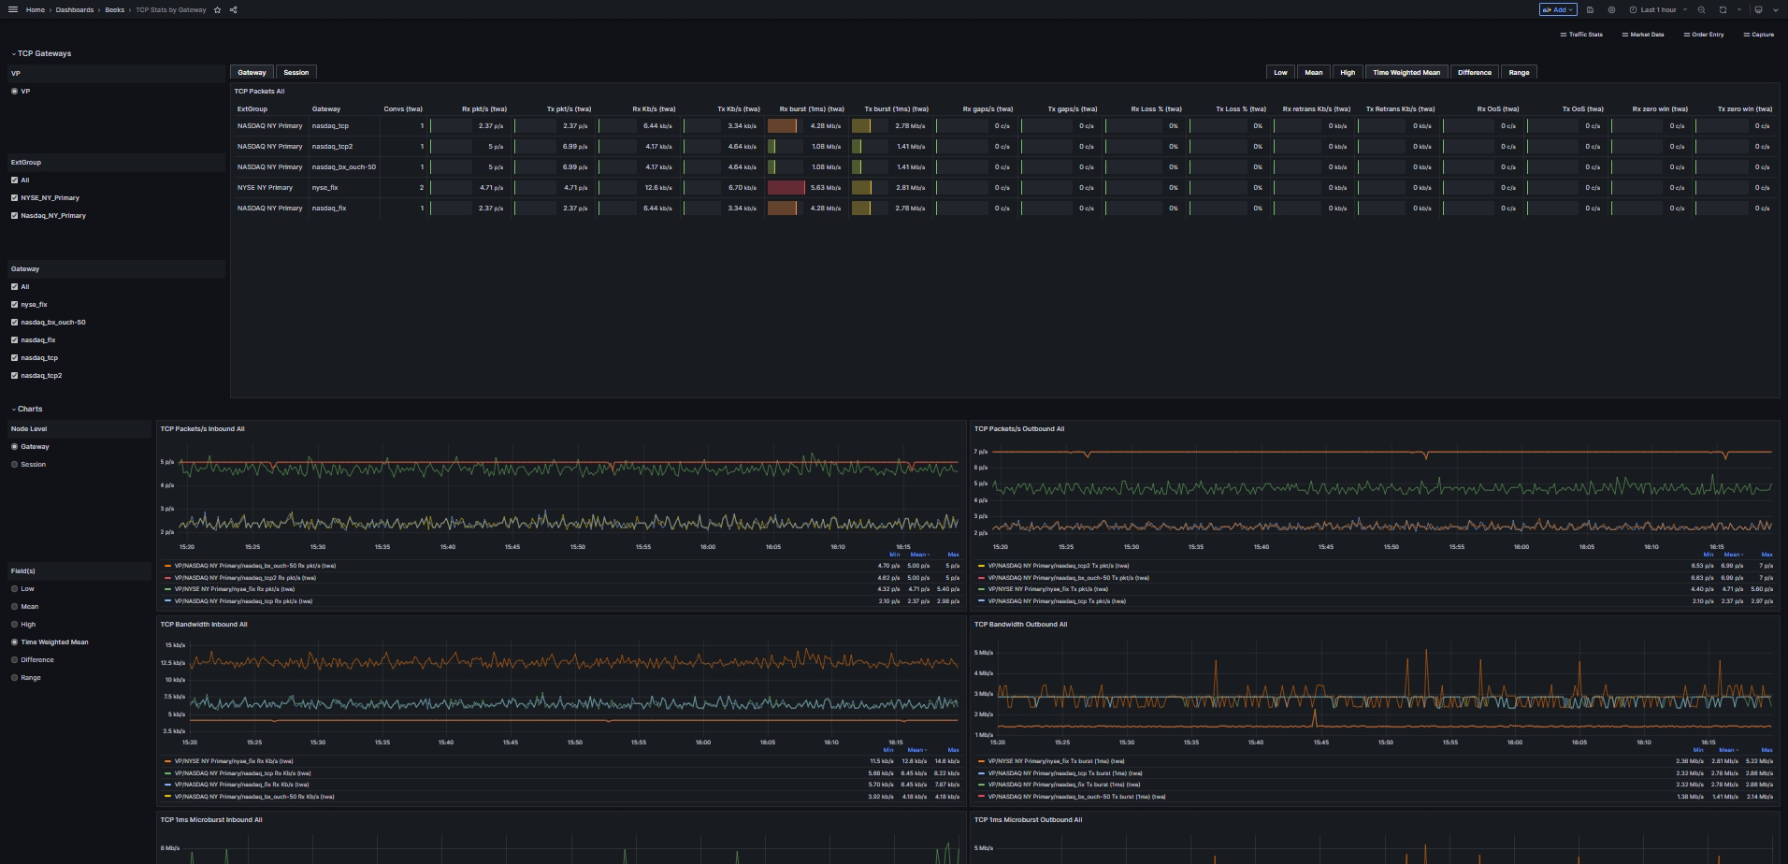
The dashboard is split out by Visibility Point (VP) and External Group (extgroup_id), which are selectable variables at the top of the dashboard (1).
The first panel (2) shows a table with all Trading Gateways/Line’s for the selected VP/ExtGroup combination, detailing overall stats for the selected timeframe:
Conversations
Inbound/Outbound Packet Rate
Inbound/Outbound Bandwidth
Inbound/Outbound Loss %
Inbound/Outbound Gaps.
Below this, there are 6 Timeseries panels (3):
Inbound/Outbound Packet Rate
Inbound/Outbound Loss %
Inbound/Outbound Out Of Sequence messages.