The Order Entry Item Trace dashboard allows you to trace Items.
Usage Instructions
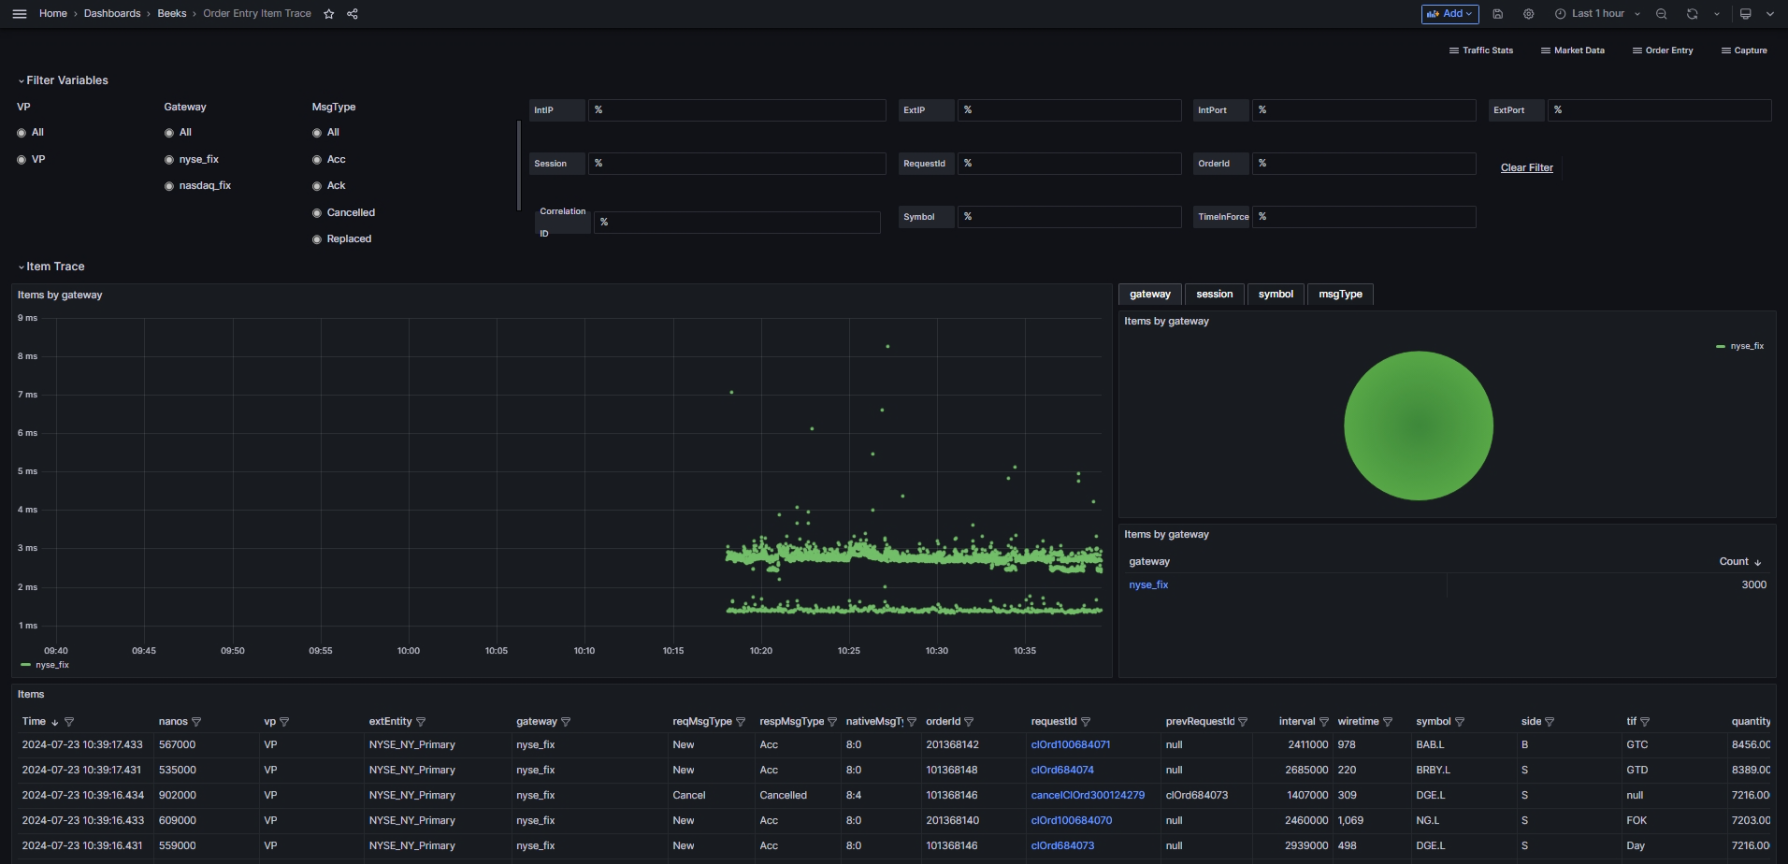
Choose your filters in the Filter Variables panels.
Panel overview
The Filter Variables panels enable you to configure the following variables:
Visibility Point
Gateway
MsgType
IntIP
ExtIP
IntPort
ExtPort
Session
RequestID
OrderID
Correlation ID
Symbol
TimeInForce
The Item Trace panels are:
Items by Gateway/Session/Symbol/Message Type
Items (table)
The Selected and Related Items panels are:
Message Events
Intervals
Item Trace
Use case: Perform in-depth tracking of Orders
You want to perform in-depth message tracking or to answer specific Order Query-related issues.
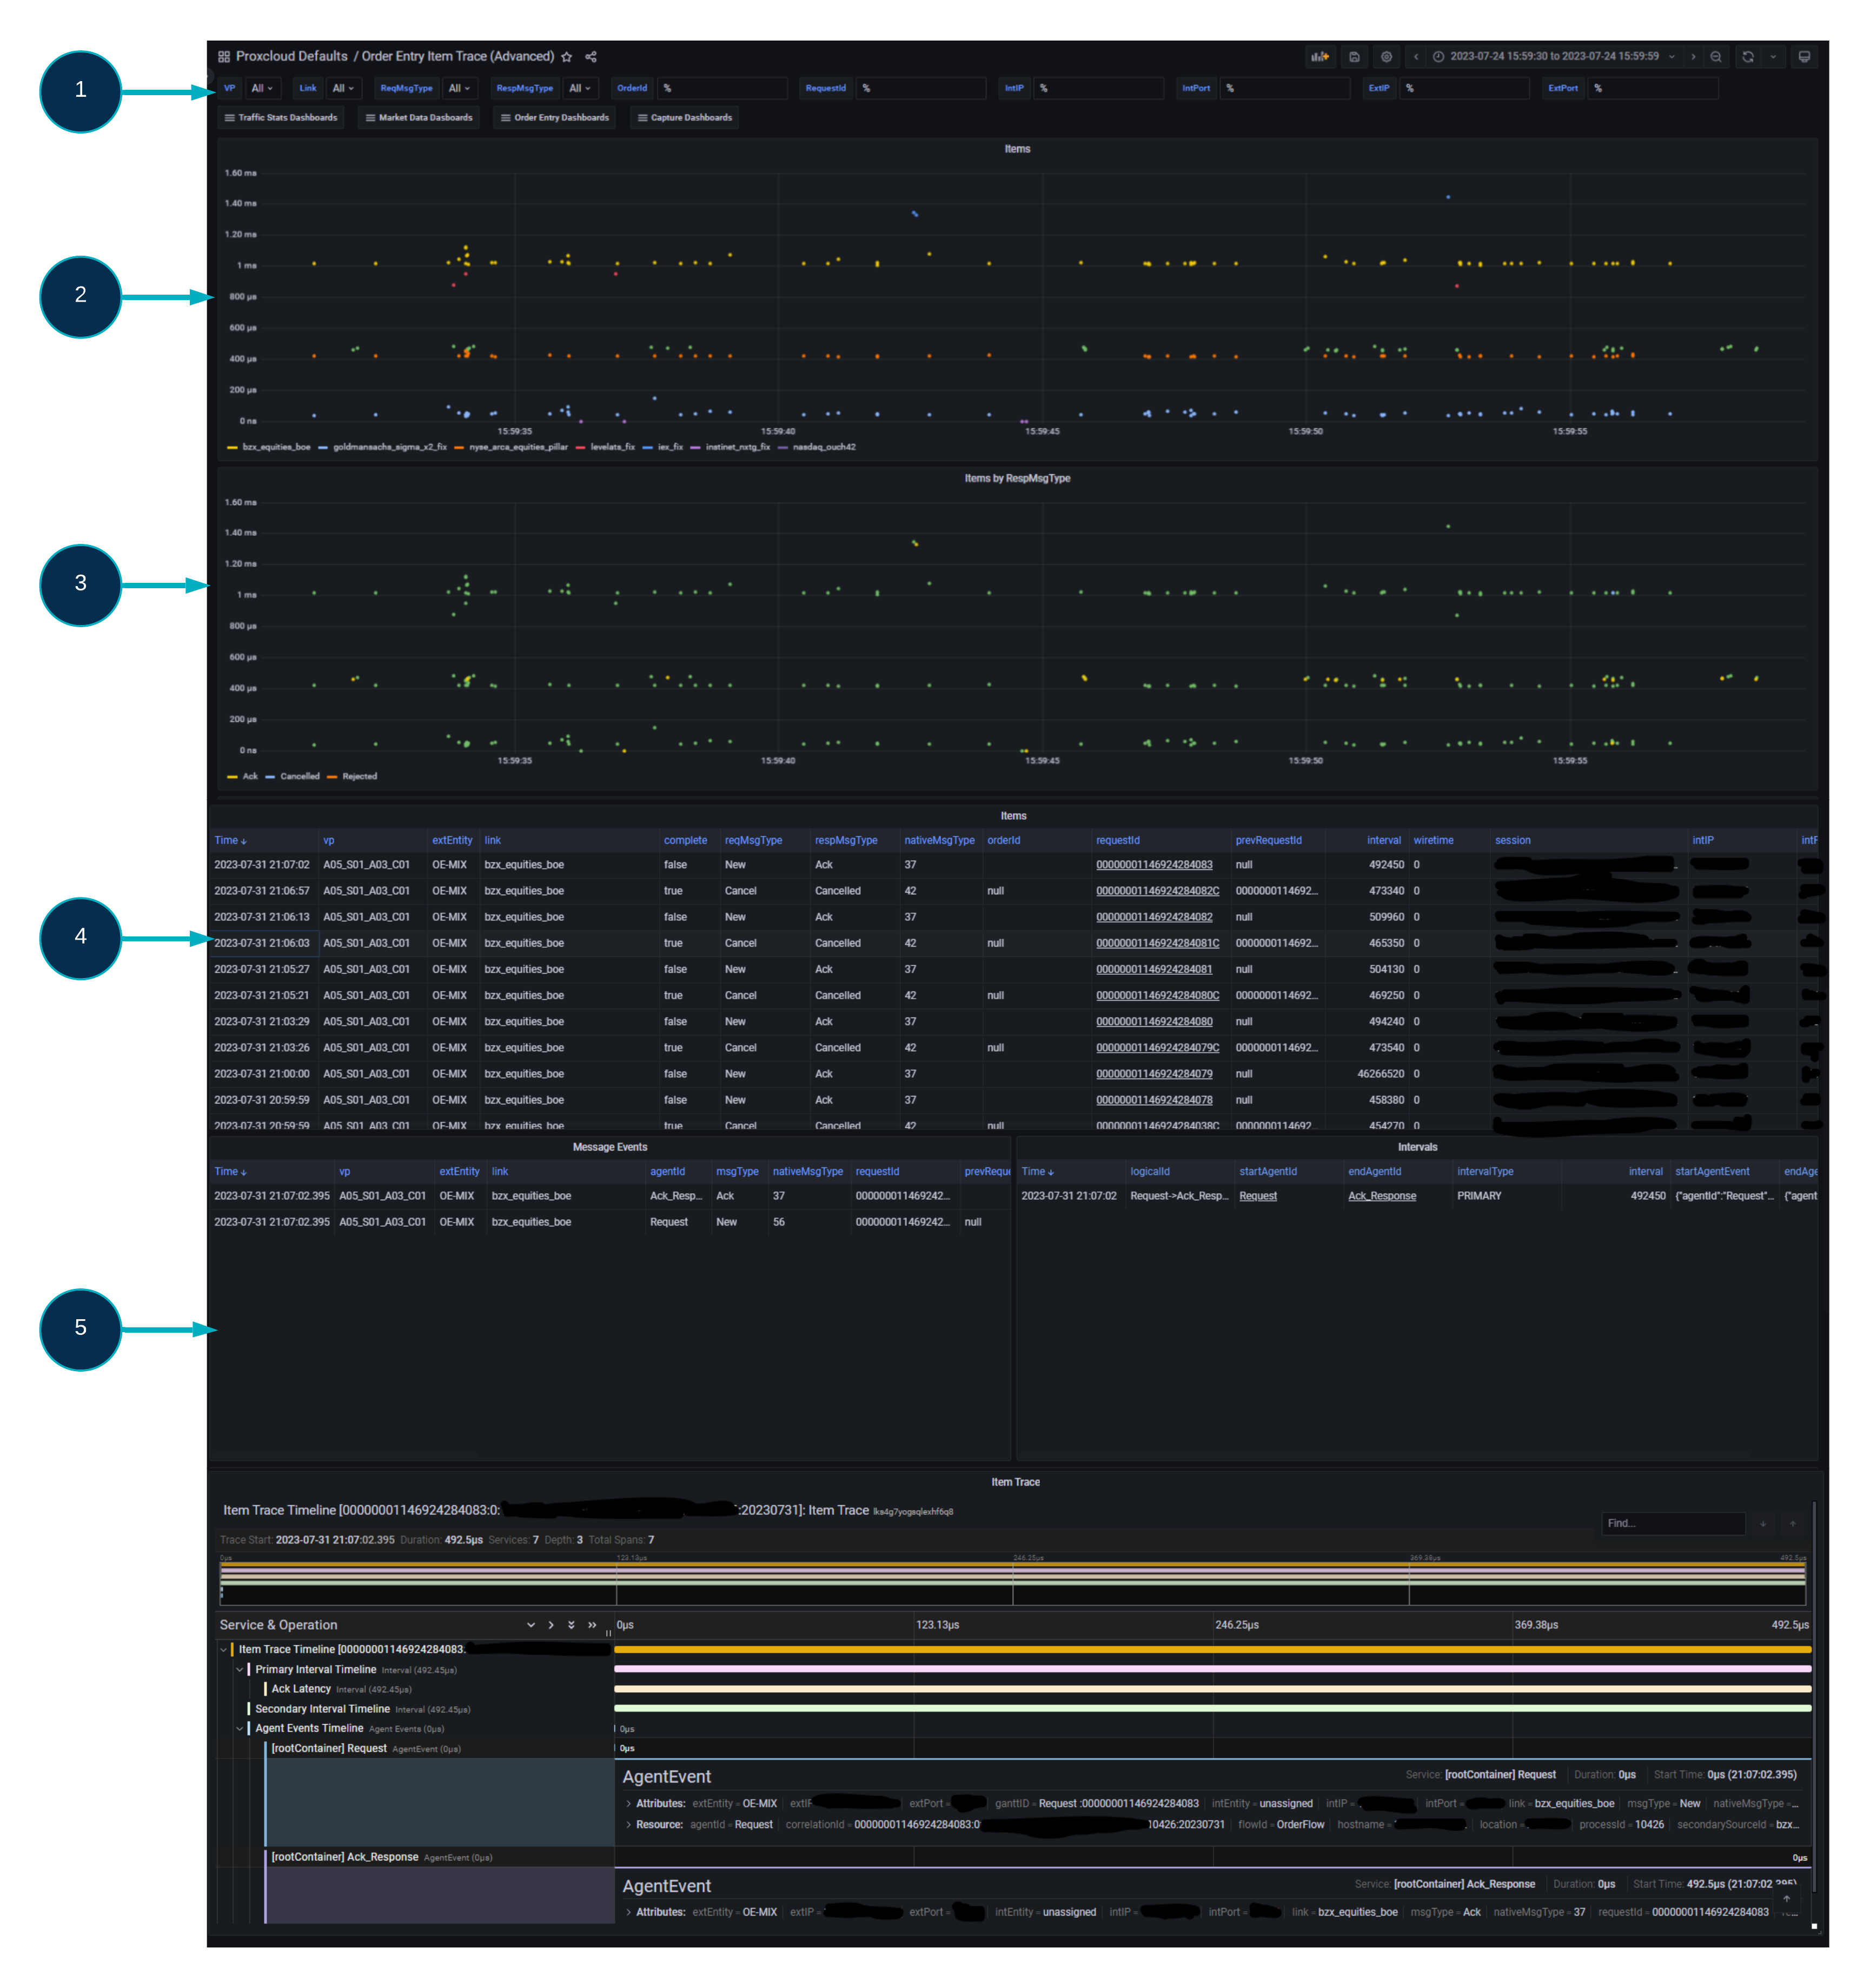
At the top of the dashboard, there are a series of selectable variables (1) which allow you to filter the large amounts of Order Traffic into a more manageable query.
The VP and Line/Gateway variables allows the user to filter to a specific Visibility Point and/or Trading Gateway.
Thee following variables are related to the item itself:
ReqMsgType
RespMsgType
OrderID
RequestID
Symbol
TimeInForce
IntIP
IntPort
ExtIP
ExtPort.
All text box variables are defaulted to “%” value, which is a wildcard, which will match all results for this given variable.
The top panel (2) shows a scatter graph of all Orders within the selected timeframe, broken out by Trading Gateway/Line.
The next panel (3) also shows a scatter graph of all orders within the selected timeframe, however the items are broken out by MsgType as opposed to Trading Gateway.
The third panel (4) is a table of all orders shown within the first two panels, with full item details. The requestID field in this table contains data links which when clicked will populate the 3 panels below.
Upon selecting a relevant item from the Items Table (4), by clicking a requestID data link, the next 3 panels (5) will populate:
Message Events shows the details for the individual agent events within an Order (Requests and Responses).
Intervals details each individual interval that was recorded during transmission between Agent points, within the Order Flow.
Item Trace provides a Gantt style breakdown of the entire Order Flow with each of the above elements included (Events and Intervals).