Home dashboard
Once you’ve logged in, the first page you’ll see is a generic Grafana Home dashboard. This displays system health visualisations, provides shortcuts to the other dashboards, and contains general guidance for using Grafana.
Viewing your dashboards
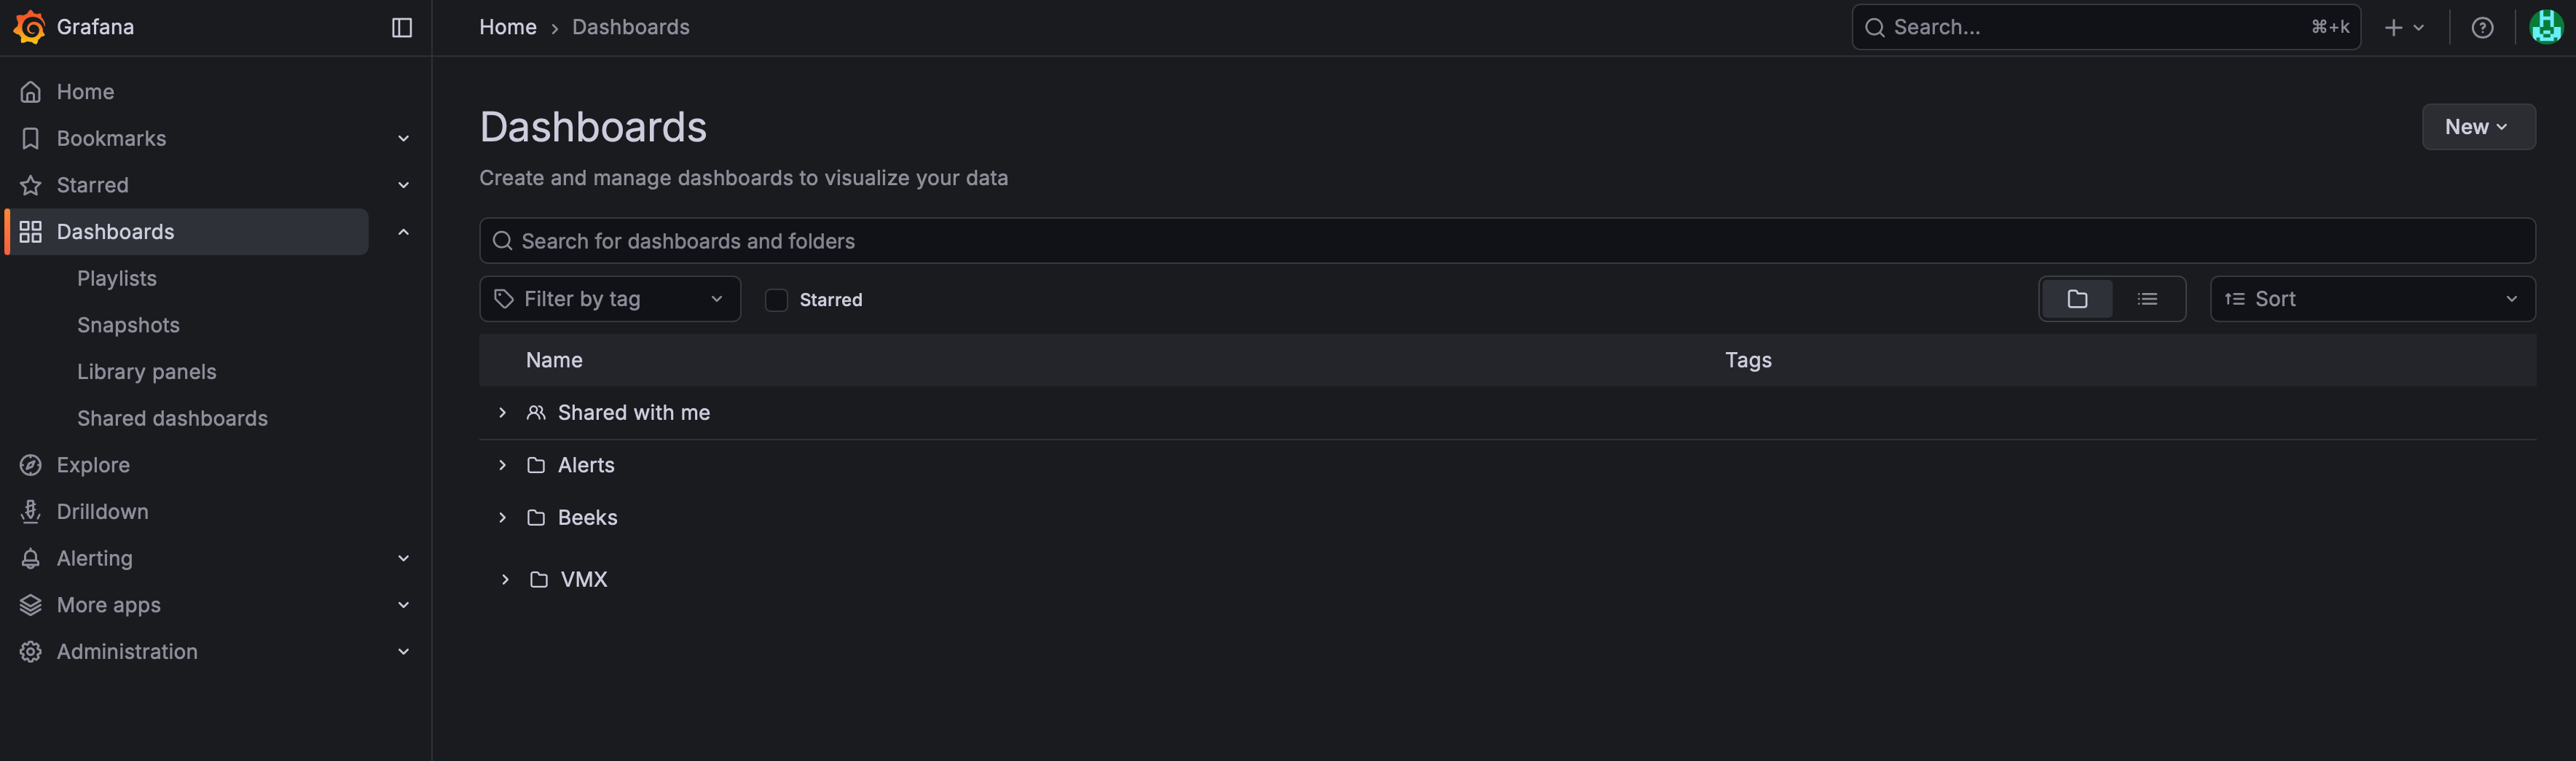
To open a dashboard, select Dashboards in the left-hand navigation menu to open a list of the dashboards you’ve starred and a set of folders.
The dashboards that we’ll be referring to in this guide can be found in the Beeks folder. Select it to view the list of BAM dashboards that are currently available for use.
Welcome to Beeks Analytics dashboard
The Welcome to Beeks Analytics dashboard provides an overview of the Beeks Analytics dashboards. In addition, the central Alerts panel provides information about the health of the Beeks Analytics appliance.
Note that some of the panels may not be populated. For example, if your Beeks Analytics system does not have any Trading Gateways configured and/or no orders are being populated, the Item Trace and Trading Gateway panels will be blank.
Tags
With the exception of the Welcome to Beeks Analytics dashboard, all BAM dashboards have tags assigned. Tags allow us to group dashboards, and you can Filter by tag to list all the dashboards in the group.
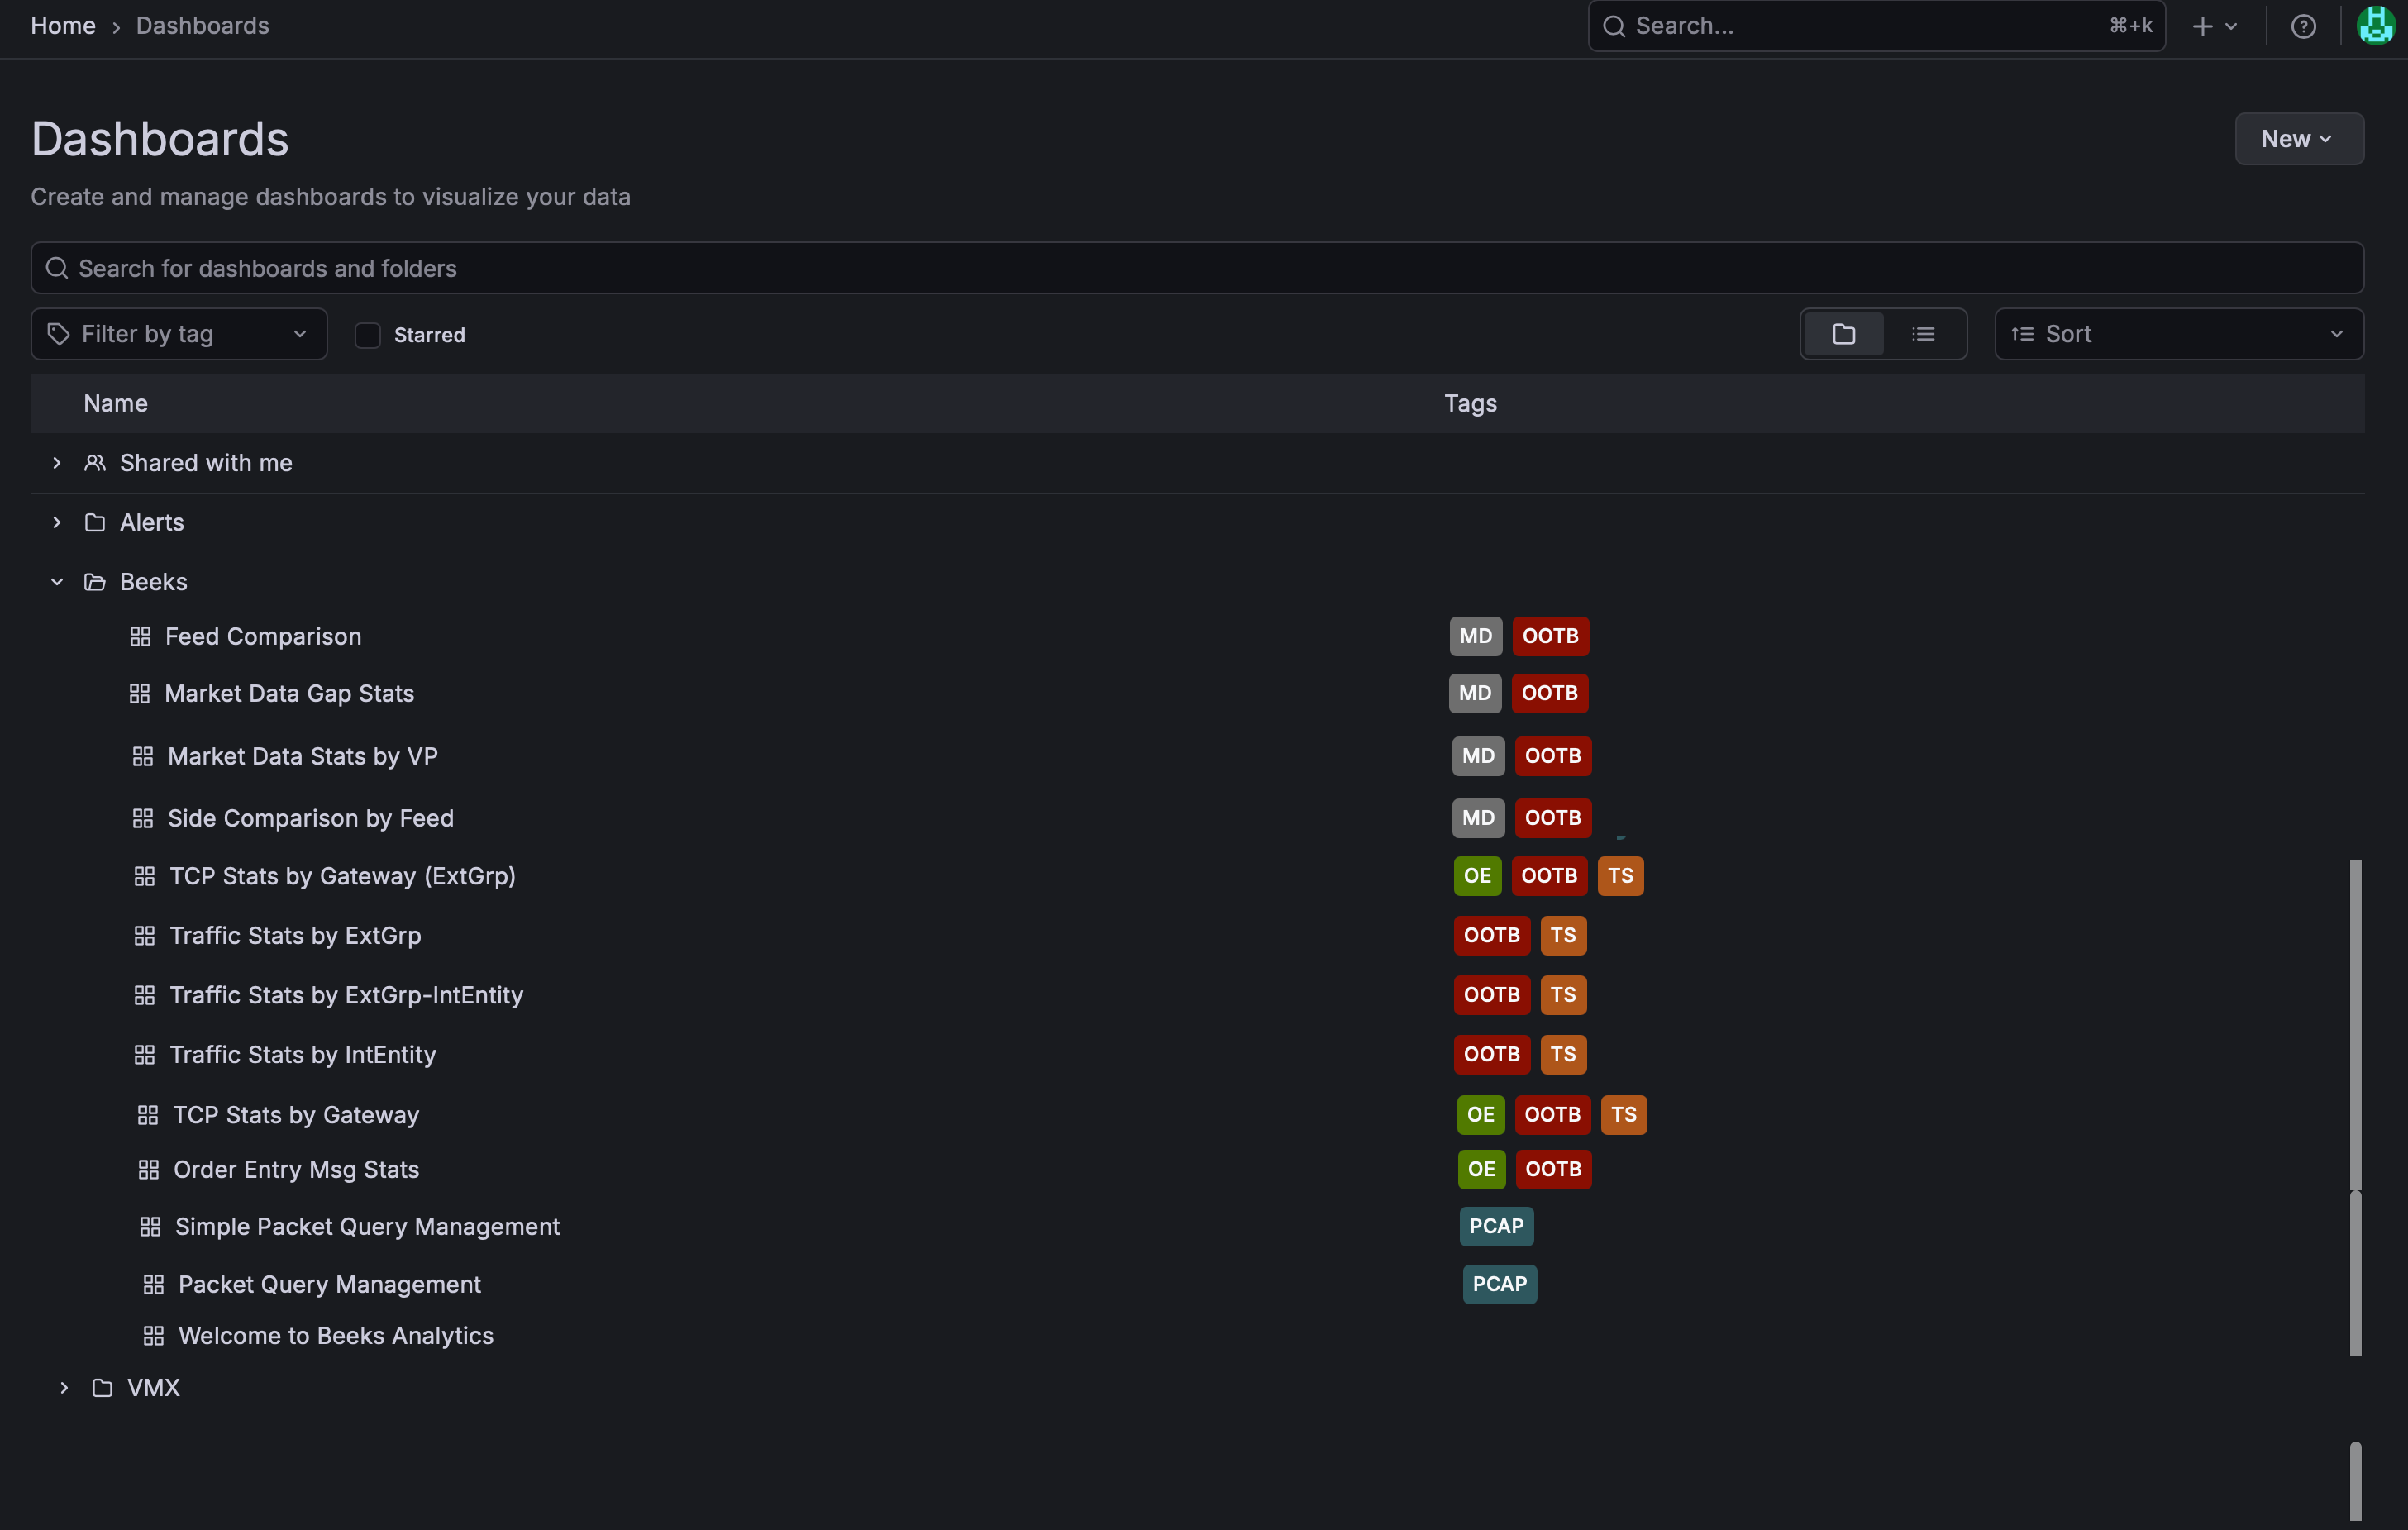
A dashboard can have multiple tags applied to it. For example, the Market Data Stats by VP dashboard is assigned both the OOTB tag (this tag means that it is a standard BAM dashboard), and the MD tag (to indicate that it is a Market Data dashboard).
Tag | Type of Dashboard |
|---|---|
OOTB | This is a standard Beeks Analytics for Markets dashboard (BAM was formerly referred to as the Out-of-the-Box product). |
MD | Market Data |
TS | Traffic Stats |
OE | Order Entry |
PCAP | Packet Capture |
HEALTH | System Health |
DEBUG | Used for internal troubleshooting. |
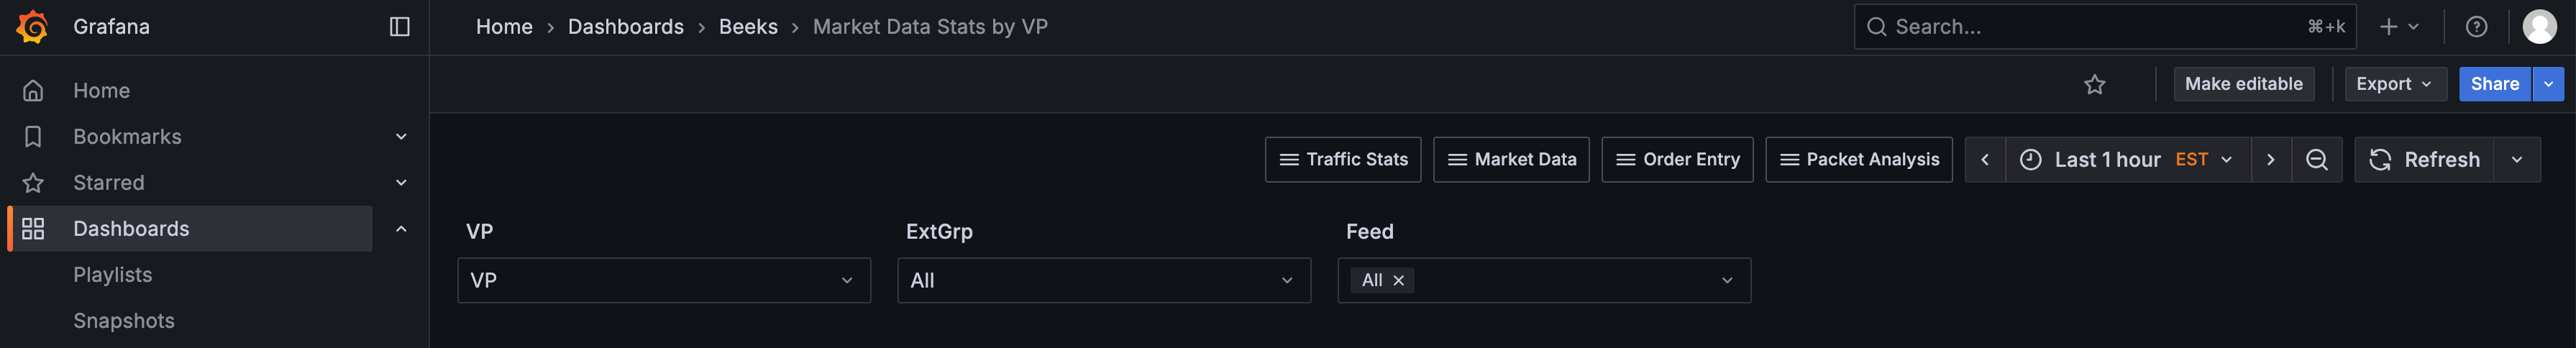
Once you open a Beeks Analytics dashboard, you can use the shortcuts, e.g. Order Entry, in the top right to jump to other BAM dashboards. You can also use the Search field to search by dashboard name.
Pro Tip
The advantage of using the shortcuts to navigate between dashboards is that the time period of your current dashboard is maintained on the new dashboard.
If you select a different dashboard using Search or the top-left folder navigation, a new default time period will be applied to the new dashboard.