Introduction
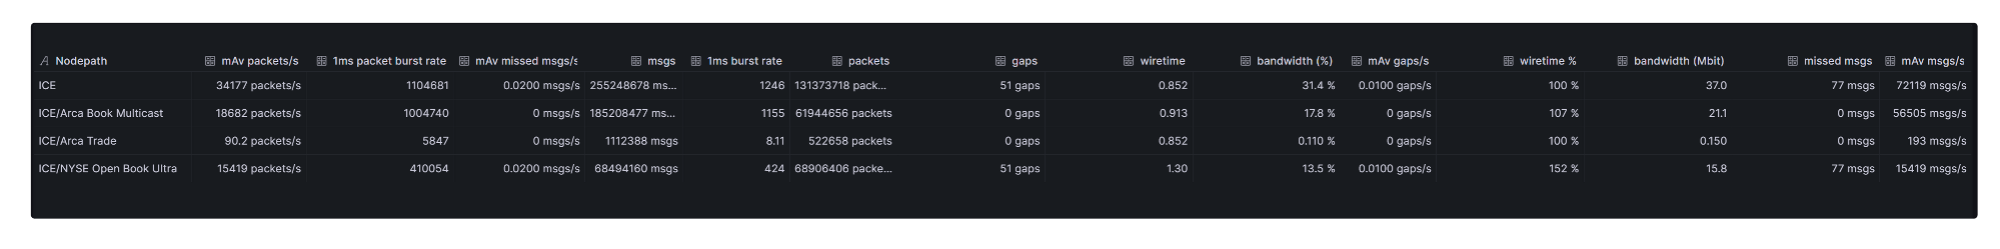
Beeks Analytics uses Aggregators to perform calculations on Agent Event data. Each Aggregator can be thought of as a spreadsheet representing a flattened tree structure, where each cell is tracking a different stat. In the example below, the nodepath column on the far-left shows the level of the breakdown of the recorded data, generally with top level summary data and multiple levels of breakdown by technical or business attributes.
A key benefit of Beeks Analytics is the ability to be flexible with defining the particular breakdown that is useful for your own individual business purposes.
Beeks Analytics periodically records the values of each cell and stores them in a Timeseries for later retrieval. This allows you to monitor how the values change over time.
Worked example
This worked example shows how to build a time series query that returns Timeseries results, in which each cell has a stream of its own with a timestamp and value. Each cell records the open, close, high, low, mean, time-weighted mean, difference, % difference, and range value for each period.