Beeks Analytics REST API Overview
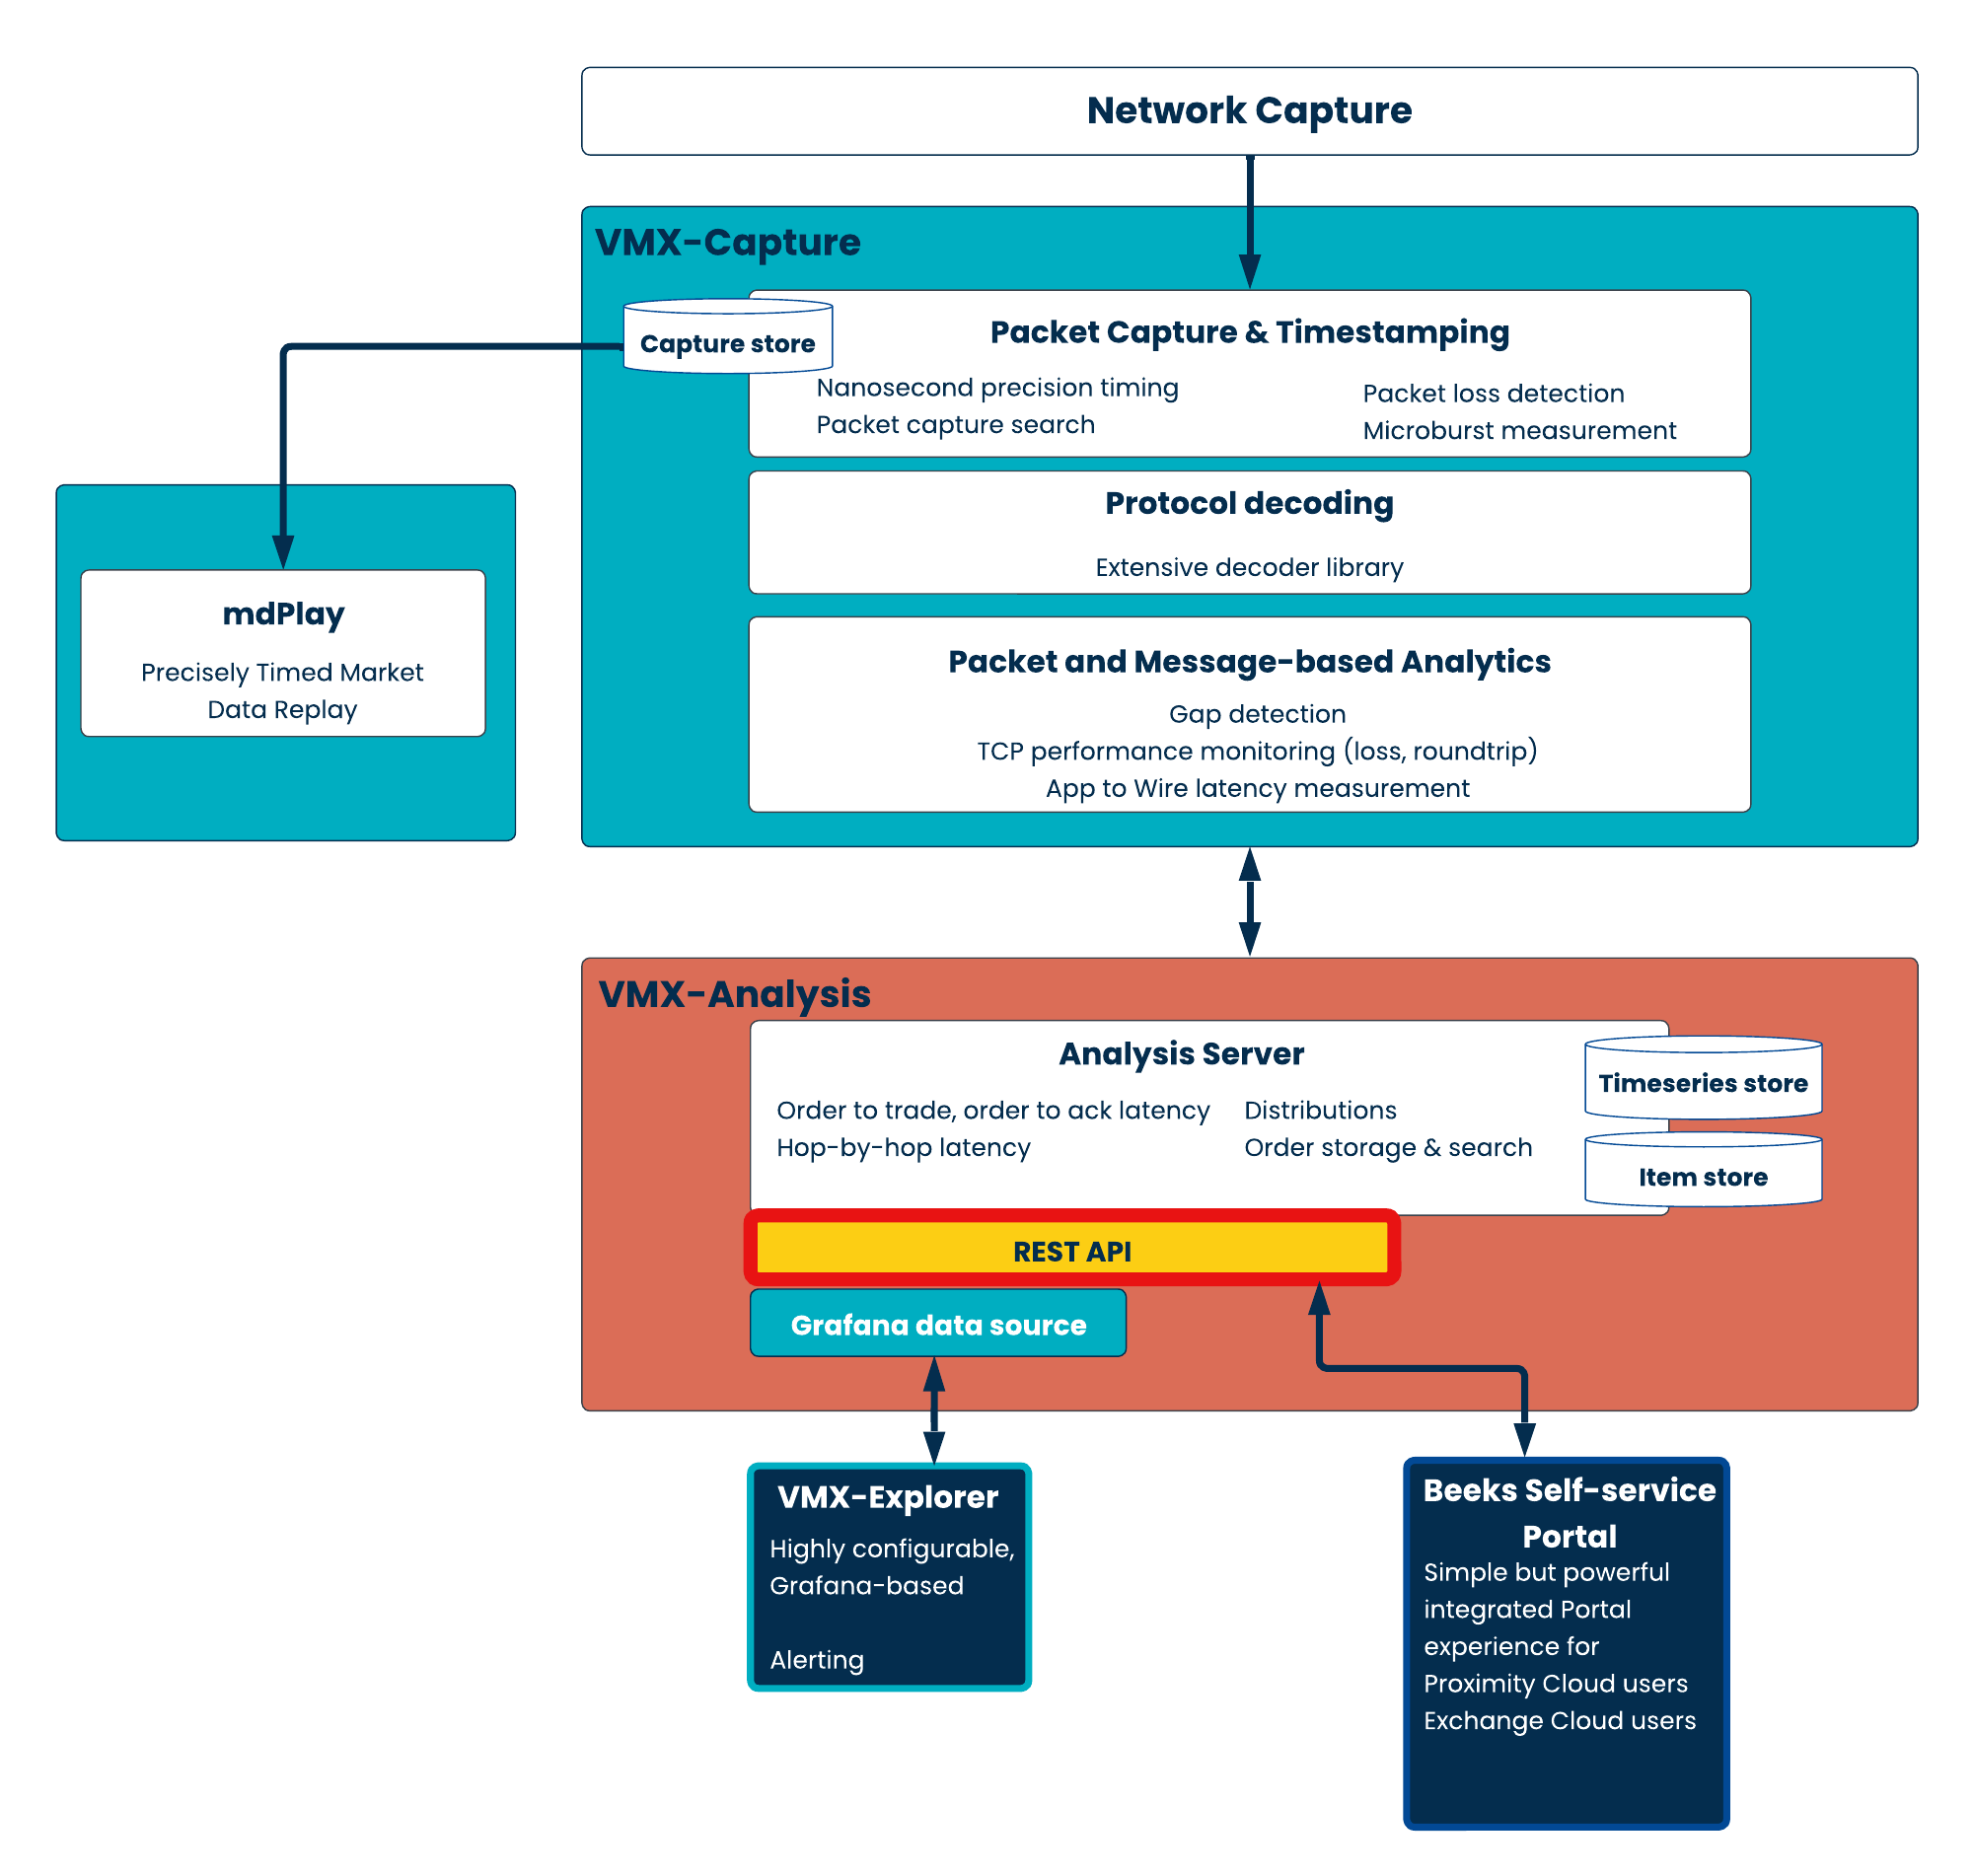
The REST API provides an interface to programatically access information from within the Beeks Analytics system. The Analysis Server (part of the VMX-Analysis component of the overall Beeks Analytics architecture) presents this REST API to users. The REST API is also used by the Beeks Self-Service Portal which users can use to manage their infrastructure within Beeks Proximity Cloud and Exchange Cloud.
The REST API, Analysis Server and VMX-Analysis are all parts of the overall Beeks Analytics open architecture (see diagram below). See the Beeks Analytics Concepts Guide for more information about the Beeks Analytics open architecture.
Note that:
The REST API is a request/response API. Beeks Analytics also makes available a public/subscribe API called the Core Data Feed which can be more suited to interfacing with VMX-Capture layer directly, or for maintaining a streaming list of updating information from the VMX-Analysis server. The Core Data Feed is outside of the scope of the current document.
Although the REST API is presented by the Analysis Server (part of the VMX-Analysis architectural layer), the REST API is also used to query data from the VMX-Capture architectural layer.
Clients can deploy appliances which are exclusively for packet capture and/or streaming of decoded data to their own systems. These systems do not have the overhead of running a full VMX-Analysis instance running on them. In these cases, a thin deployment of VMX-Analysis which provides a more limited REST API and Grafana data source can be installed on the appliance.
Swagger Docs Overview
To enable you to query Beeks Analytics, we provide OpenAPI / Swagger documentation on SwaggerHub.
If the SwaggerHub link provided doesn’t work for you, go to app.swaggerhub.com and search for “BeeksAnalytics”.
How to read our Swagger docs
Firstly, ensure you are using the correct version for your Beeks Analytics installation. If you aren’t sure, ask your Beeks Support contact.
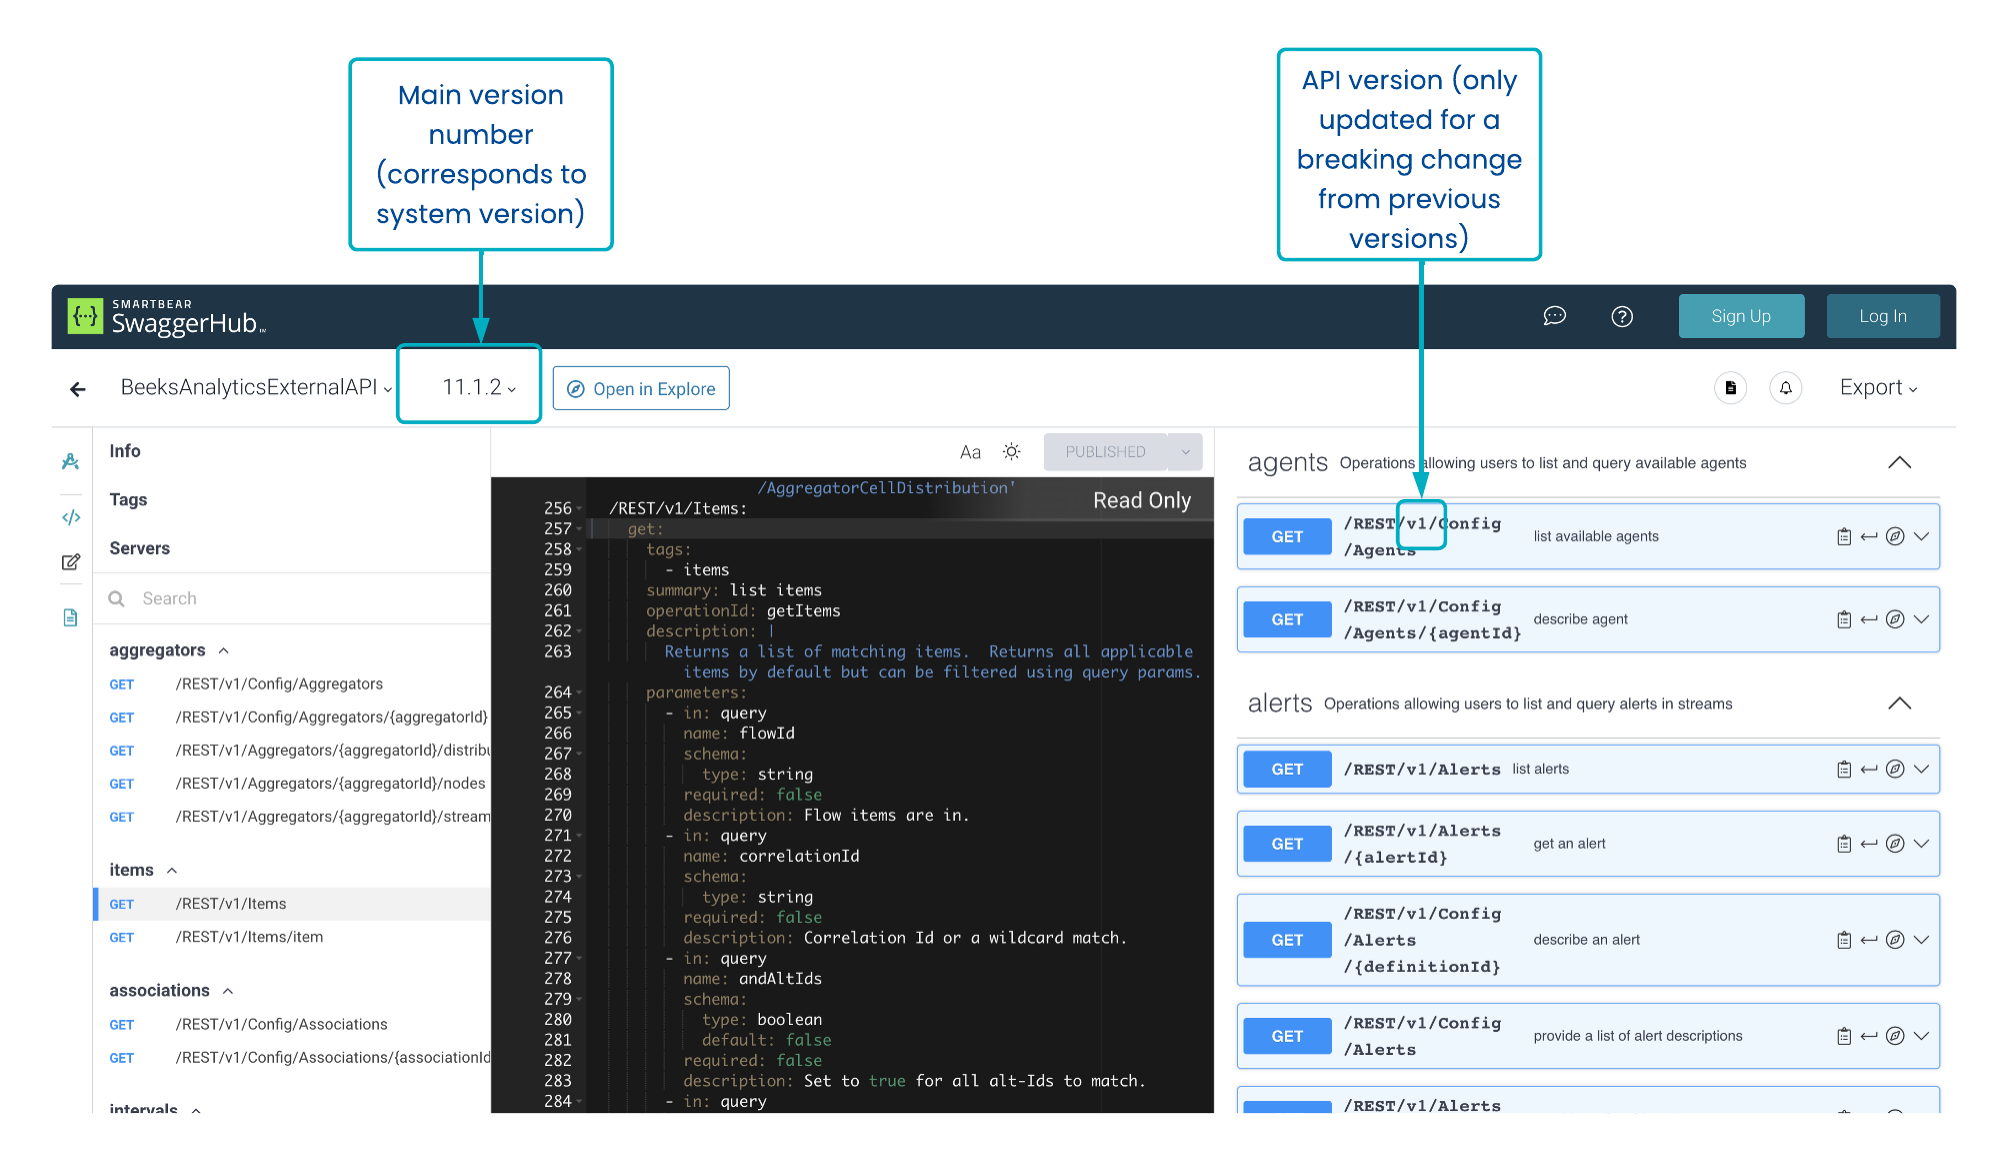
SwaggerHub presents a read-only view, with navigation to each endpoint on the left hand side and details and examples in the right hand panels.
Key information about our API
Namespaces
The API is grouped logically into multiple namespaces where each namespace represents an entity in the Beeks Analytics architecture.
There is also a ‘config’ grouping for configuration endpoints. These allow you to view how entities are currently configured.
Versioning
The main version number corresponds to the system version, whereas the API version (embedded in the URL) is indicative of whether there is a breaking change from previous versions.
Each new version of the Beeks Analytics software is designed to be additive. With additive changes, the major version indicator (v1 in the example above) will not change. Any breaking changes will result in a new major version (v2, v3 etc) main version indicator in the URL instead.
Data structure: How calls are related
The API is designed to be stateless, meaning that no call relies on another happening first.
There are some loose relationships between calls though. For example, you can use the results of one call to build up possible parameters for another. See the Timeseries Usage example for more details.
Error Codes
HTTP codes indicate the basic return status, with JSON description in the payload.
HTTP Code | Meaning |
|---|---|
200 | OK |
400 | Malformed request |
401 | Unauthorized caller. |
404 | Resource not found or caller does not have access. |
500 | Exception in the server. |
504 | Could not complete request within timeout. |
JSON success return:
.... # normal JSON response |
JSON error return:
{ "status": "404" "message": "Some information about the exception"} |
Time unit description
You can provide from and to dates in standard format as longs (milliseconds since 01/01/1970) or relative to the current time. These times are assumed to be inclusive unless otherwise stated in the Swagger documentation.
The following time units are supported: s (seconds), m (minutes), h (hours), d (days), w (weeks), M (months), and y (years).
The minus operator allows you to step back in time, relative to now. If you wish to display the full period of the unit (day, week, month, etc. ), append /<time unit> to the end.
The plus operator allows you to step forward in time relative to now. You might use this feature to look at predicted data in the future, for example.
Here are some examples of use:
Example relative range | From: | To: |
|---|---|---|
Last 5 minutes |
|
|
The day so far |
|
|
This week |
|
|
This week so far |
|
|
This month |
|
|
This month so far |
|
|
Previous Month |
|
|
This year so far |
|
|
This Year |
| `now/Y |
Example long timestamp (epoch) |
|
|
Raw vs Formatted Data
Most endpoints support the raw boolean query parameter that controls the server-side formatting of the data. Raw data is returned in full-resolution, unprocessed. Formatted data has rules configured on the server that provide suitable formatting to the data to make it more useful.
For example, bandwidth may be stored as bits per second raw, and formatted to Mbit/s with 2 decimal places for a cleaner display.
Authentication
We expect a header with a JSON Web Token (JWT) bearer token in each call in order to authorise the user. This JWT must match the one configured on the Analytics server in the jwt.properties file.
Alongside this, we employ IP whitelisting (also specified in jwt.properties) to further secure the endpoints.

