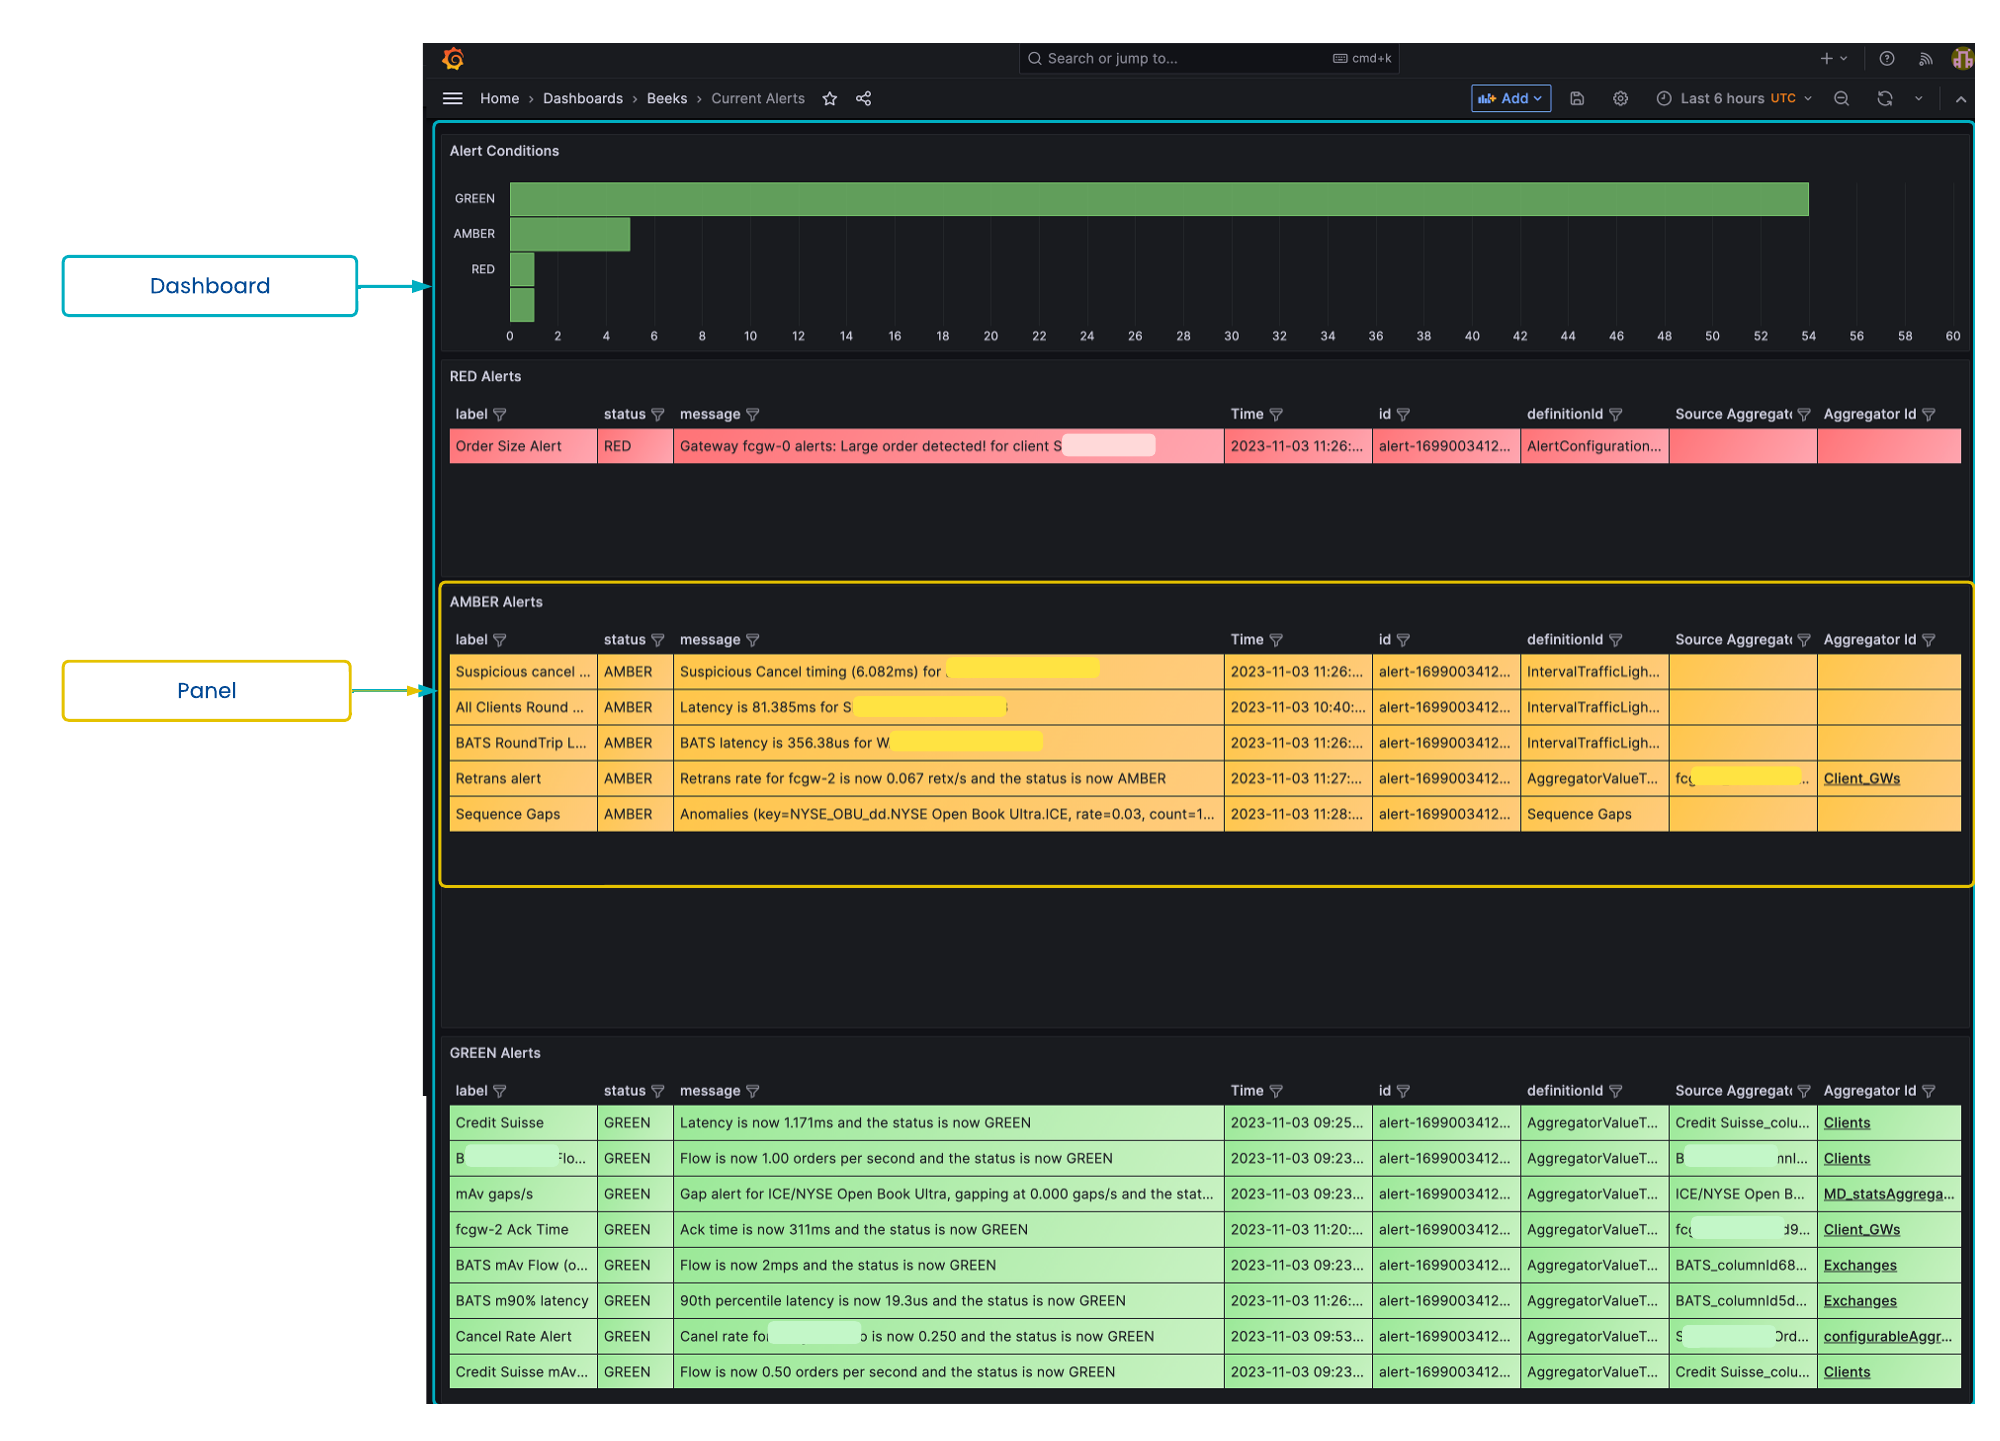
Grafana is an open-source monitoring and observability third-party application, which VMX-Explorer uses to display analytics. Grafana allows you to track a dataset over time and show how it changes. You can also query multiple sources and present the data as rich visualisations in a set of unified dashboards. Each dashboard contains one or more panels that each display a visualisation of the data, for example, a scattergraph, big number etc.
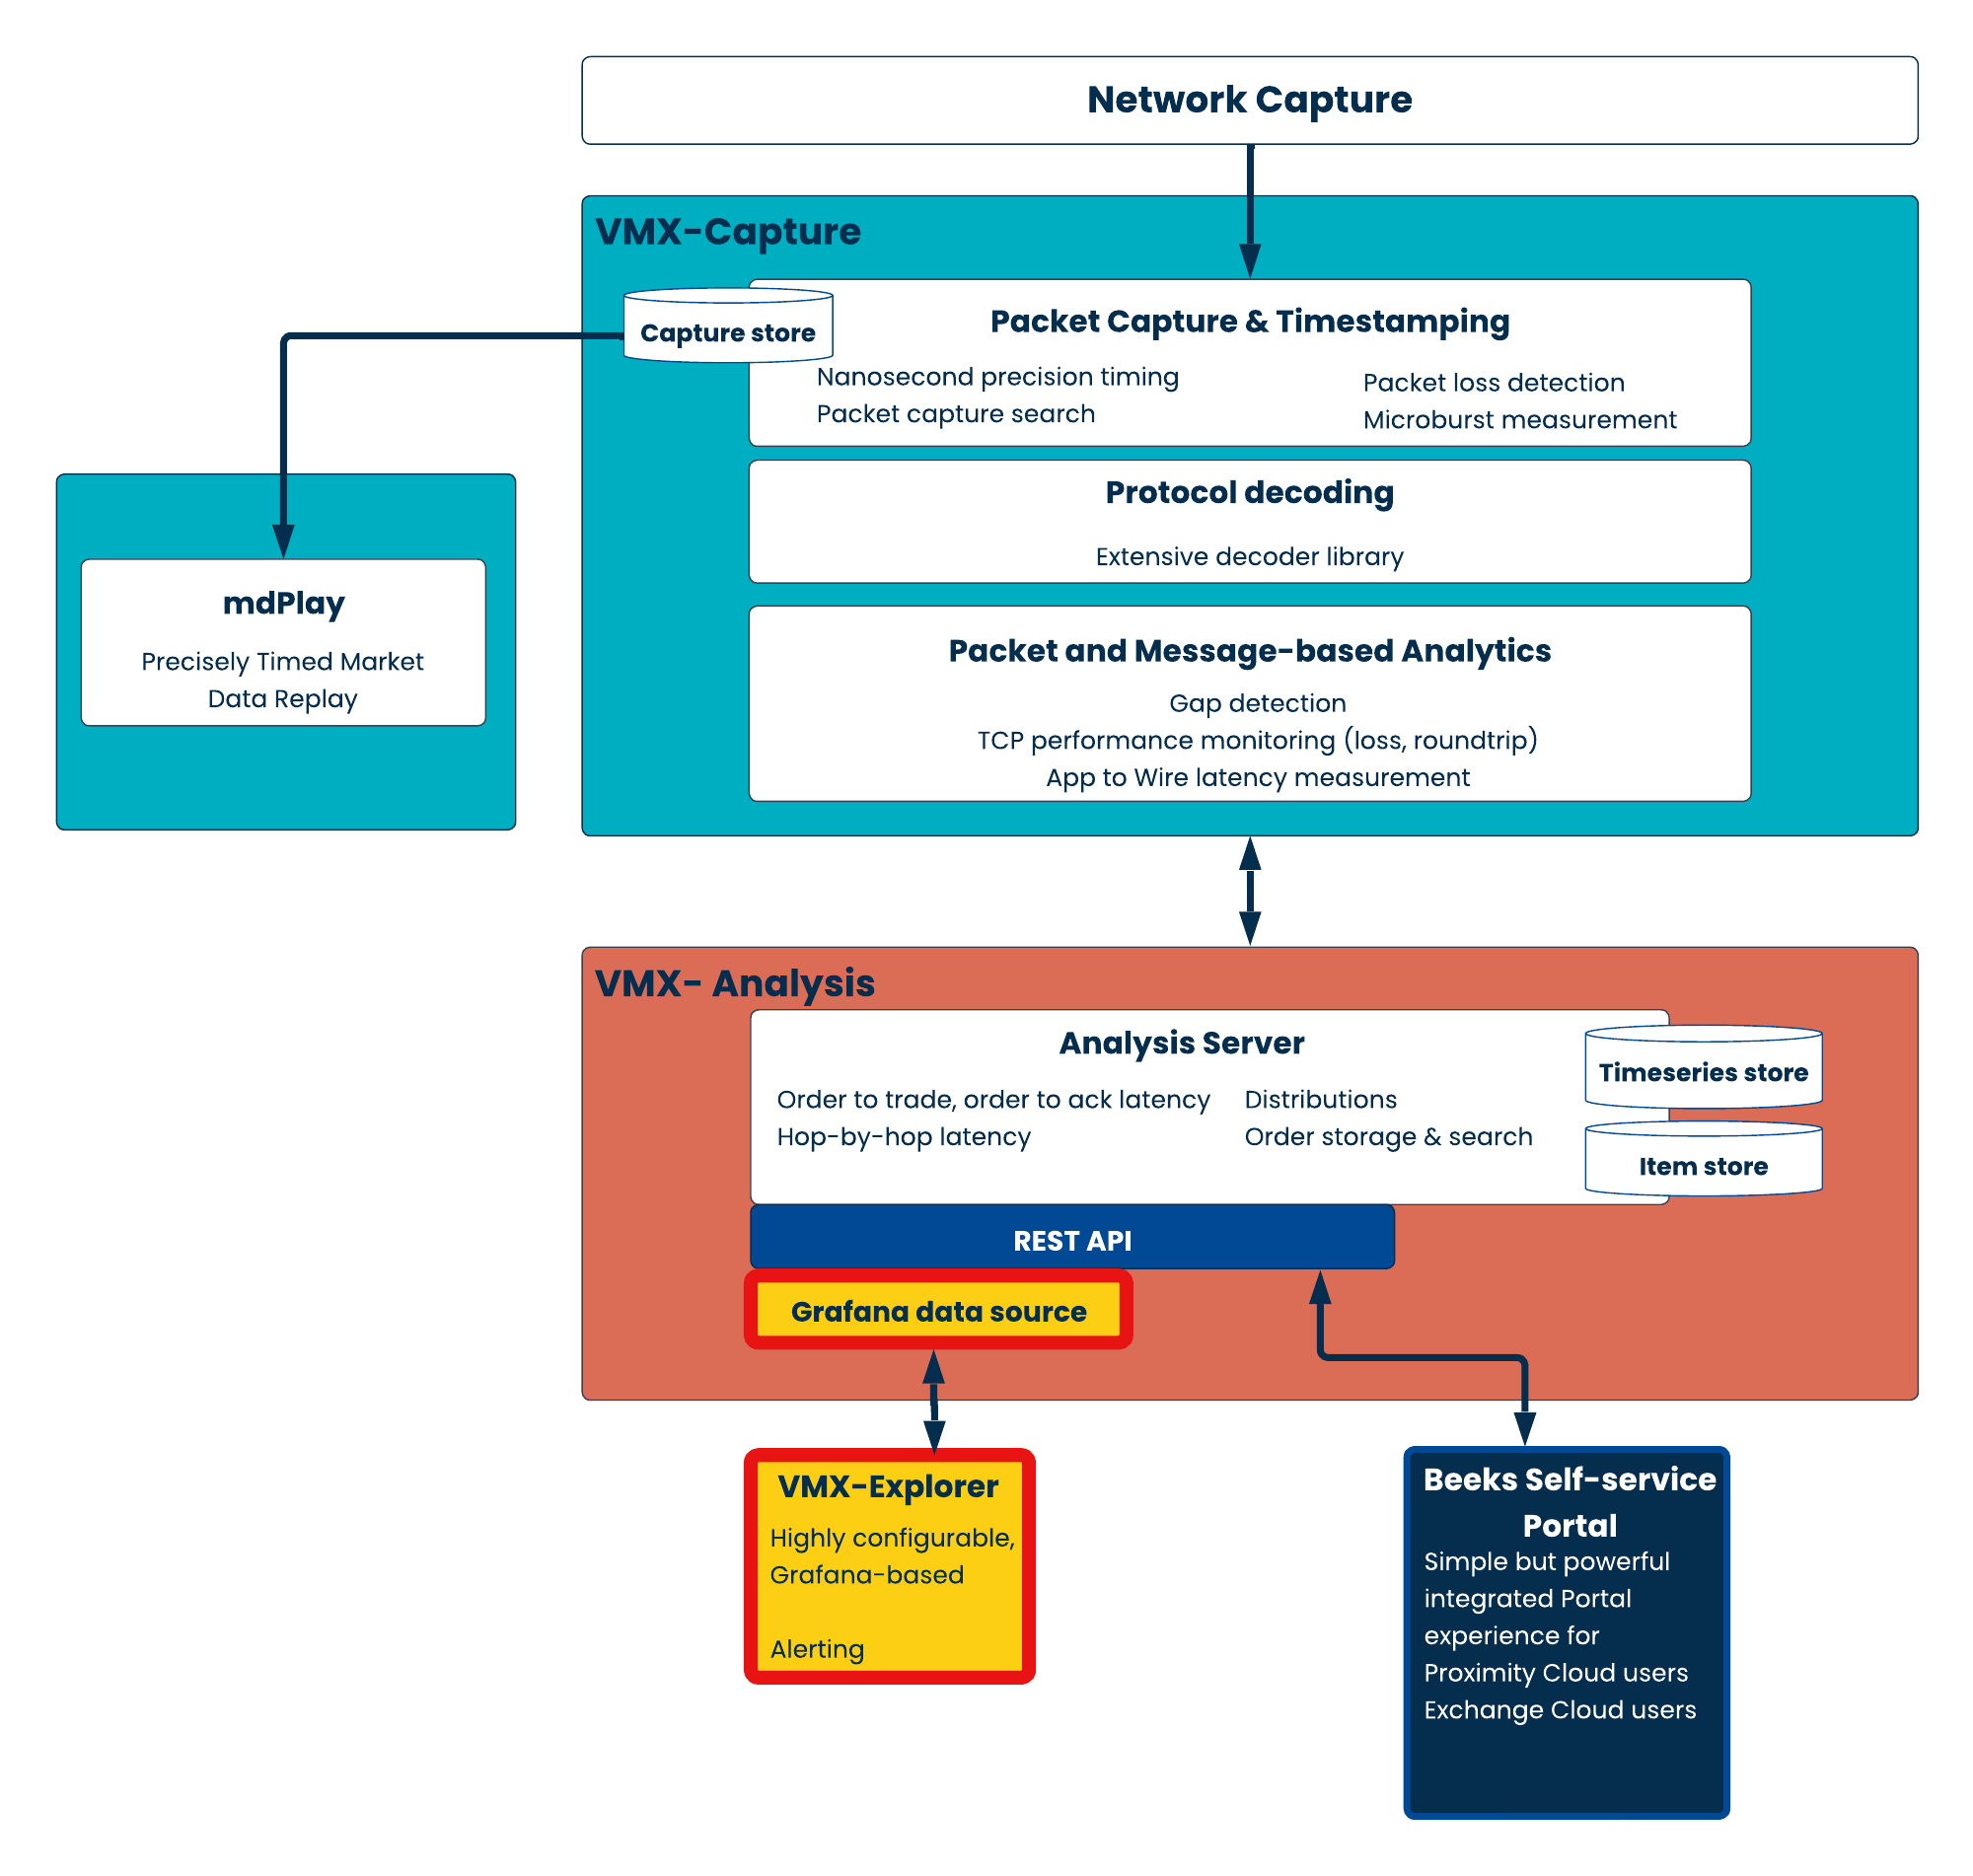
To enable VMX-Explorer to populate the panels with Beeks Analytics data, we connect it to the Beeks Analytics Server via a Beeks Analytics datasource.
Read the Grafana documentation for more background on the Grafana configuration and on data sources.
The datasource makes it easy to build dashboards to view the rich data that is available within the Beeks Analytics system. It also supports reporting and configuring alert thresholds. See the Beeks Analytics Concepts Guide for more information about the other components of the Beeks Analytics system, or for a more in-depth coverage of any of the types of data that are covered in this guide.