Beeks' powerful Analytics tool delivers the comprehensive monitoring and rich analytics that enables our customers to experience the very best performance in high-speed trading environments.
Monitor. Analyse. Improve.
The ability to track and analyse real-time performance at packet level is key to optimising your trading infrastructure. Beeks Analytics enables you to inspect analytics via the following:
VMX-Explorer and Beeks Analytics API
Beeks Analytics enables you to build custom queries that retrieve analytics about every price, quote, or trade via its Beeks Analytics API and via its Grafana-based VMX-Explorer tool. VMX-Explorer allows you to drill down to a more granular view, for example, to view information by feed, and you can also configure thresholds that prompt alerts when they’re breached as a result of an anomaly.
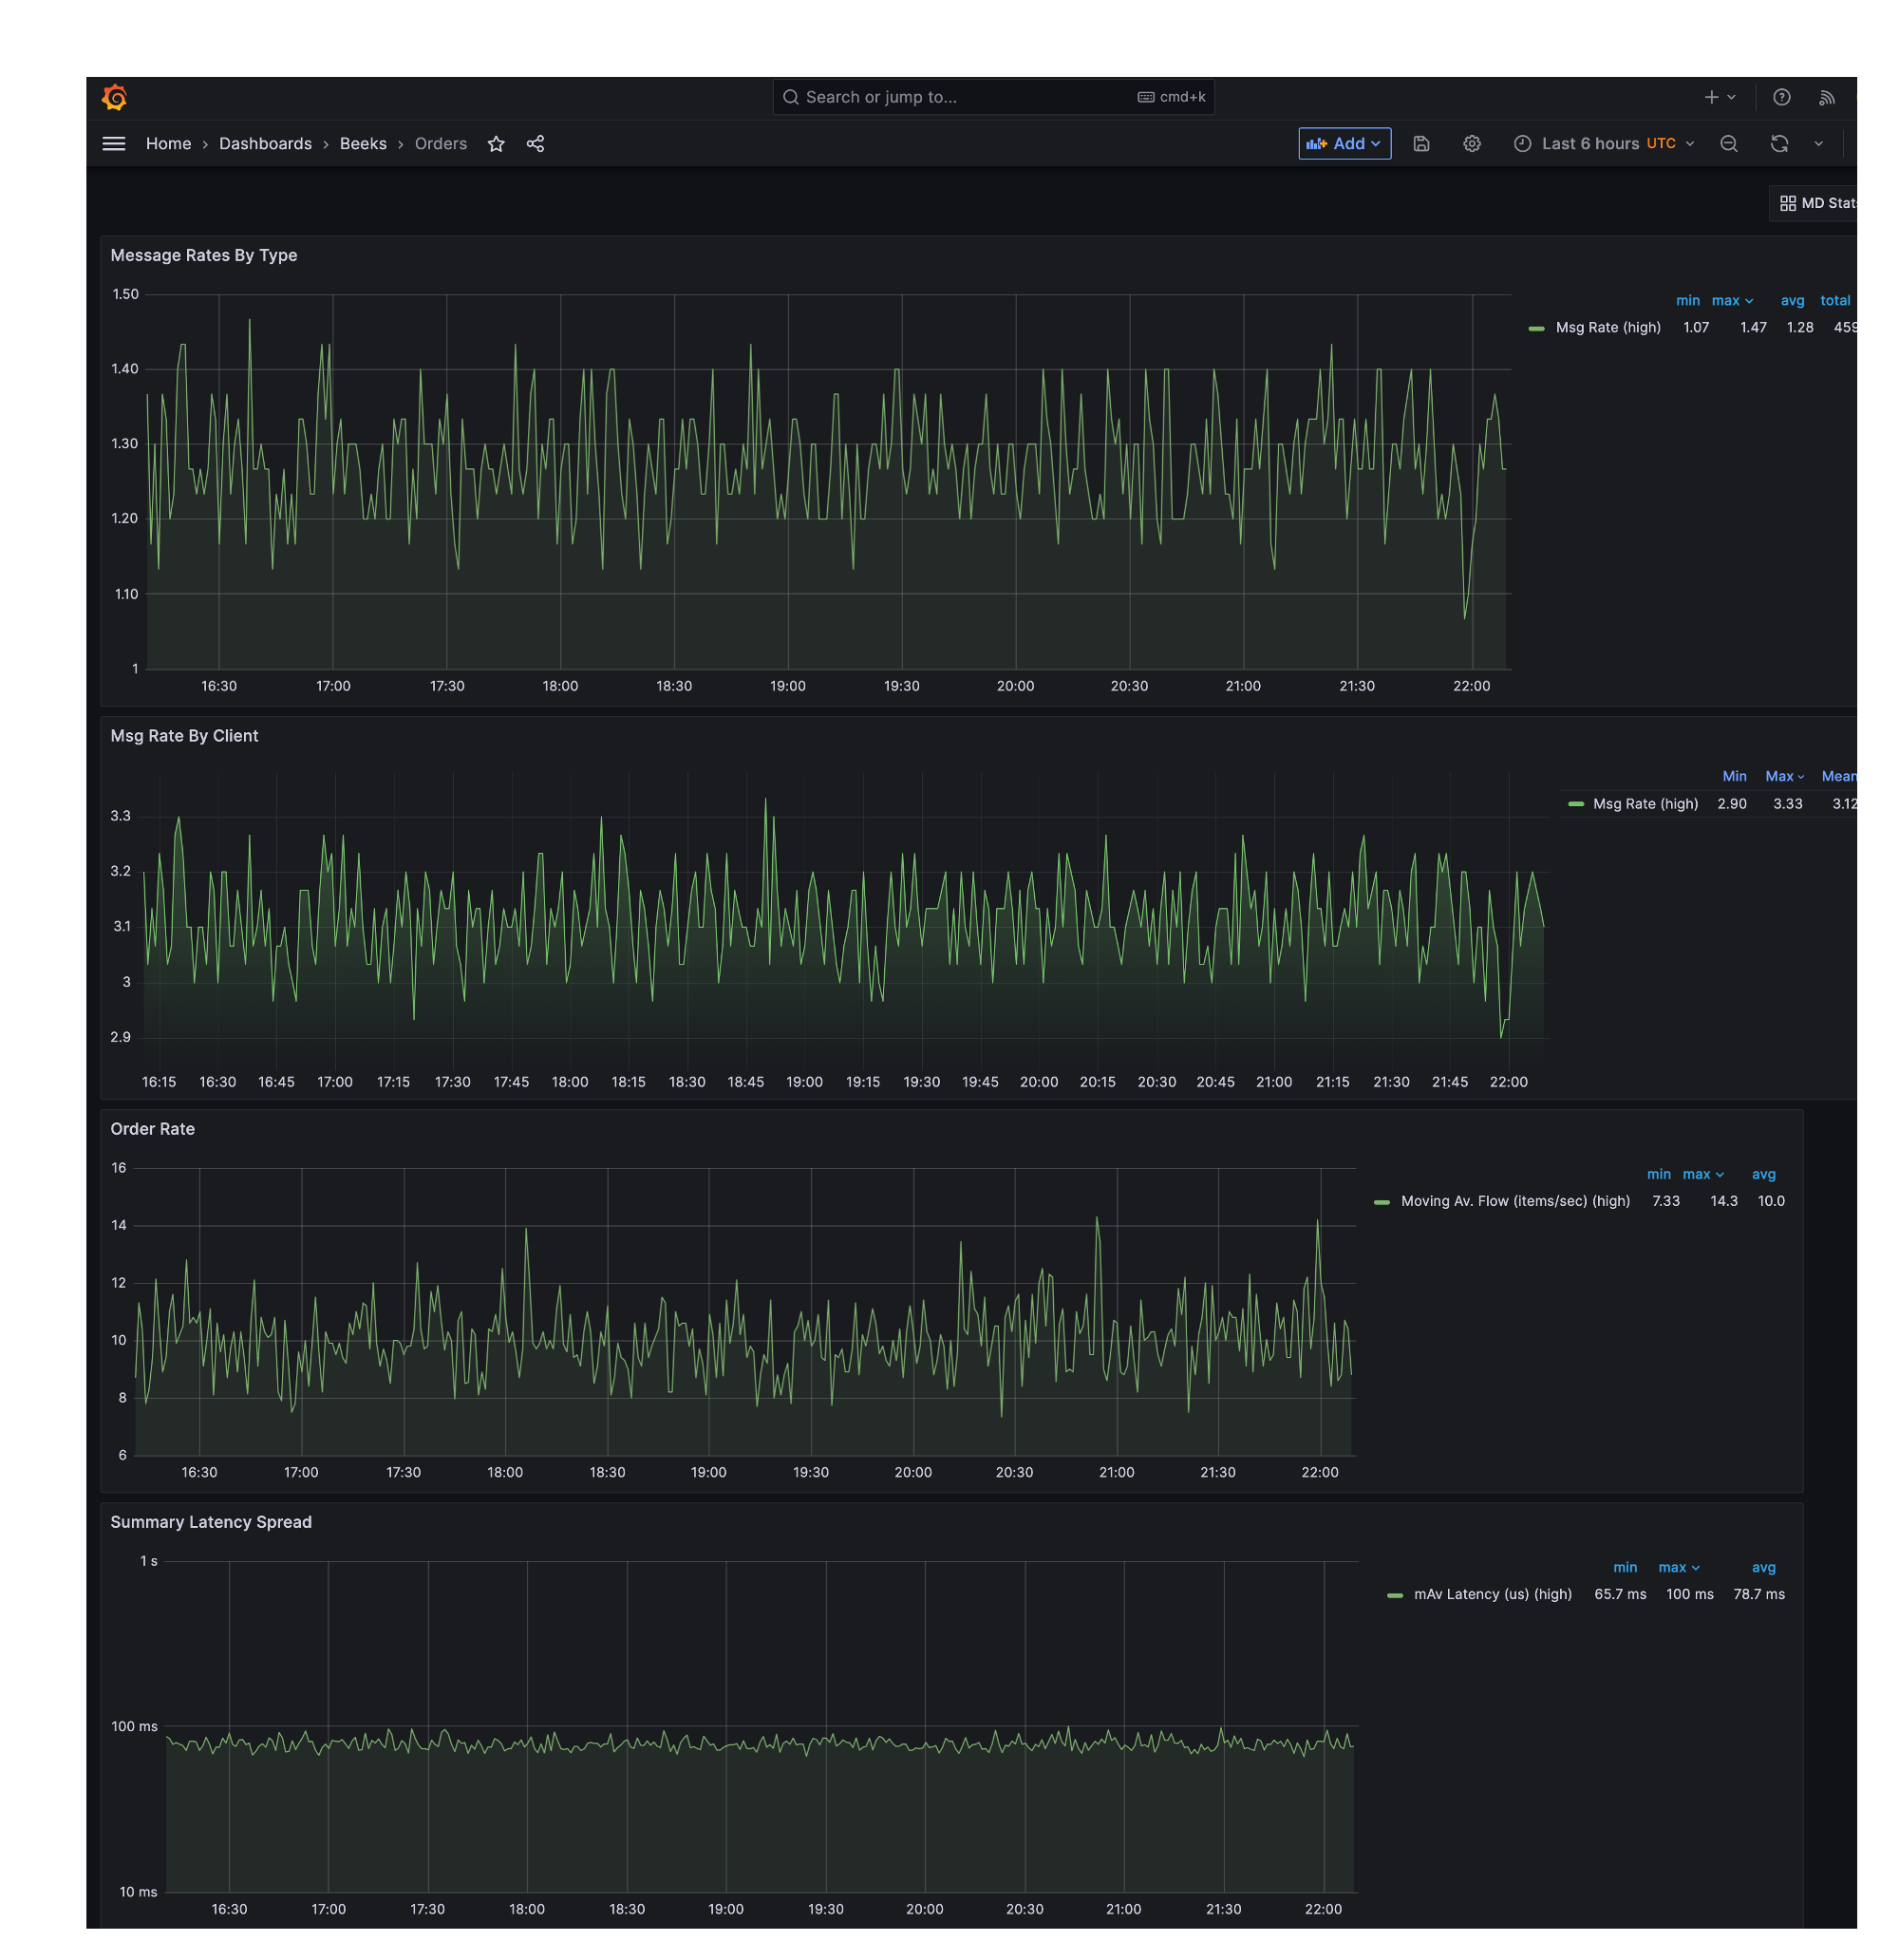
Learn more about VMX Explorer in the Beeks Analytics User Guide for VMX-Explorer.
Beeks Portal
For Proximity Cloud or Exchange Cloud Availability Zones, we’ve also built visualisations of some standard Beeks Analytics metrics into the Beeks Portal. These are available in a new Analyse tab for a Dedicated Server, or in the Analyse page (select Analyse in the main menu):
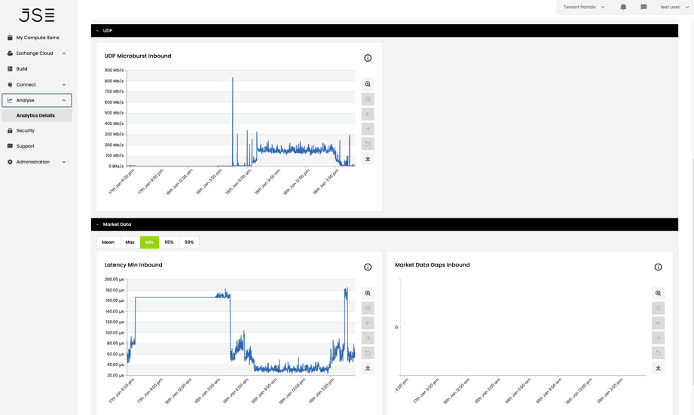
Understand the functionality of the Beeks Portal by reading the Portal User Guide.
Beeks Analytics data
It’s important to understand the data and protocols that are used to build these metrics and analytics, especially for customers that want to build their own custom analytics via API or in VMX-Explorer. This document explains the data that is produced by the Beeks Analytics for Markets template in Beeks Analytics including how it is aggregated, its source, structure, and definition.
Read more about Beeks Analytics in the Analytics Concepts Guide.