Beeks Analytics for Markets captures the timing references at each Visibility Point but does not support latency measurement between Visibility Points. Instead it uses Round trip and App-to-Wire methods at each Visibility Point to calculate latency.
If you're interested in unlimited monitoring of multiple Visibility Points and latency measurement between Visibility Points, please ask your Beeks Support Contact about Beeks Analytics Enterprise.
Different types of latency measurement
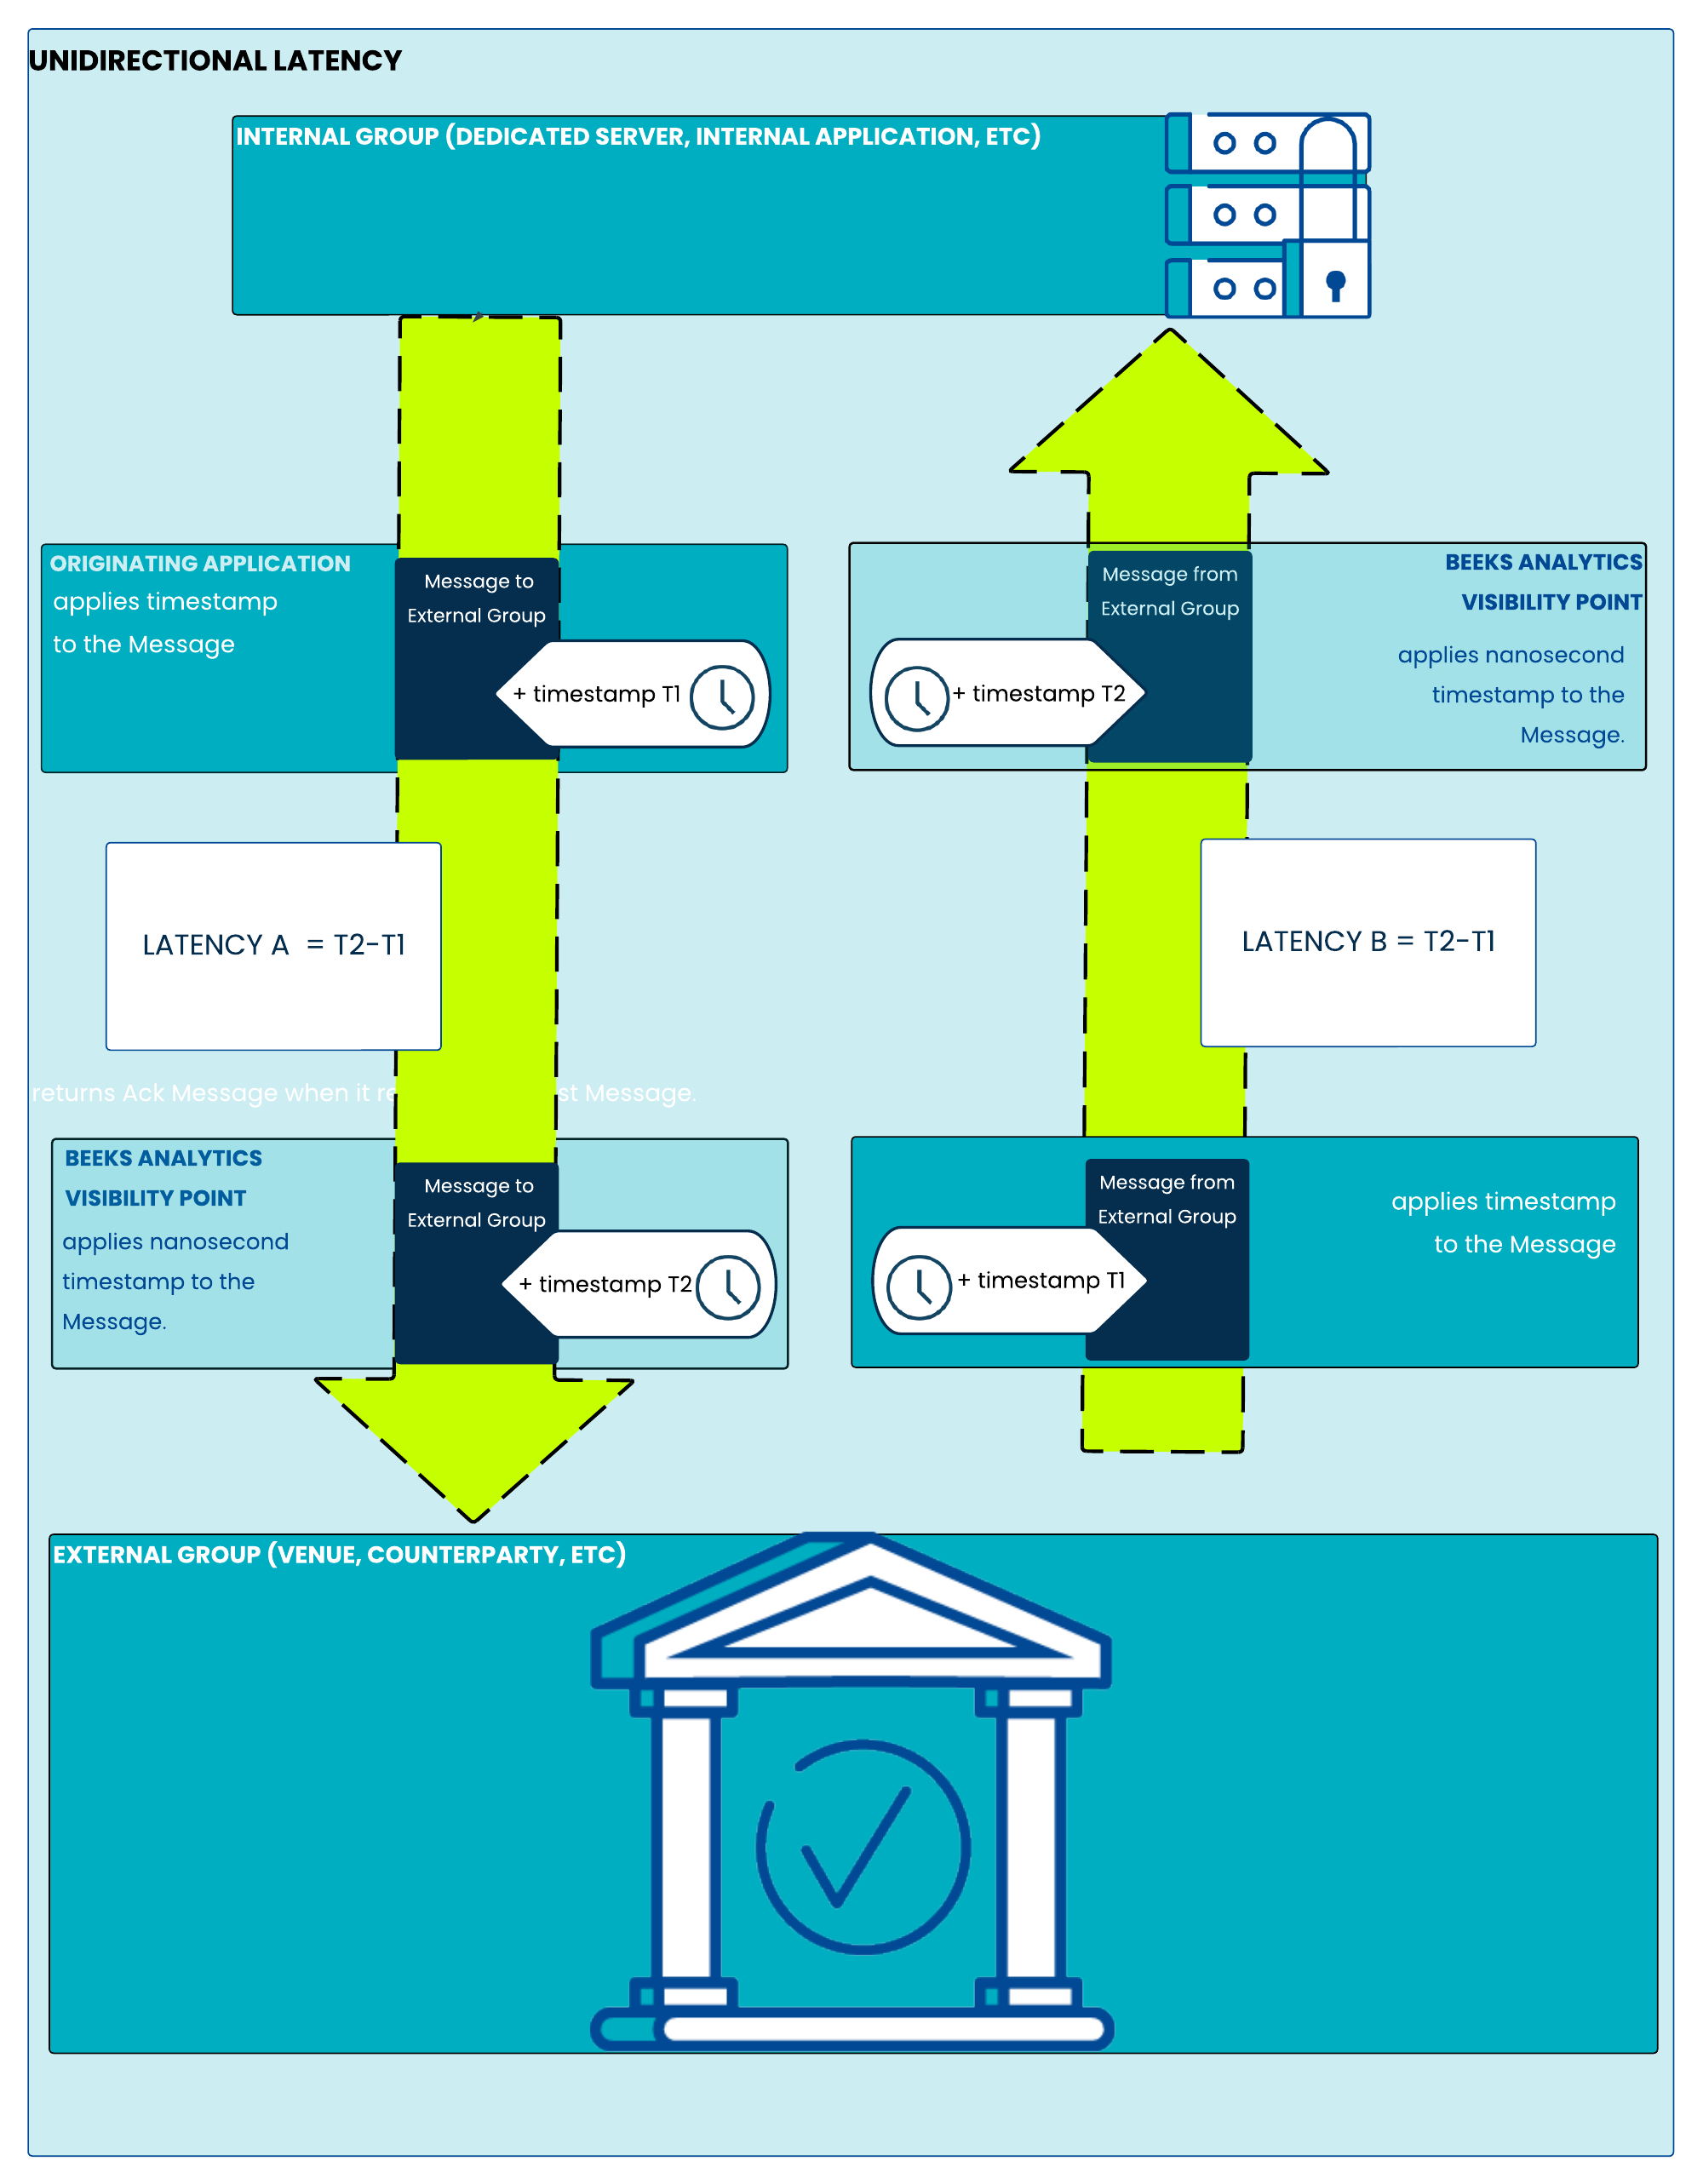
App-to-wire
App-to-wire - or Unidirectional - latency is the time that Beeks Analytics calculates between the SendingTime timestamp written within the message and the time it is observed at the Visibility Point. It is also known as the Wire time. This measurement is calculated for every trading and market data message that can be decoded, and the resulting latency calculation is recorded as an aggregated timeseries. This allows problems to be identified immediately, and also patterns over the course of a trading day, week, or month to be easily analysed. These latency patterns are available to view in VMX-Explorer and in the Beeks Portal.
App-to-wire latency is also recorded for every trading message that can be decoded, and these are recorded individually by the VMX-Analysis component as Agent Events. Different Agent Events that make up a particular order are correlated together to display as an individual Item. These Agent Events and Items are stored and are easily searchable within VMX-Explorer.
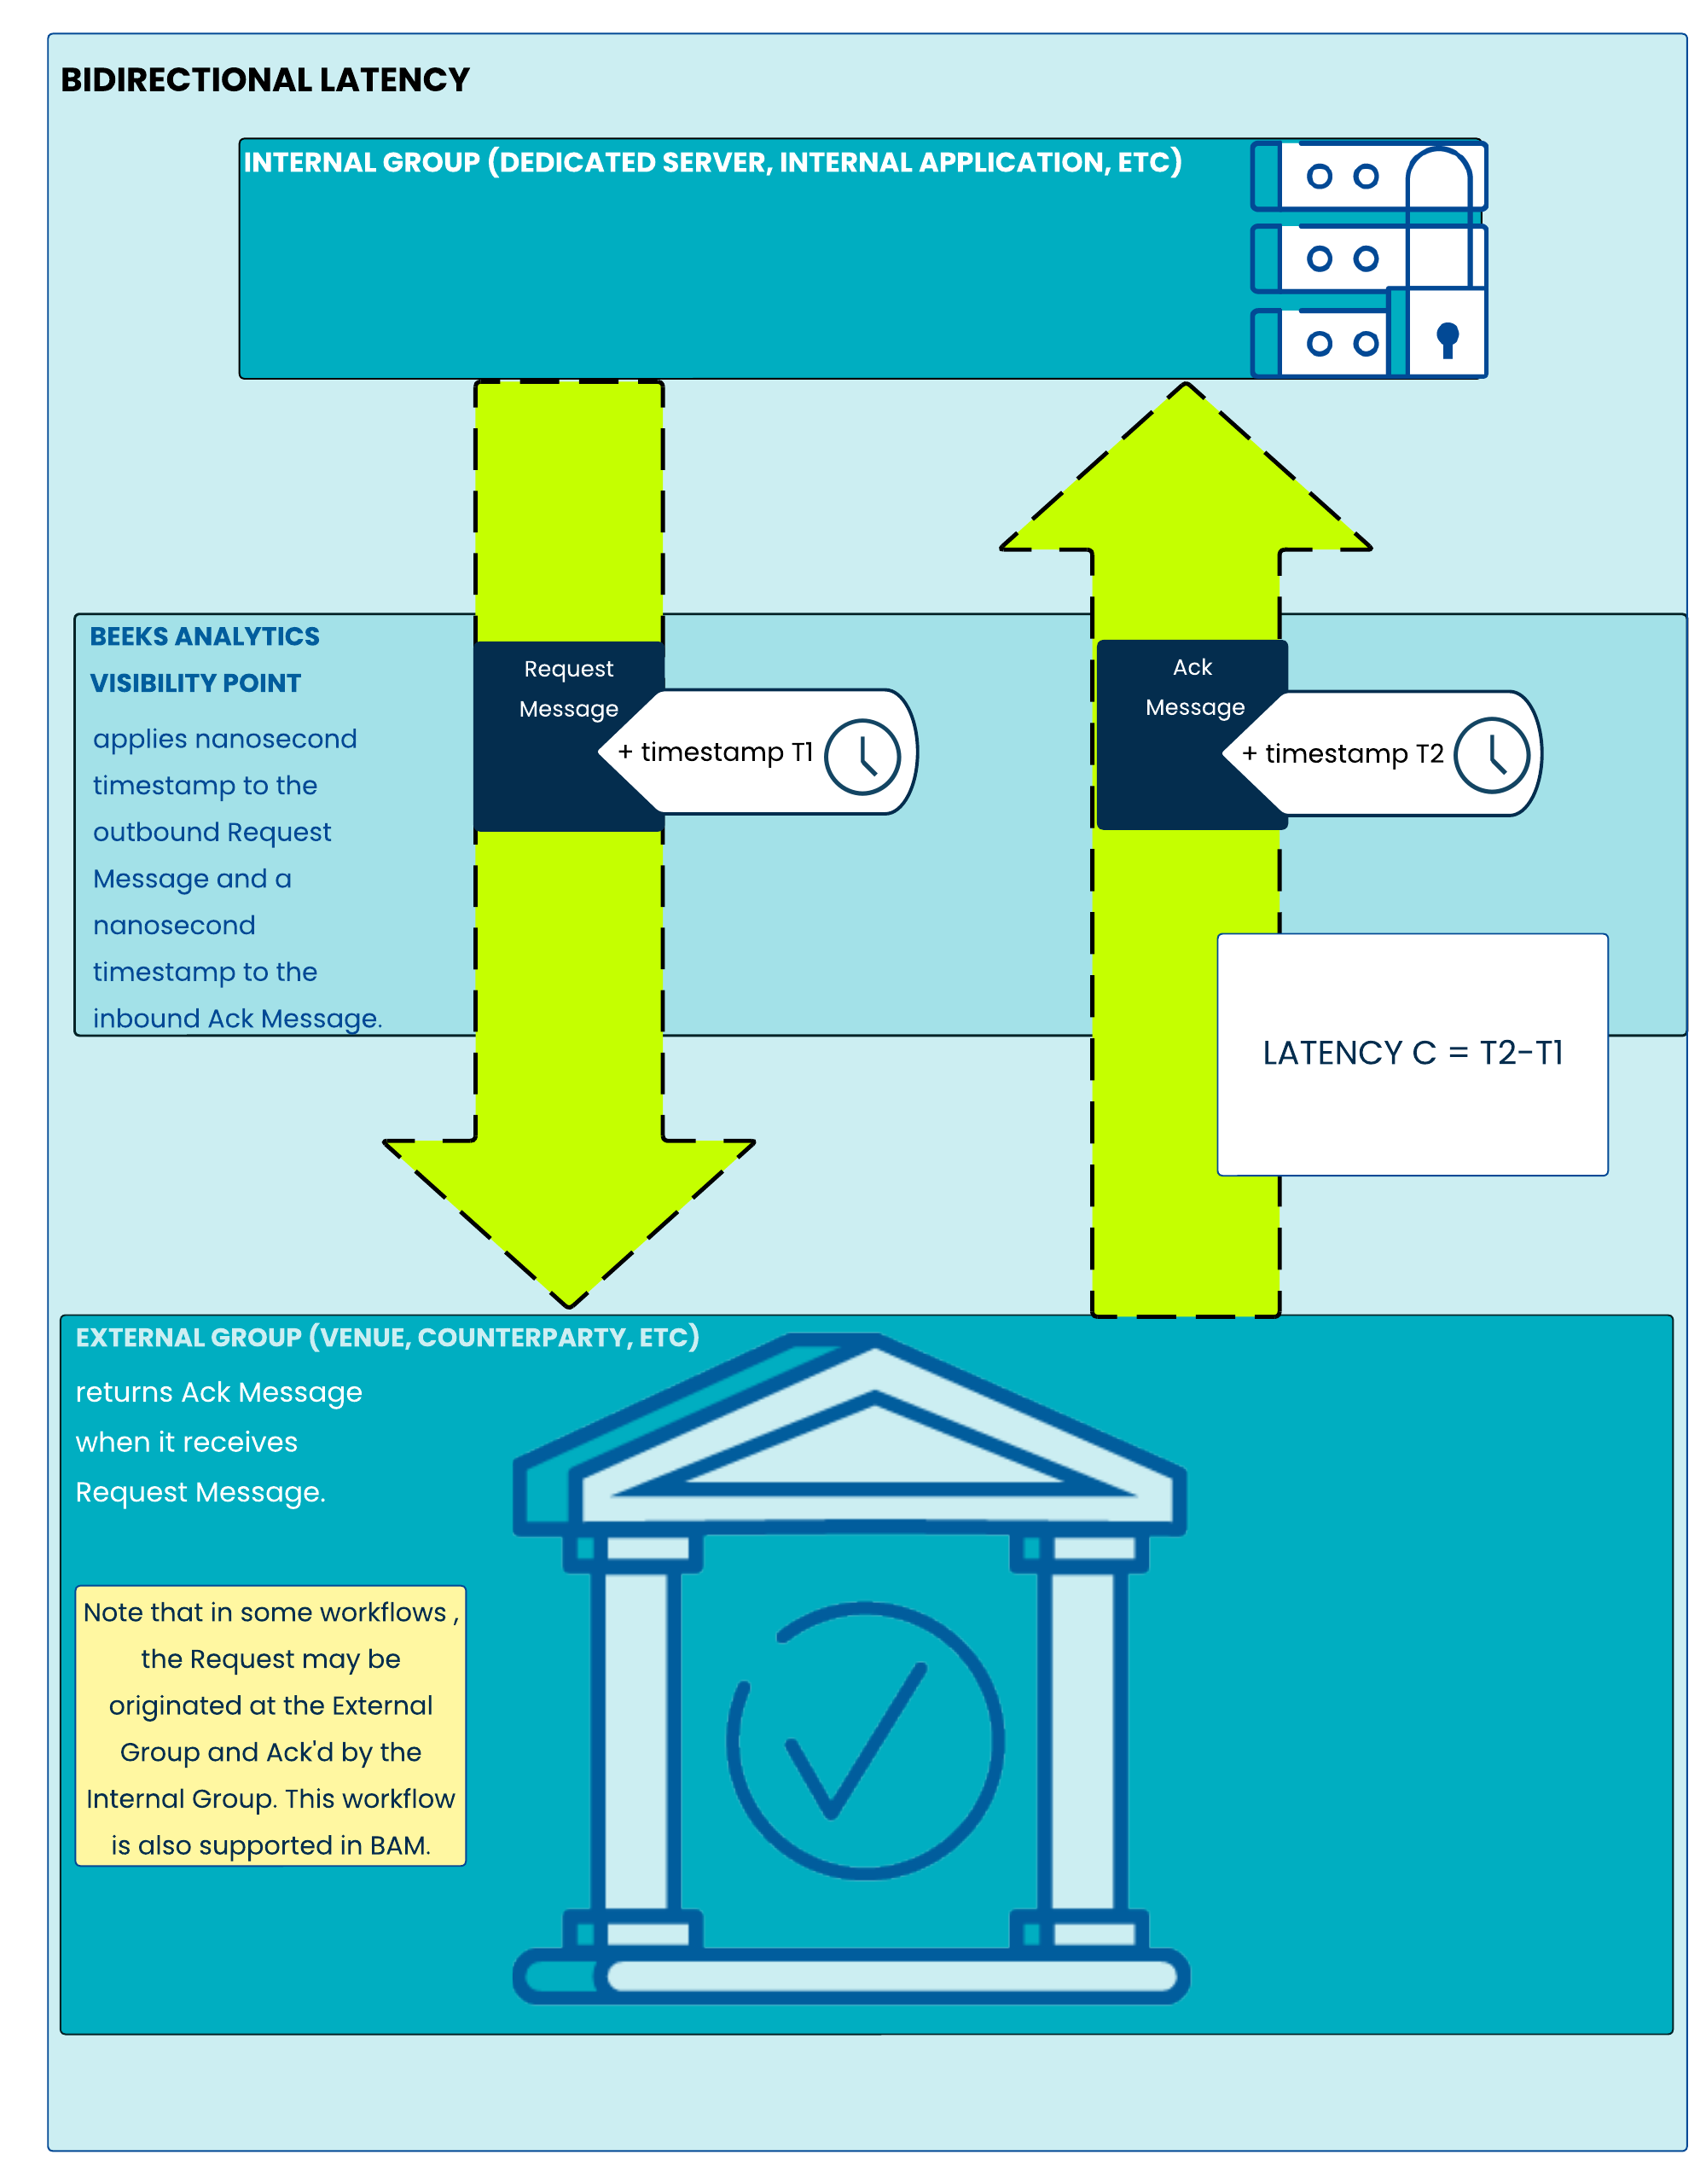
Round trip latency
The VMX-Analysis component will also calculate latencies between the different Agent Events. We call this Round trip - or Bidirectional - latency measurement. You can think of these as request/response latencies because they record the real latency (as observed at the Visibility Point):
FROM a request to the trading counterparty or venue (e.g. a New Order request or Cancellation request)
TO a response from the trading counterparty or venue (e.g. an acknowledgment or confirmation)
Importantly, these measurements are taken at the Visibility Point - ensuring that it is as close to the trading counterparty or venue as can be obtained.
VMX-Explorer allows the individual latencies within each Item to be broken down in a Gantt-chart style view, to assist with the support workflow to understand issues.
For more information about trading latencies, see Monitoring Trading traffic using Beeks Analytics for Markets
For more information about market data latencies, see Monitoring Market Data using Beeks Analytics for Markets
Latency percentiles for App-to-wire latency
Latency calculations are made available at multiple percentiles, to assist clients with different volumes of traffic, performance targets and sensitivity to latencies. The following percentiles are supported as standard in Beeks Analytics for Markets:
Minimum
50th percentile
95th percentile
99th percentile
Maximum