The flow configuration that is provided with the Beeks Analytics for Market template is relatively simple: order request to acknowledgment or fill. See https://guides.beeksgroup.com/BKDA013/Worked-Example_-Order-Entry-Stack-Probes-in-Beeks-Analytics-for-Markets.html (in the Configuration Guide for VMX-Capture) for details of how to configure that simple flow.
We include this additional worked example to demonstrate the full flexibility of Beeks Analytics by showing the correlations that can be done for more complex trading flows, in this case, a Foreign Exchange (FX) Business flow. This is an example of the type of complex flow with bespoke correlation and association rules that Beeks Analytics for Enterprise is designed to support.
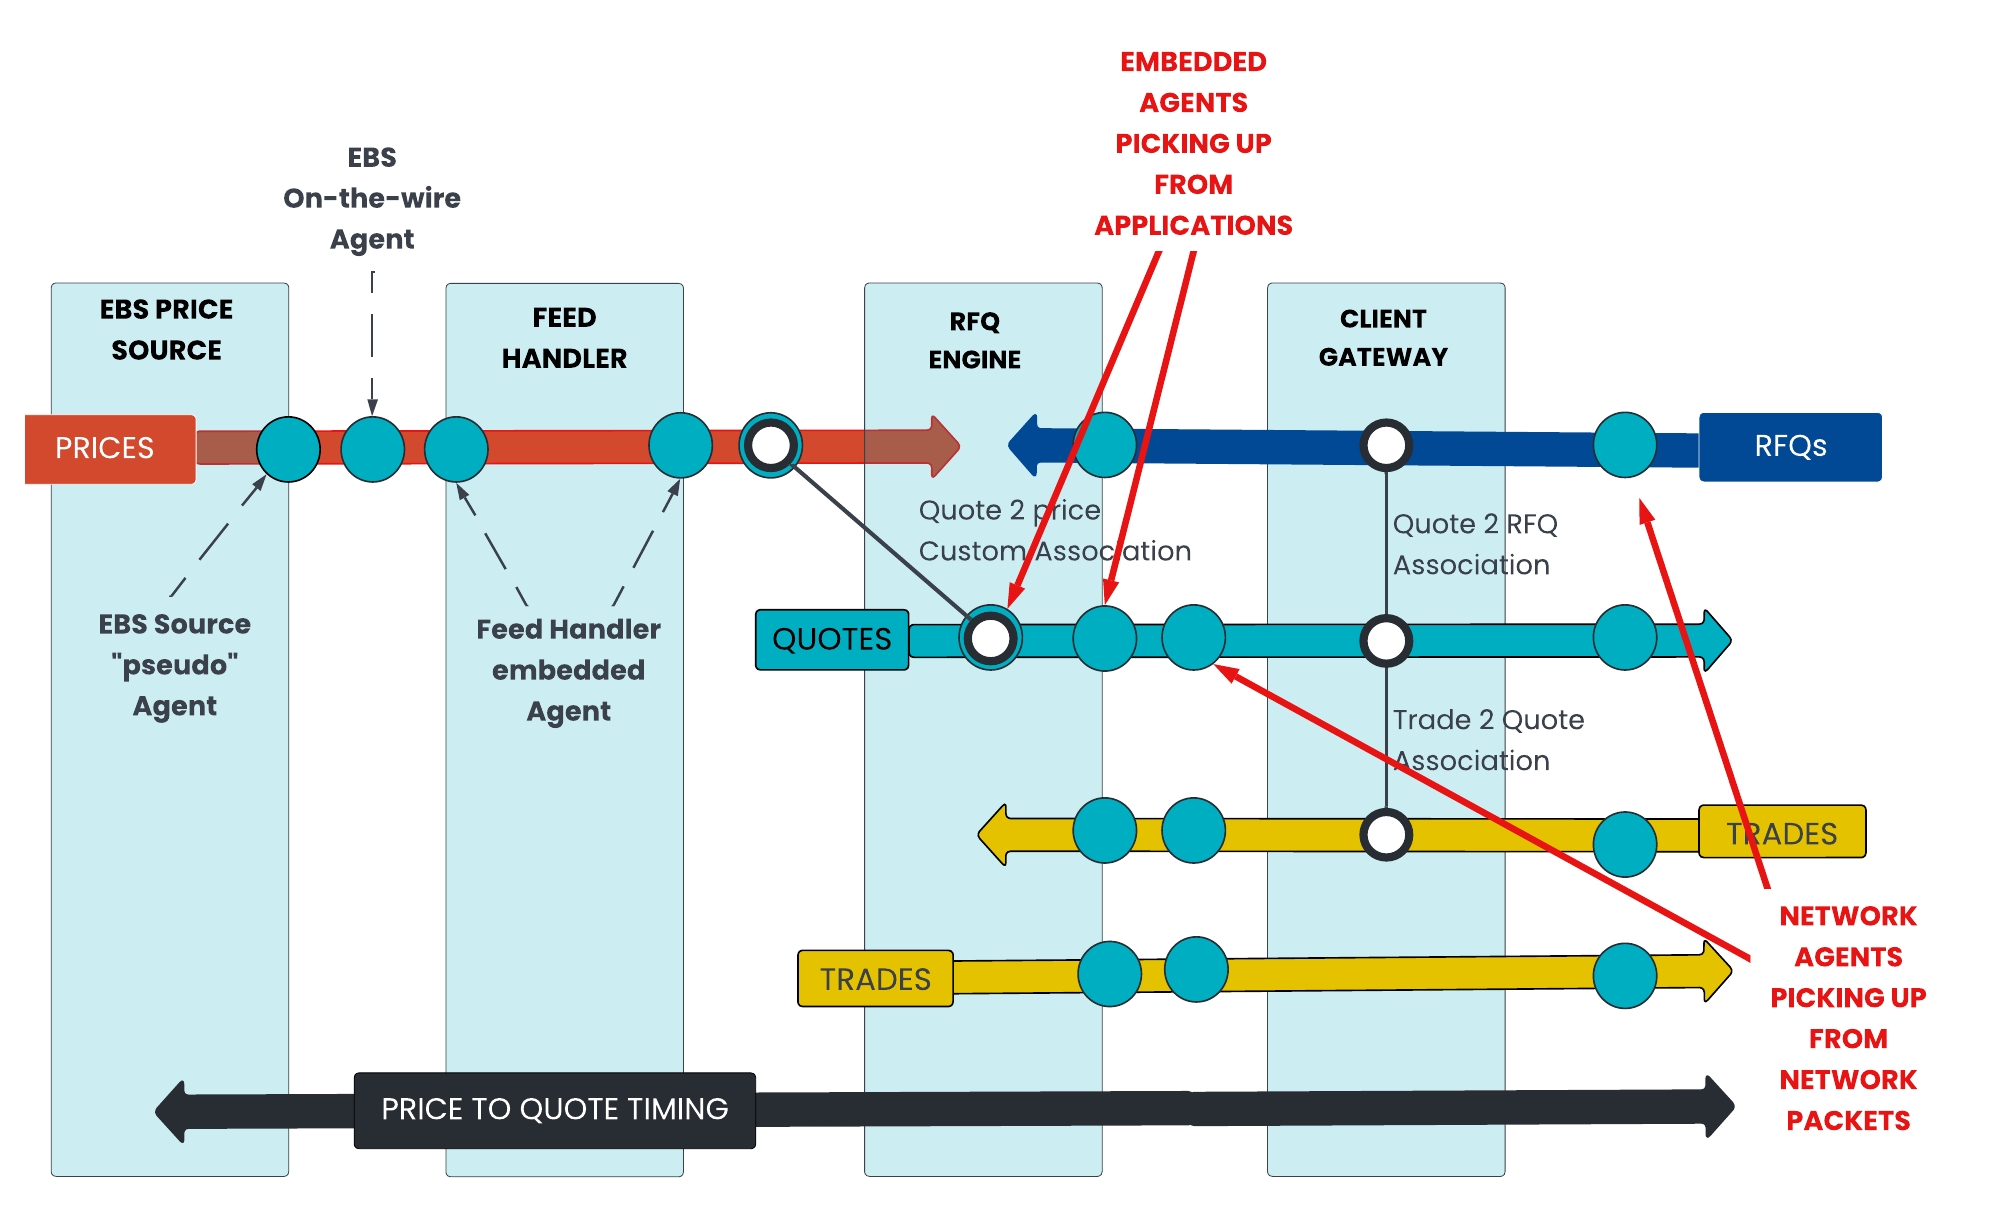
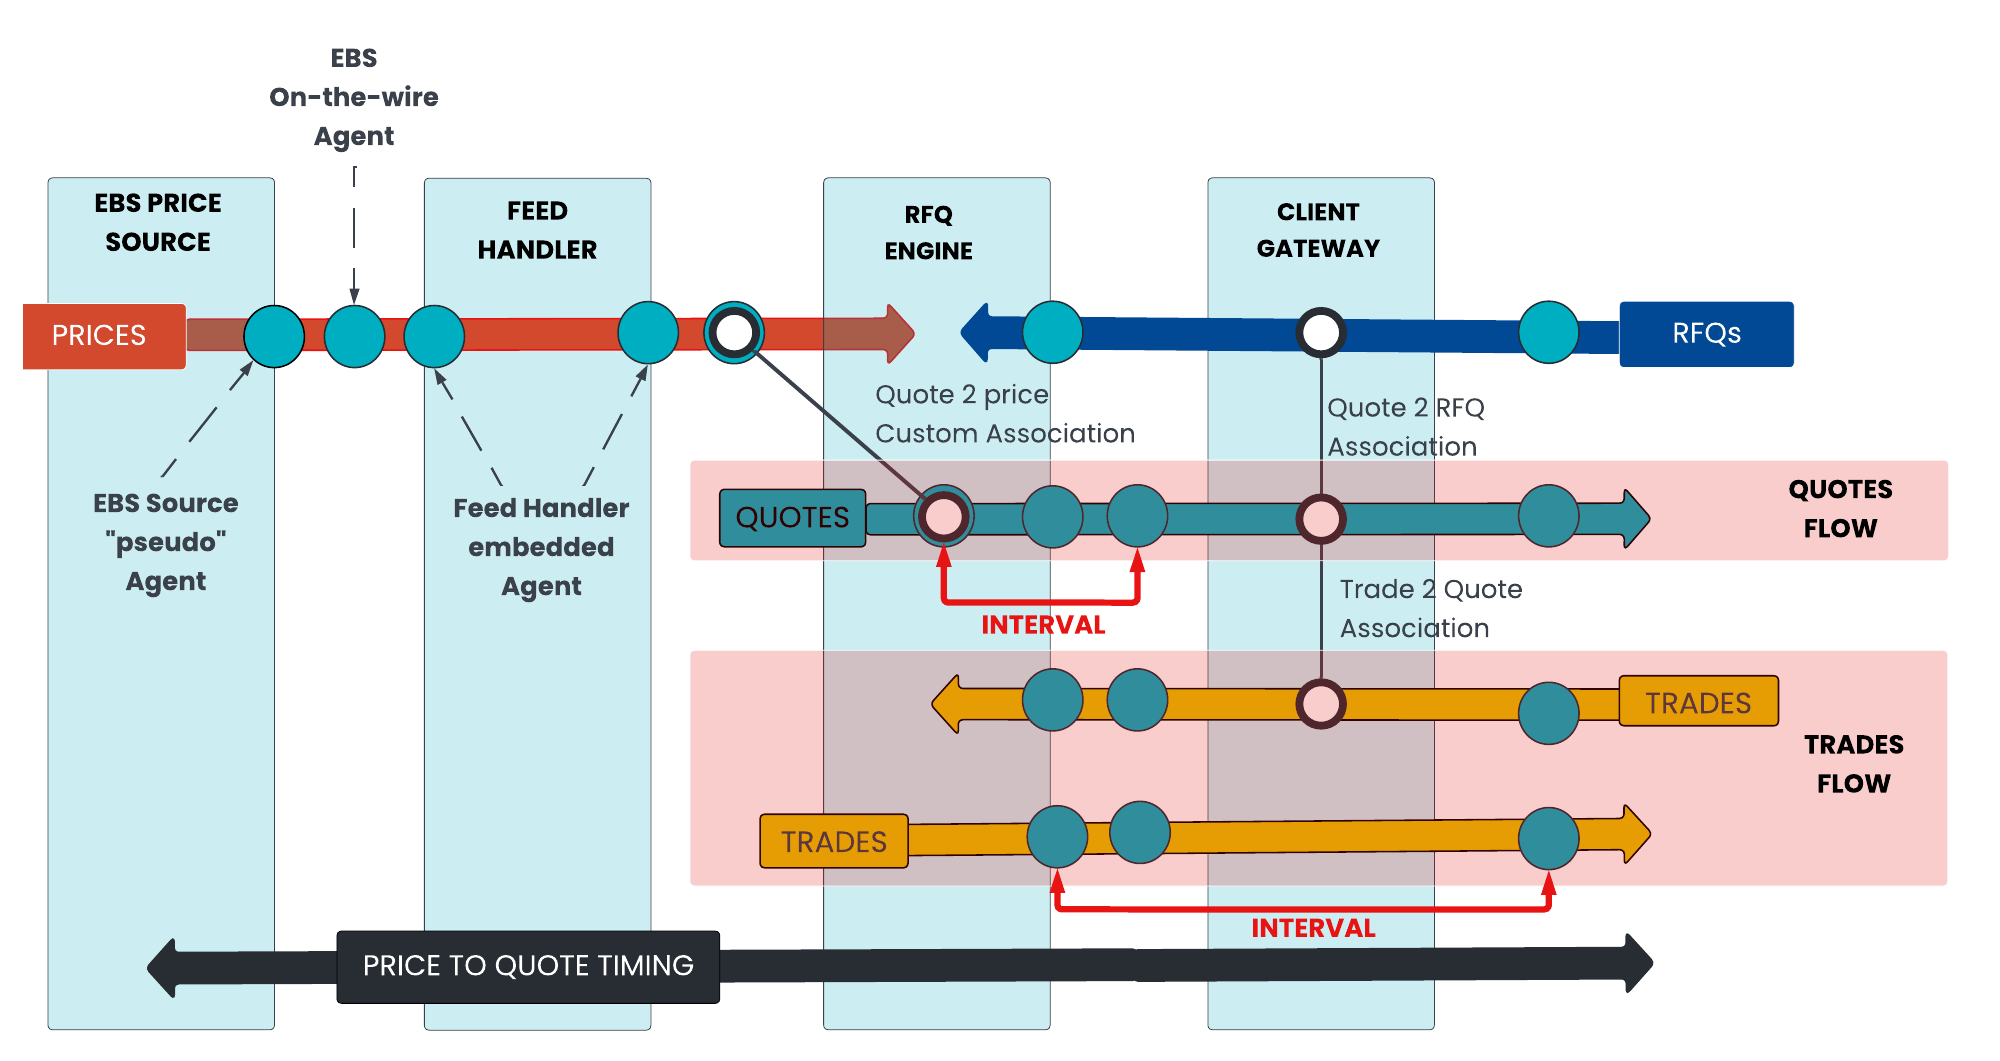
In this example:
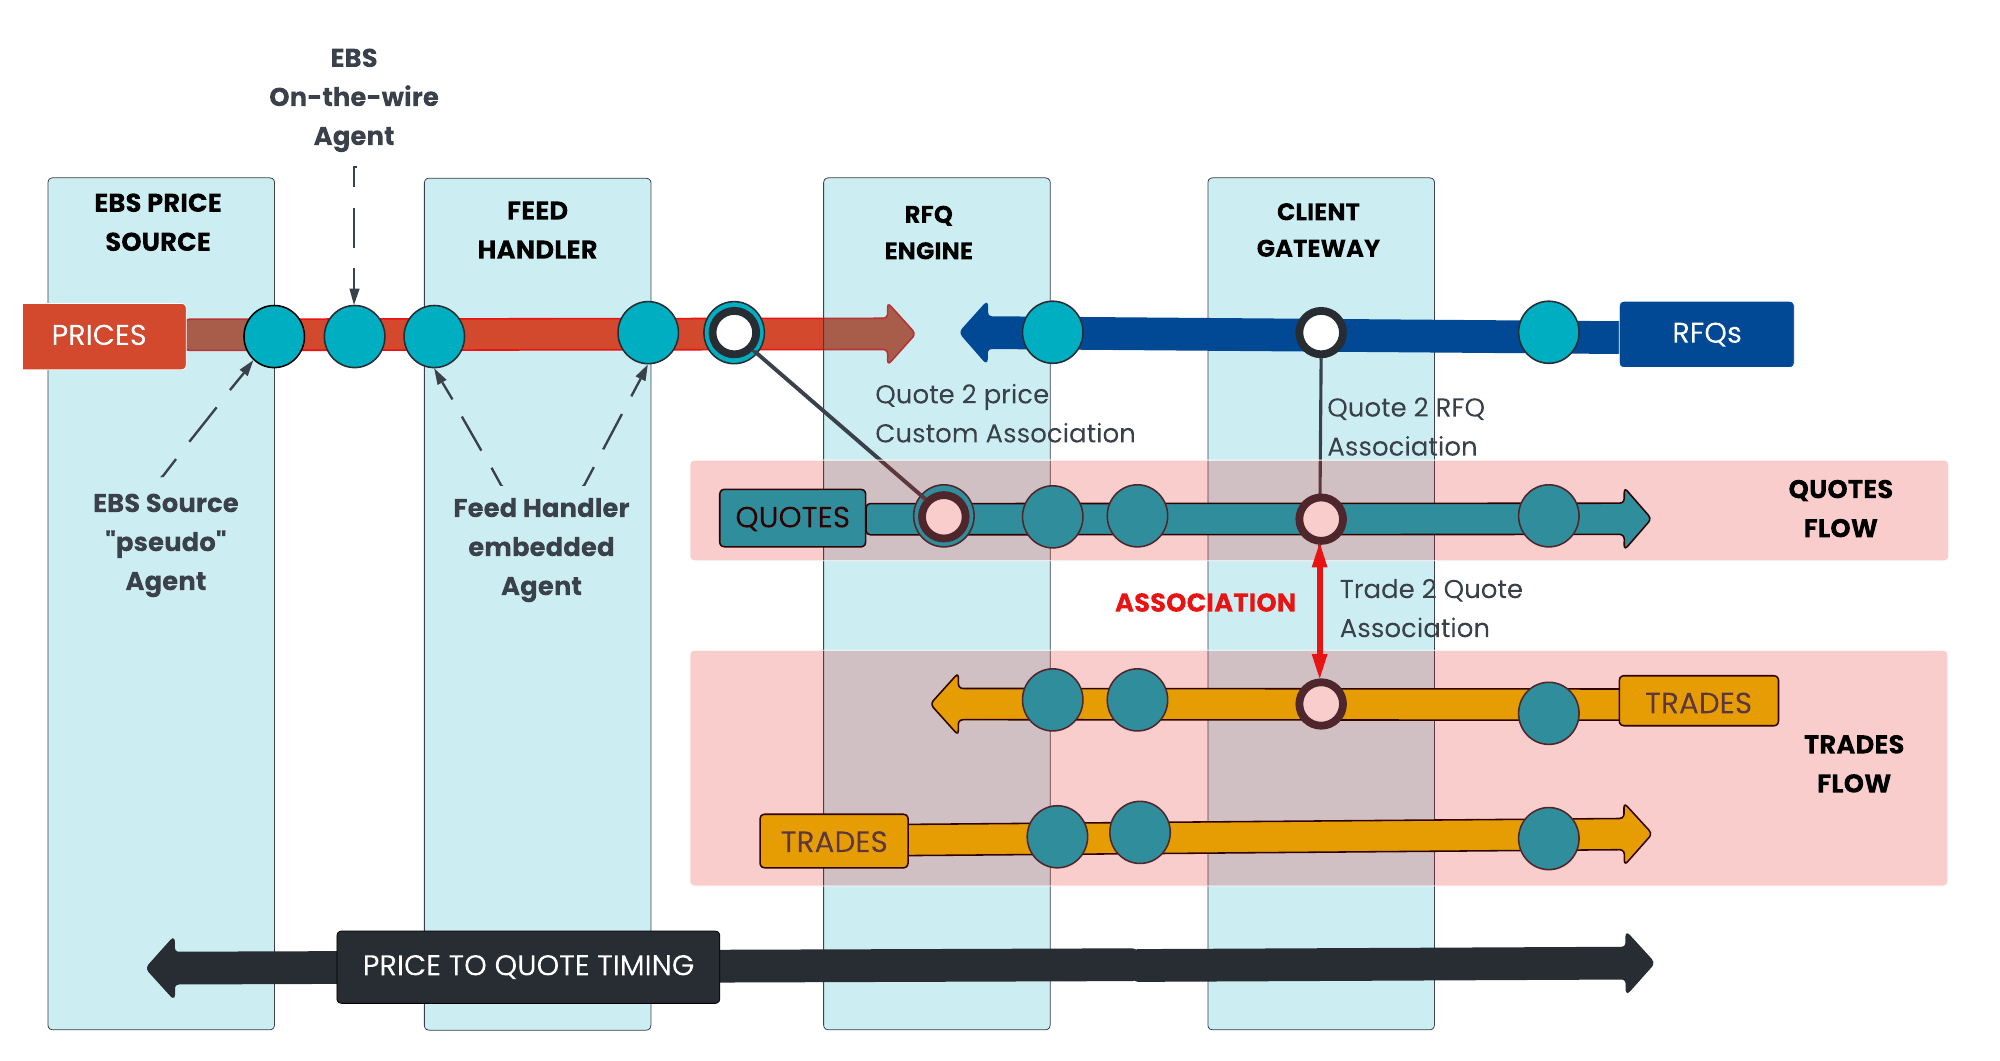
Prices come in from the outside markets to inform the bank pricing engine of where the market is at that time.
The bank receives Requests for Quote (RFQ) from their clients. These RFQs will typically indicate the instrument that the client wants to trade, and the quantity that they want to trade.
In response to these RFQs, they will issue one or more Quotes back to the client.
If a client wants to trade on that Quote, they send a Trade Request.
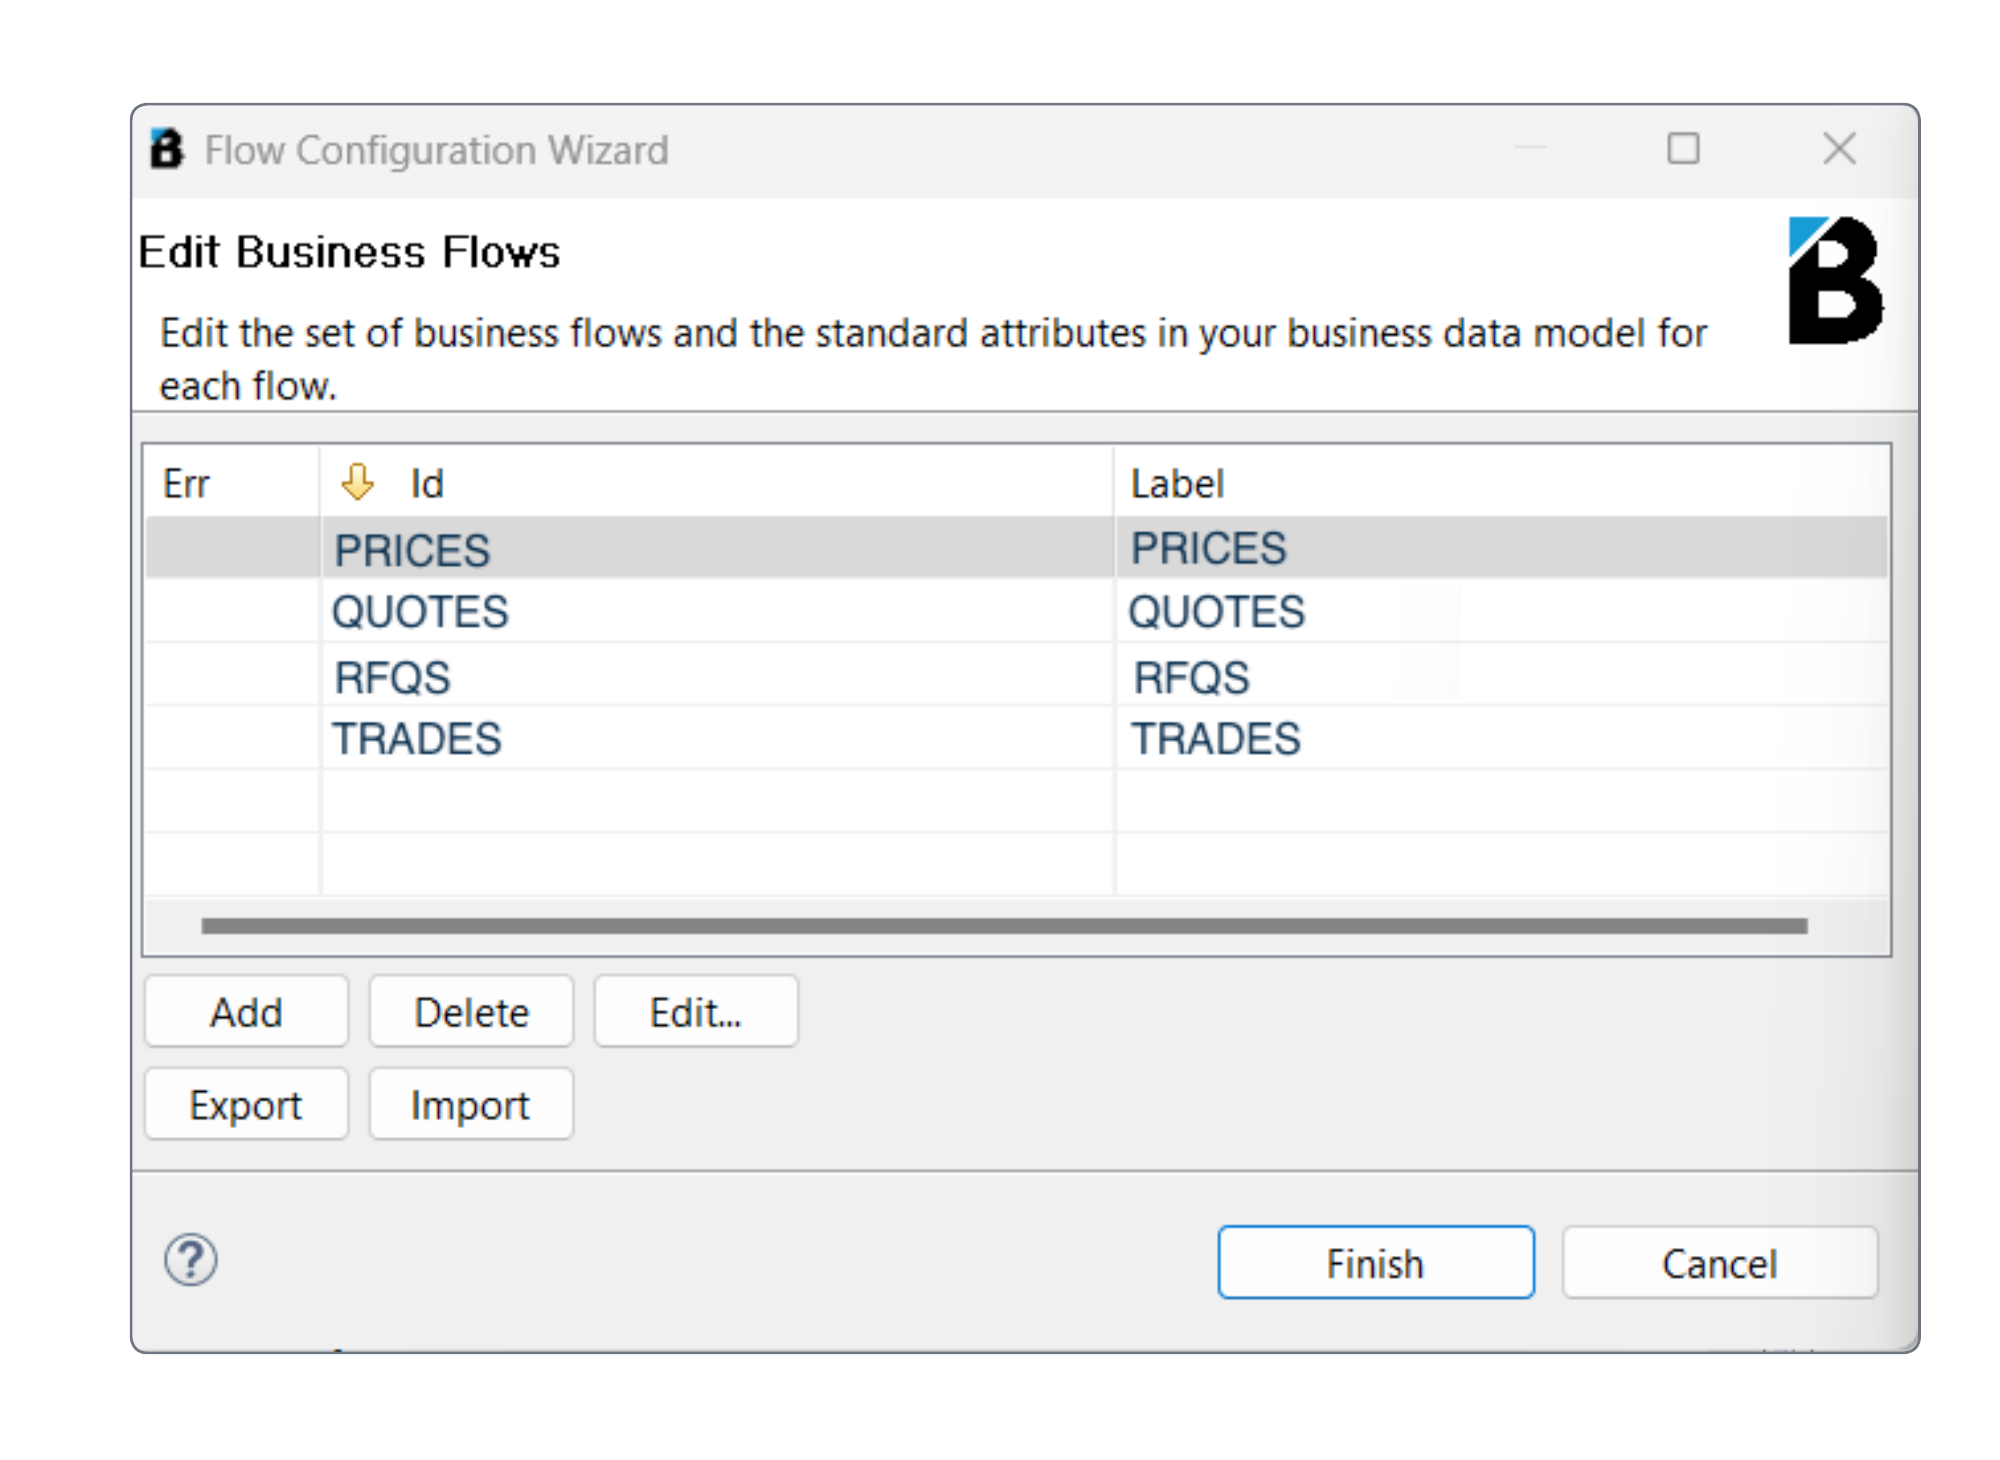
We model this in VMX-Analysis by configuring four different types of business object:
Business Object | Purpose |
|---|---|
PRICES | Prices from Liquidity Provider or Venue. |
RFQs | Requests for Quote from a client. |
QUOTES | Quotes from the bank to their client. |
TRADES | Trade requests and confirmation between the bank and their client. |
We create a flow for each type of business object. The flow represents the business object’s journey through a series of monitoring points. For example, you could be looking at a price update seen at three or four different points within your application infrastructure.
Defining the flows in the Flow Configuration Wizard
In the VMX-AdminConsole, select the Business Flows wizard to open the Edit Business Flows modal.

To view or edit the flow for a business object, double-click it to open the Flow Configuration Wizard.
We’ll start by double-clicking Trades.
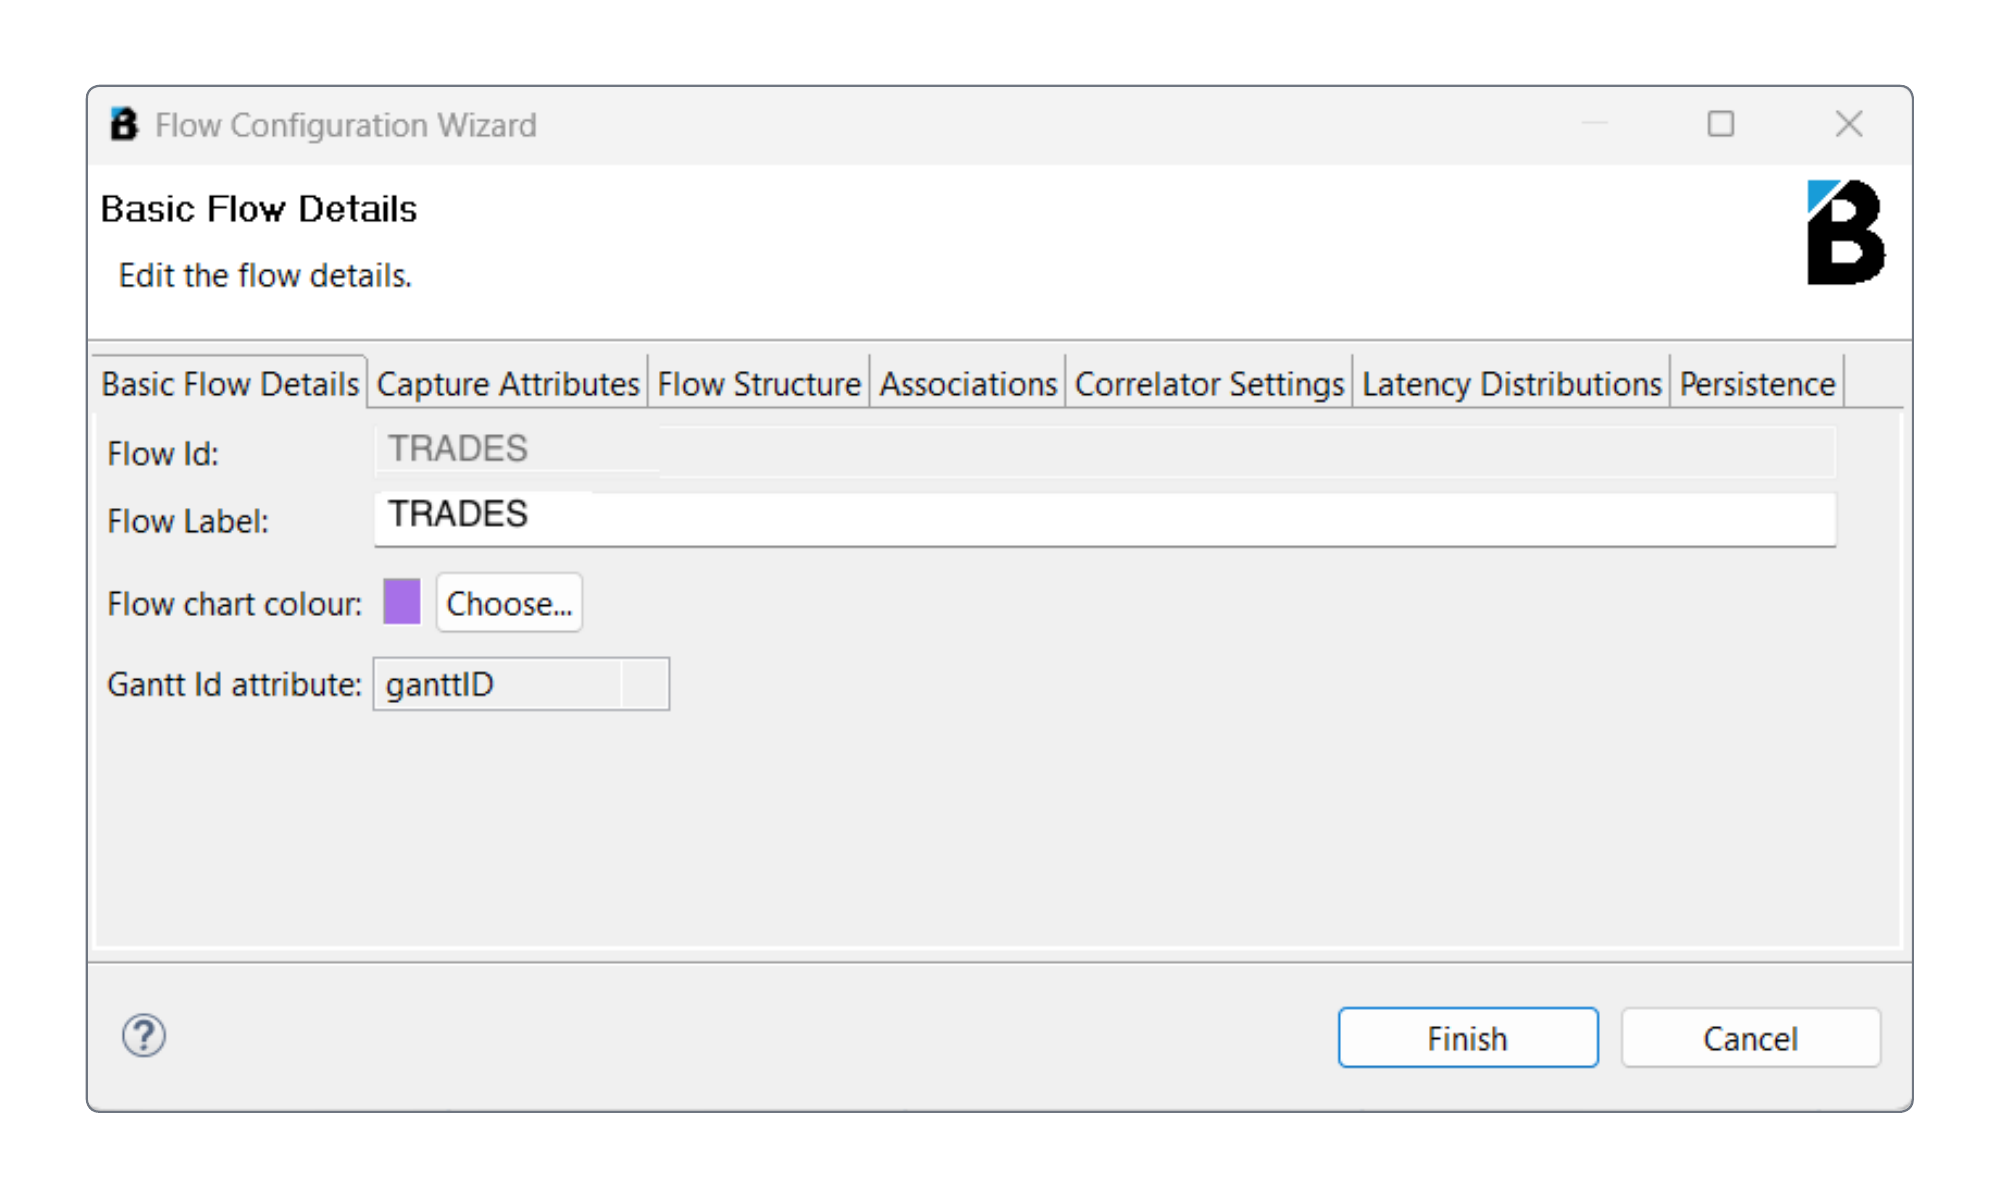
Defining the basic flow details
The Flow Configuration Wizard opens on the Basic Flow Details tab. The key values here are the Flow ID and the Flow Label.
The Flow ID cannot be altered once the flow has been setup. However, you can come back and edit your Flow Label at any point.
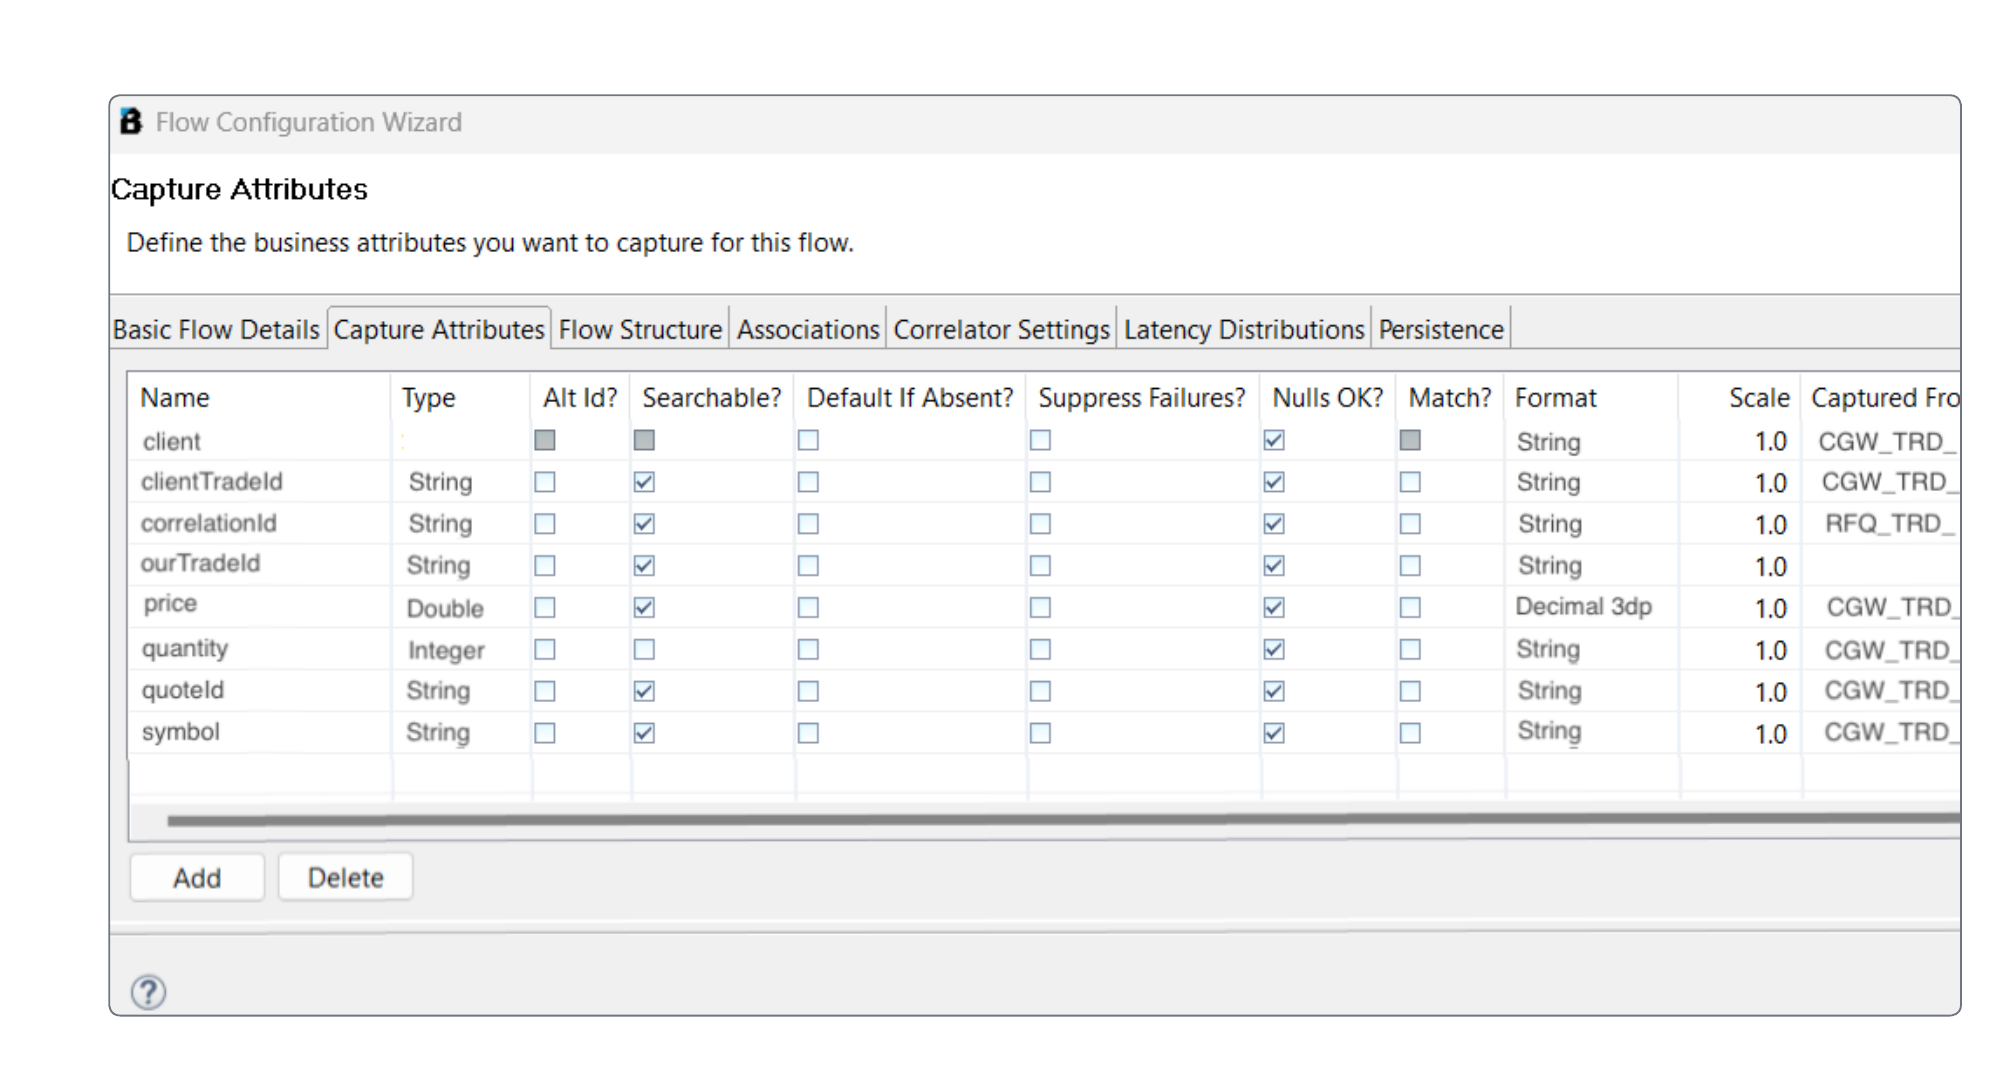
Defining what data will be captured
Next we’ll open the Capture Attributes tab and define flow attributes that support the data model that we want to capture. For each flow, Beeks Analytics allows you to define any data model (as long as the data exists) in order to support a wide range of business scenarios. Essentially, each business object is modelled as a bag of named attributes, strings, doubles, integers.
In the example below, we’ve modelled the capture attributes that we want to capture for Trades.
These are:
client
An identifier for the client.clientTraderId
This ID is assigned to the trade message by the client when they've decided they want to trade with you.CorrelationId
The primary identifier for the trade in Beeks Analytics.ourTradeId
An ID that the system we’re monitoring assigns to the trade.price
The price in the trade.quantity
The quantity in the trade.quoteId
An ID for the quote that’s sent back to the client.symbol
The currency symbol.
Capture attributes that identify the trade
The most critical capture attribute is the correlationId. This is the unique identifier for an item in Beeks Analytics. We use correlationId to identify a trade when we're matching and also when we store it in the databases.
Another significant capture attribute is clientTradeId, which is an alternative identifier (“Alt ID“) for the trade. The client may use the clientTradeId to identify the trade in support tickets or trade reconciliation conversations. We’ll use the clientTradeId later on in this example to try to match the trade.
To flag a capture attribute as an alternative identifier, tick the checkbox for that attribute in the Alt ID column.
ourTradeId is another alternative identifier that will be in the messages at some of the points we’re monitoring.
We’ll also flag the quoteId and symbol as “searchable properties”. This means they will be indexed for searching, both by the end user and also allowing them to be used internally to associate items (e.g. tie together a particular trade and its original quote). This tie is known as Association, and is distinct from Correlation because Correlation groups multiple Agent Events into a single Business Object (“Item”), whereas Association groups multiple related Items together.
Capture attributes for analytics
As well as the identifiers described above, we’ll also use client, price and quantity in our data model. These aren’t relevant to performance analysis, but they are useful for higher-level business analysis and the client capture attribute allows us to break out the stats by client.
Defining the monitoring points
Next we’ll open the Flow Structure tab and define the monitoring points for the flow.
In the example below, CGW stands for ‘Client Gateway’ and RFQ is shorthand for the ‘RFQ Engine’.
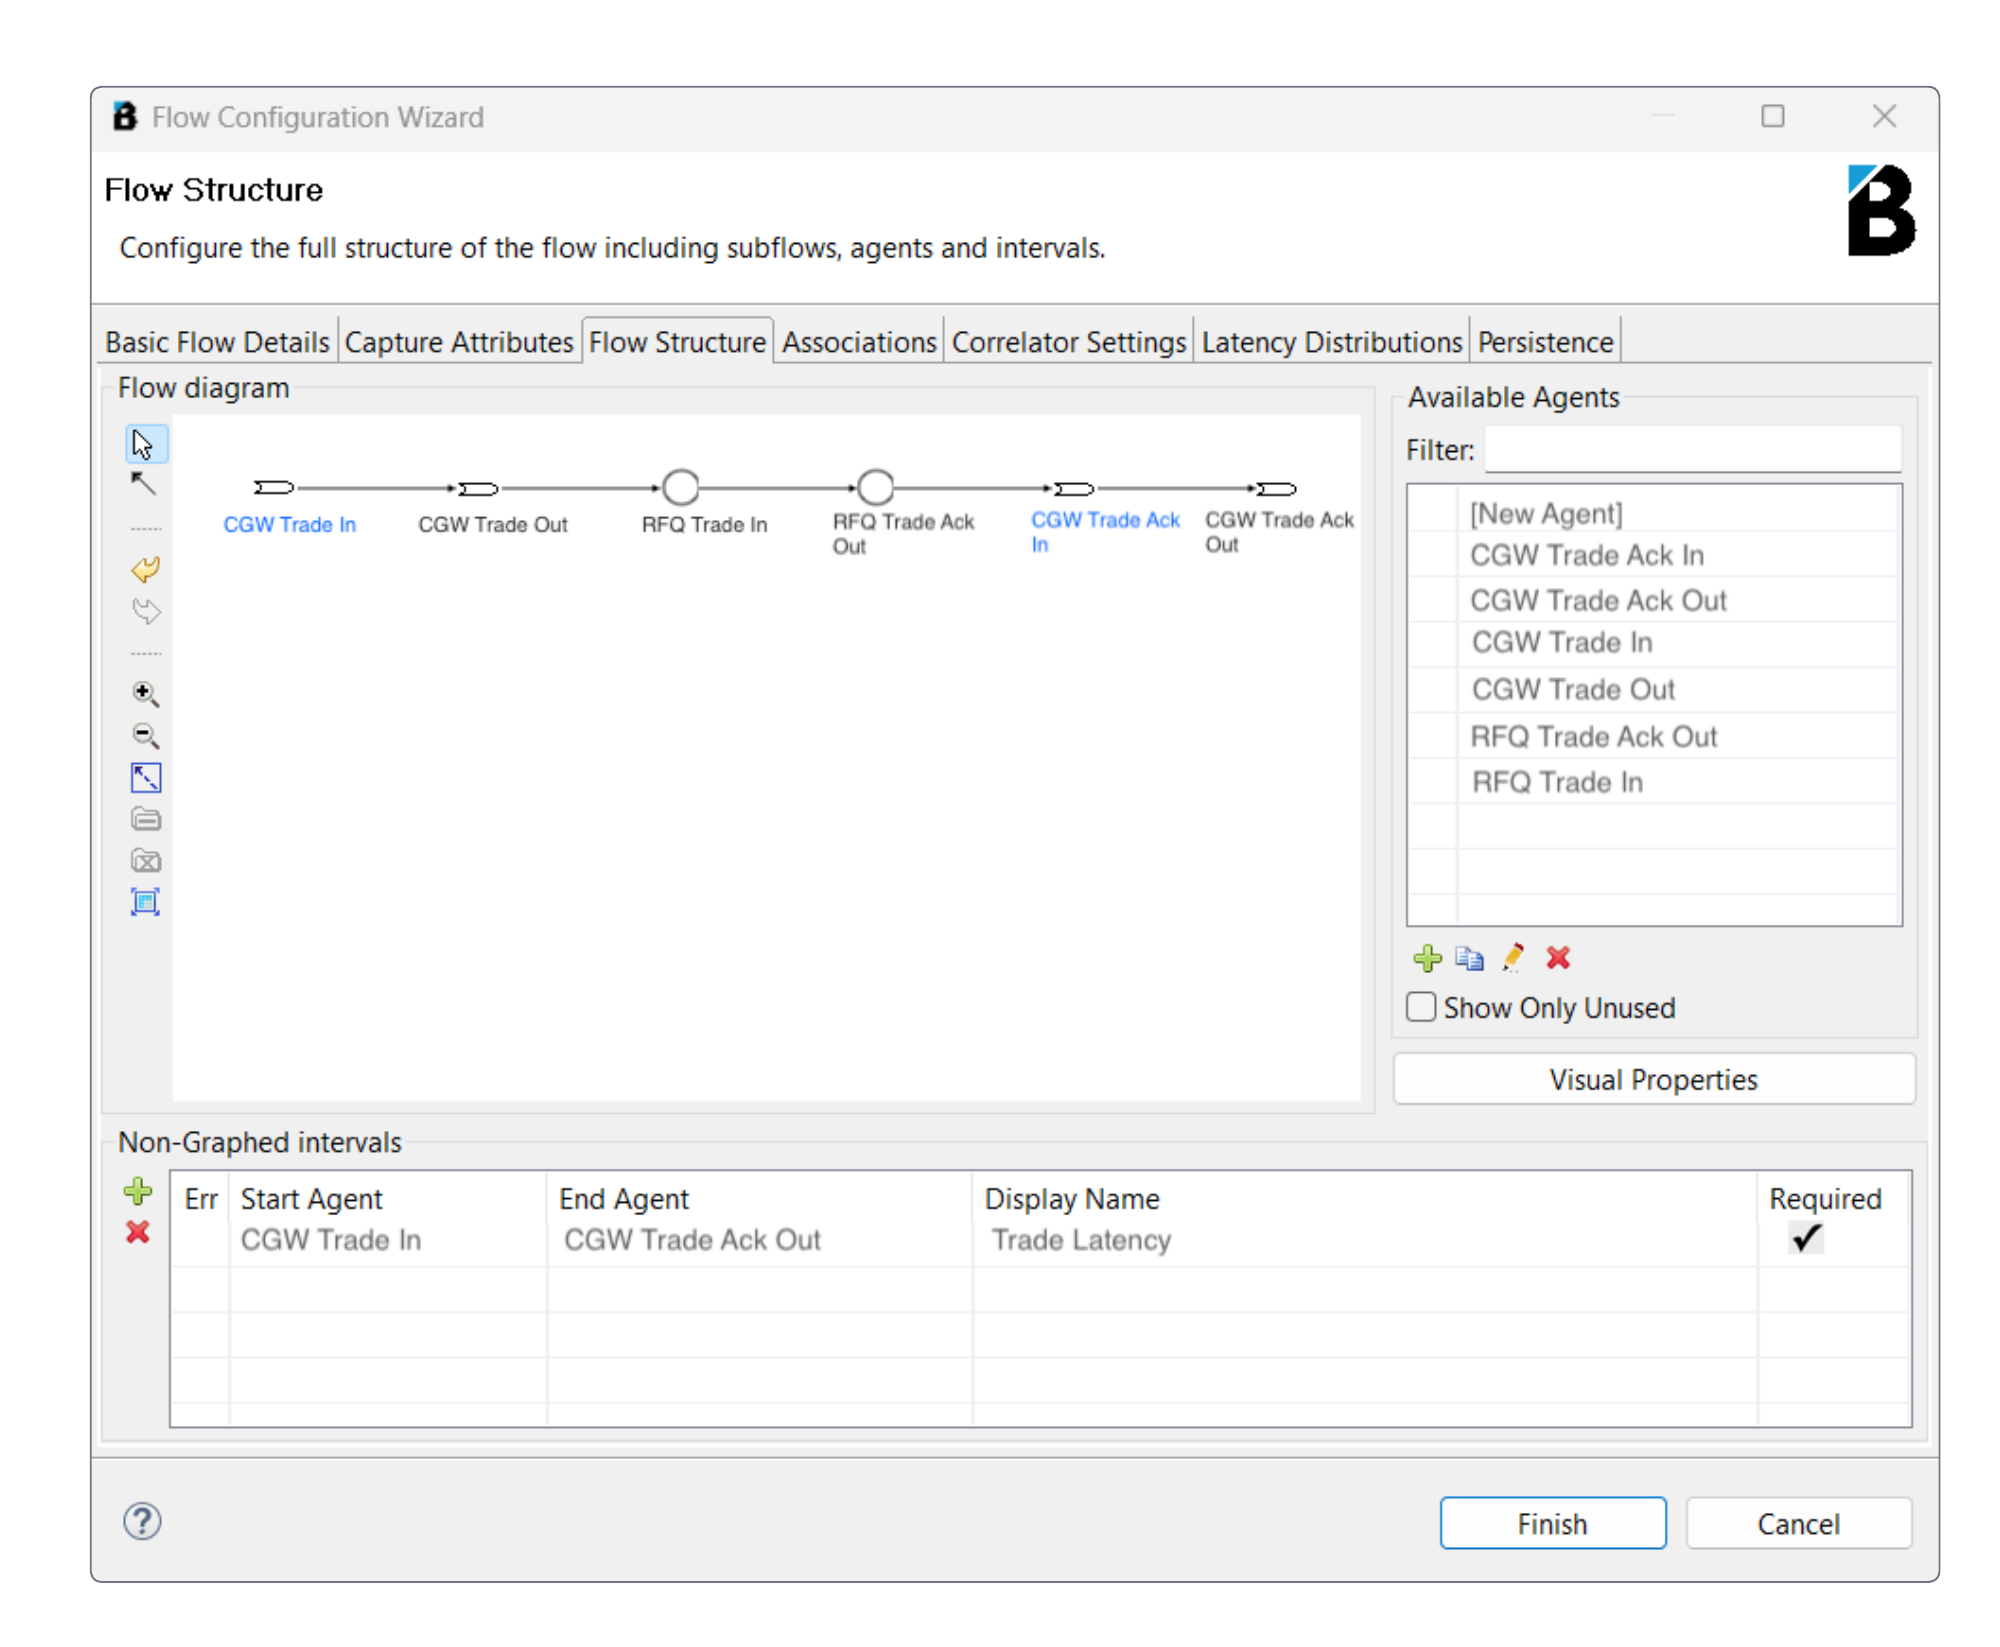
In the example, we have defined 6 monitoring points for this flow:
CGW Trade In
The trade come in at the client gateway.CGW Trade Out
The trade goes out through the client gateway.RFQ Trade In
The trade reaches the RFQ Engine.RFQ Trade ACK Out
The RFQ engine sends an acknowledgement of the trade.CGW Trade ACK In
The acknowledgement reaches the client gateway.CGW Trade ACK Out
The acknowledgement leaves the client gateway and goes to the client.
Each of these 6 monitoring points contains an Agent, so we refer to them as Agent Points. Double-clicking on any one of these Agent Points shows you more detail about it.
Setting the Agent Details
An Agent is an end point in VMX-Analysis, responsible for translating business data events from probes, and converting and mapping them to the capture attributes for the relevant flow.
VMX-Analysis supports a range of agent types. The most common types are agents that receive Agent Events and Statistics from VMX-Capture probes. These are called Network Agents because the information for this agent type comes from network packets.
The other most common type of agent are Embedded Agents, which pick out attributes from business objects that are moving around at key points of applications.
Double-click the Client Gateway Trade In Agent Point to open the Agent Details modal, which displays details about the Agent.
Basic Agent Details
The modal opens on the Basic Agent Details tab.
In the example, the following basic details are shown:
Agent ID
Not editable
Label
The agent is labelled CGW Trade In.
Subsystem
The agent is in the CGW subsystem
Location
The agent’s location is LDN.
Agent type
The type of agent is Network AgentThe Enable Agent checkbox is ticked, meaning that it is enabled for this flow.
Map Business Attributes
The Map Business Attributes tab allows us to select which attributes for the business object will be picked up at this Agent Point (in this case, from the network packet that is seen on the wire):
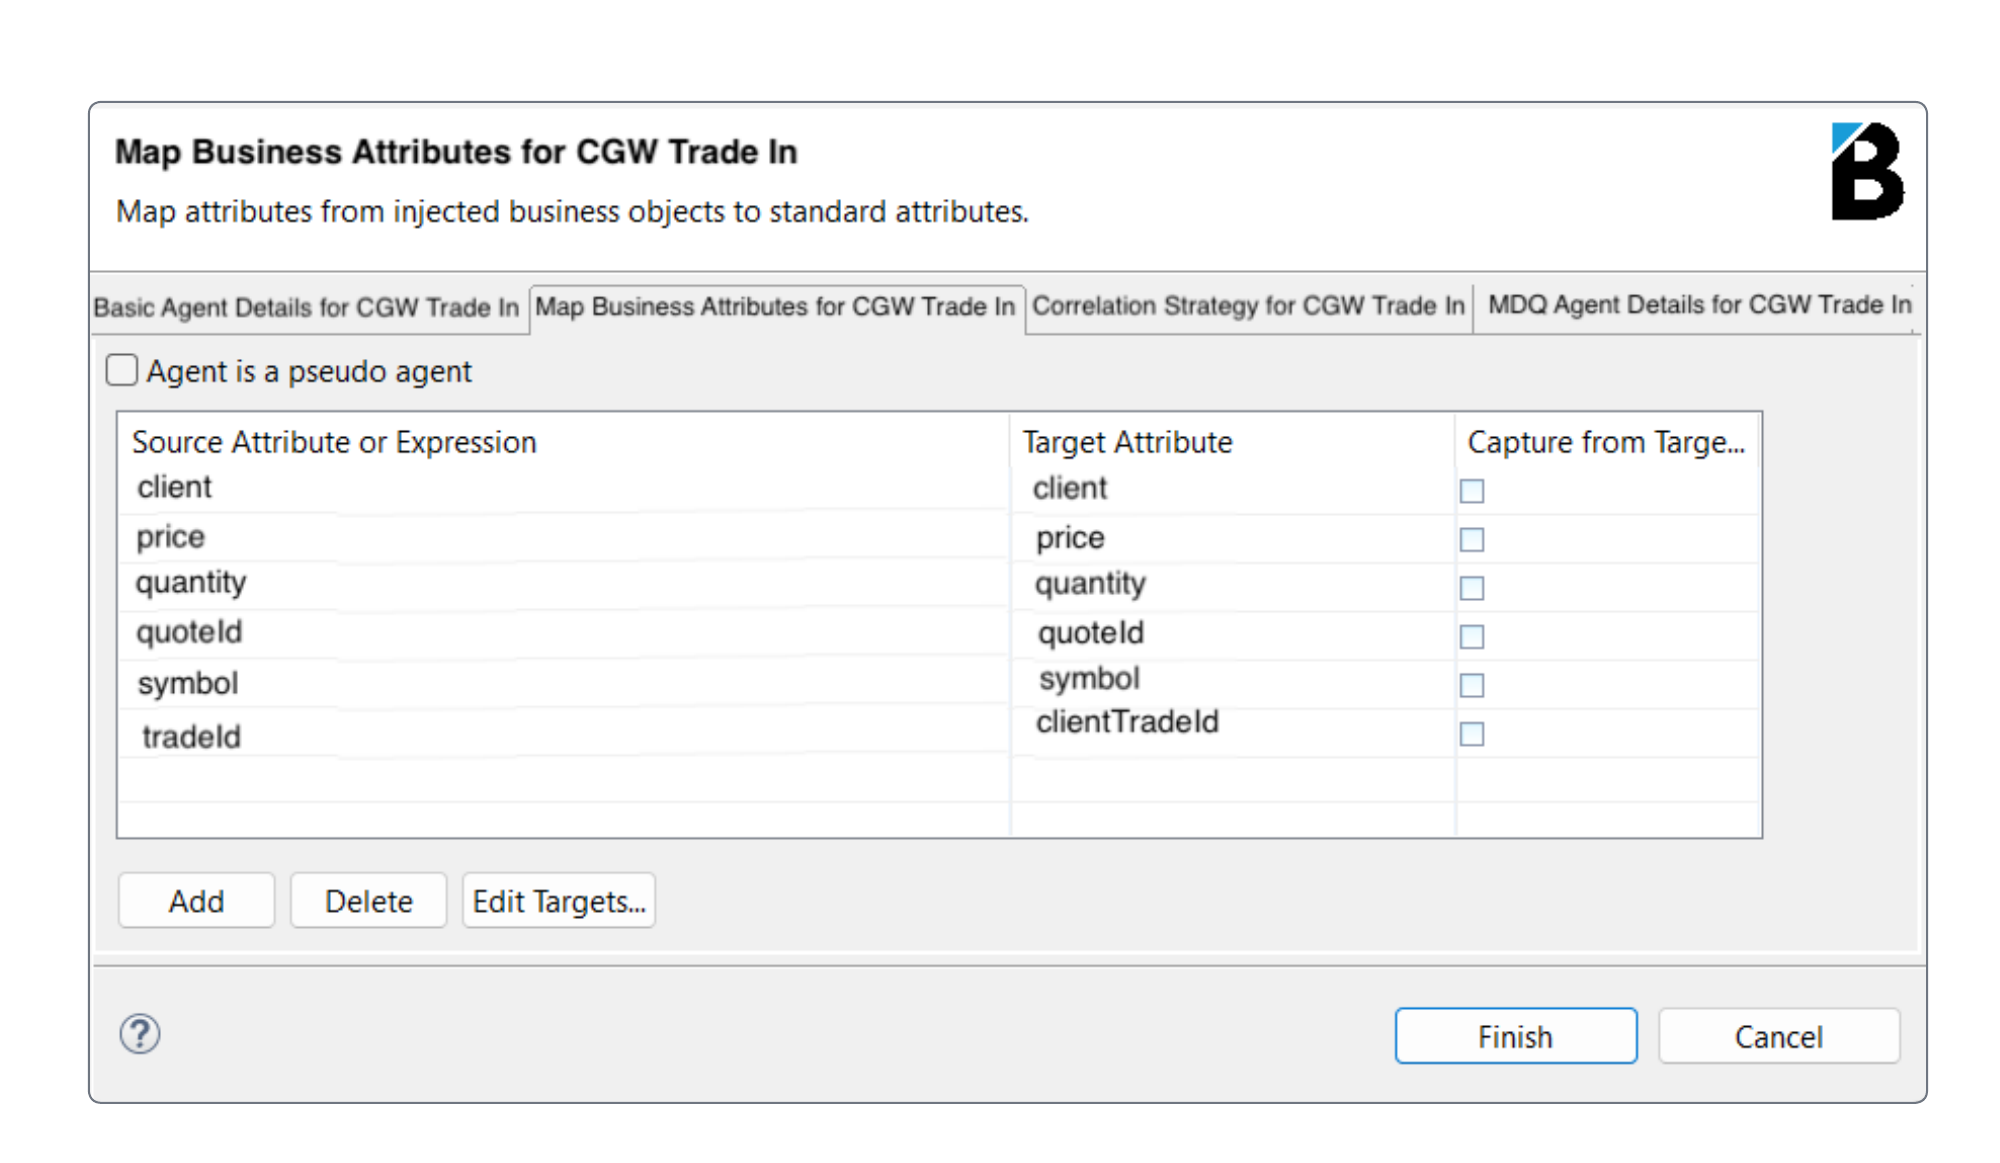
Source Attribute or Expression
This is how this attribute is seen in the original protocolTarget Attribute
The name of the attribute as it exists within our target canonical model for the flow.
This example demonstrates a very simple mapping; most of the properties in the Target Attribute column are the same as the properties in the Source. The only one that differs is tradeId in the Source, which is mapped to clientTradeID within our canonical model for the flow.
Mapping using VMX Expression Language (VEx)
In the previous mapping example, we show a very simple mapping where the Source Attributes map directly to Target Attributes. Where smarter mappings are required, you can use VEx expressions to manipulate and format source data, and map the output of the expression to to a Target Attribute. In the screen below, we show a VEx expression being used in the Source Attribute or Expression field for a mapping:
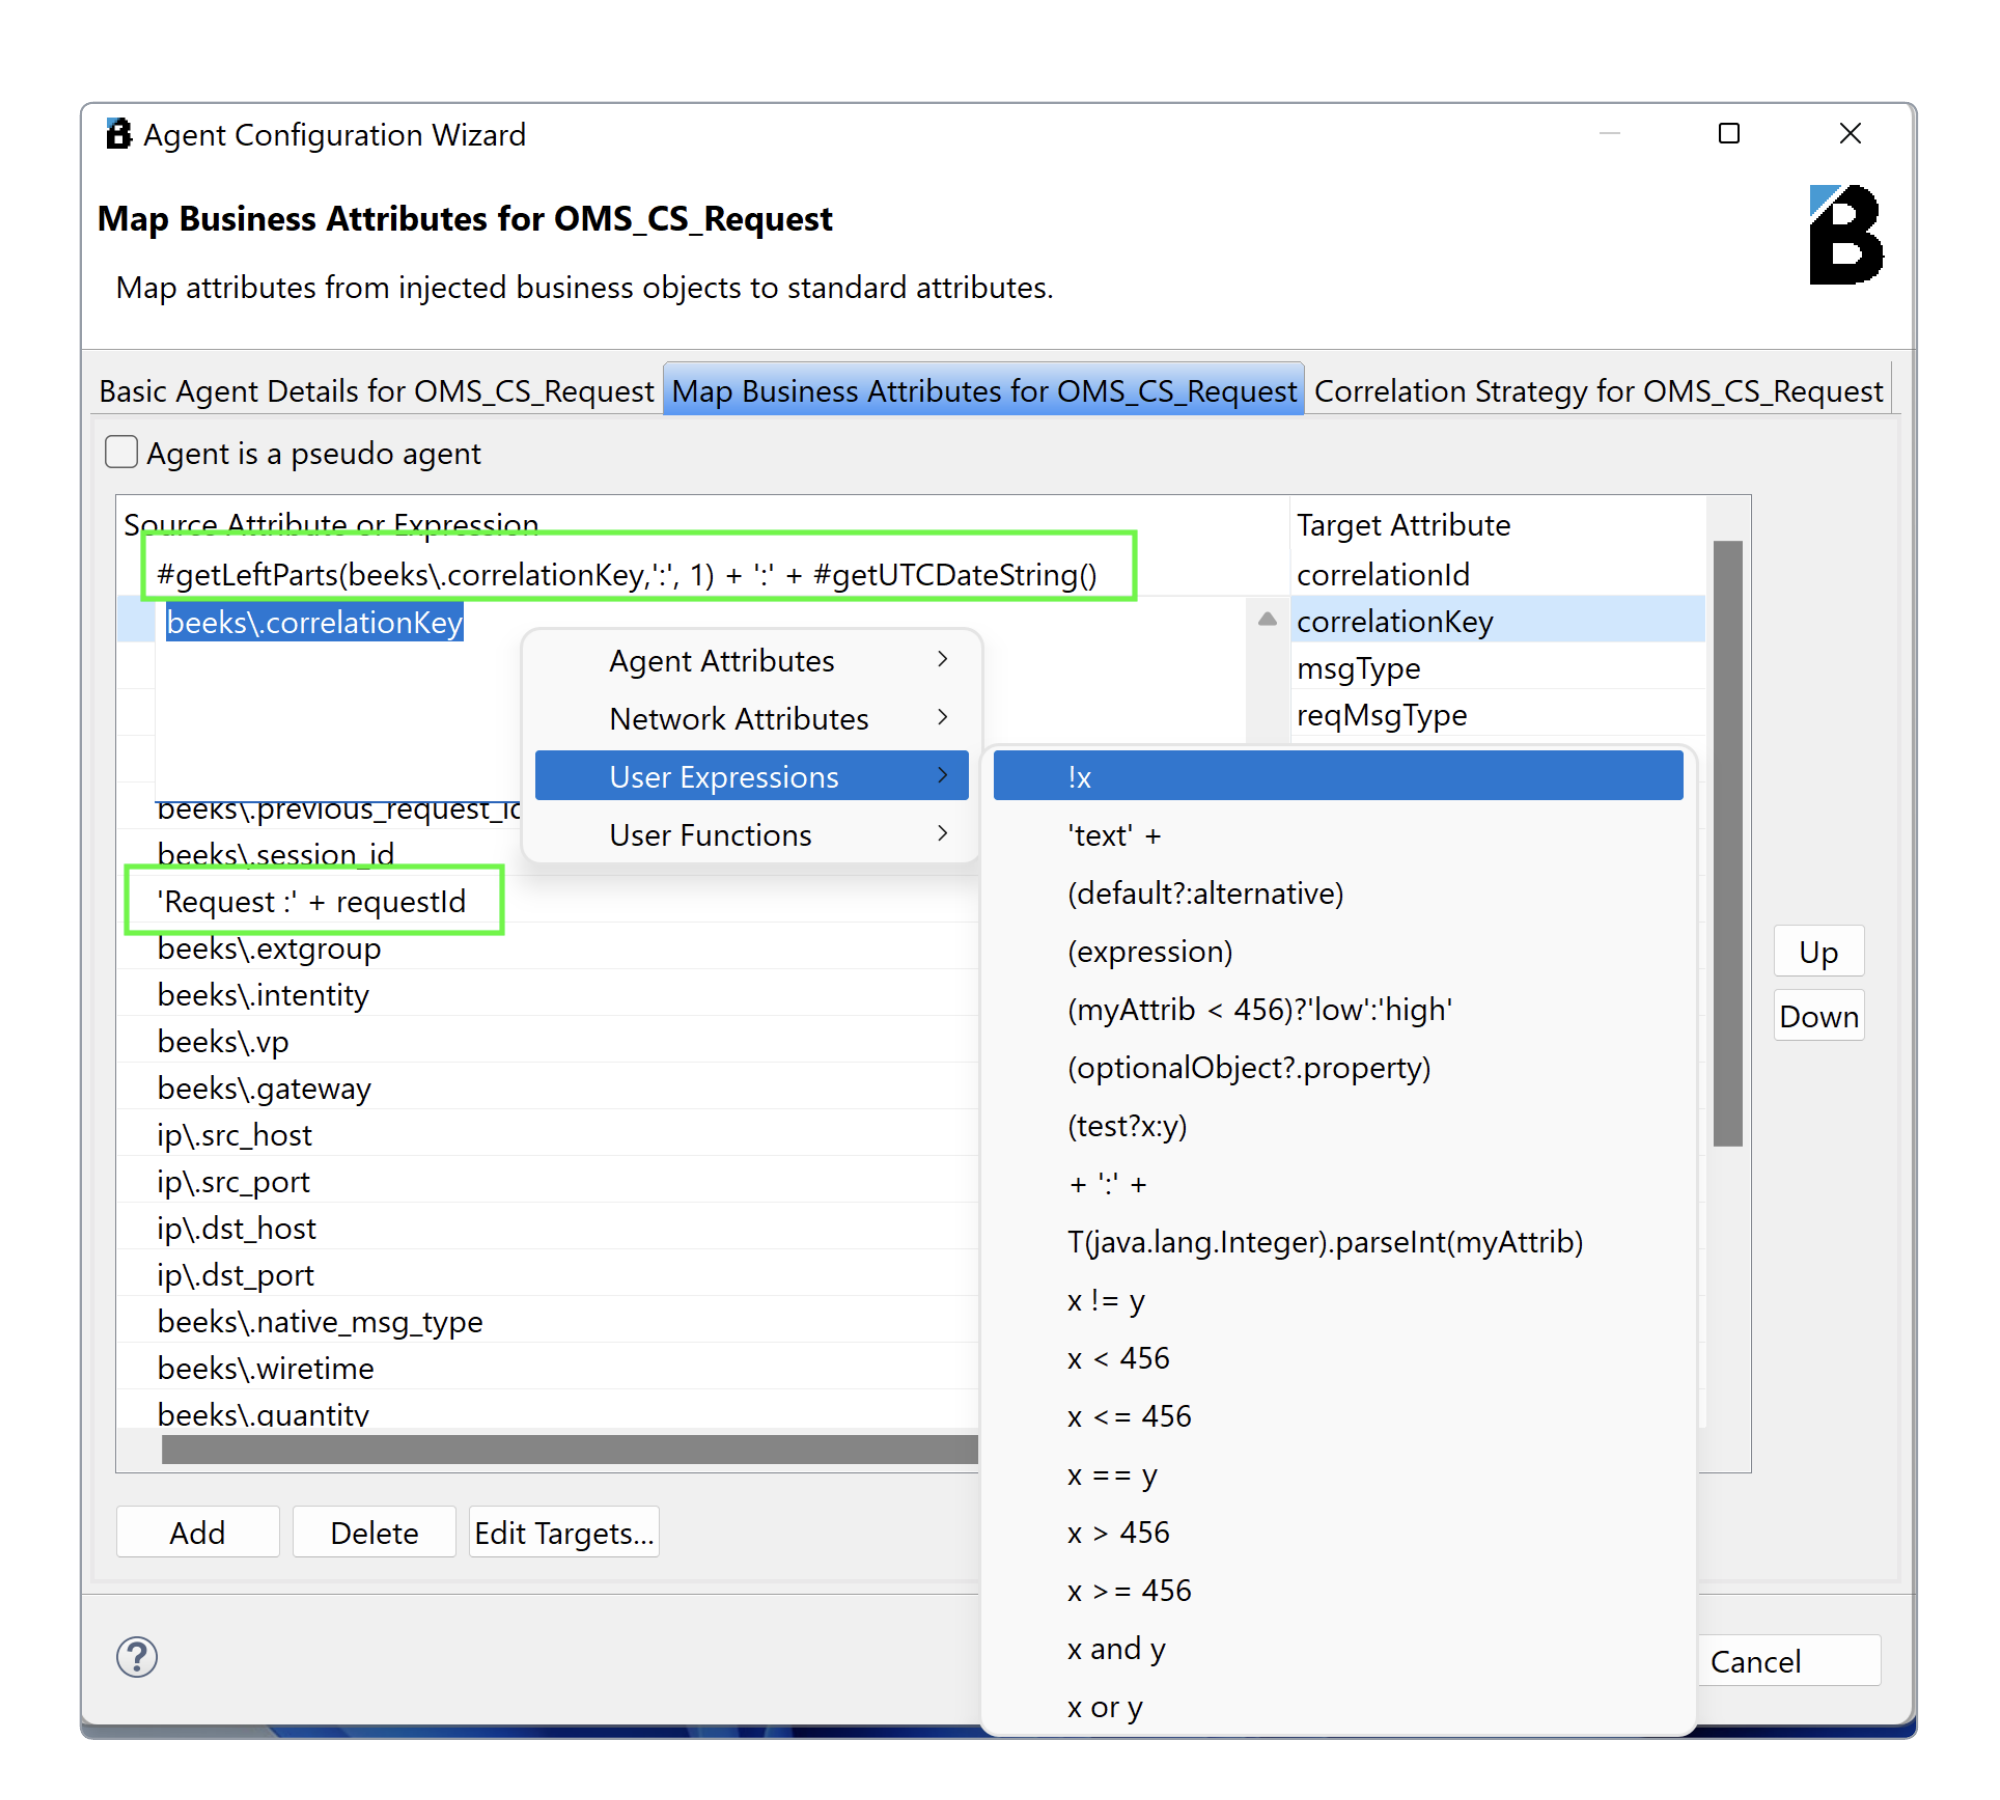
Adding a new mapping
Select Add to create a new row in the table.
Select the Target Attribute cell in the new row and select a target attribute from the list.
Select the Source Attribute or Expression cell in the new row, and either type in your VEx expression or right-click to display a menu of available source attributes and templated expressions that you can select and then edit if necessary.
Correlation Strategy
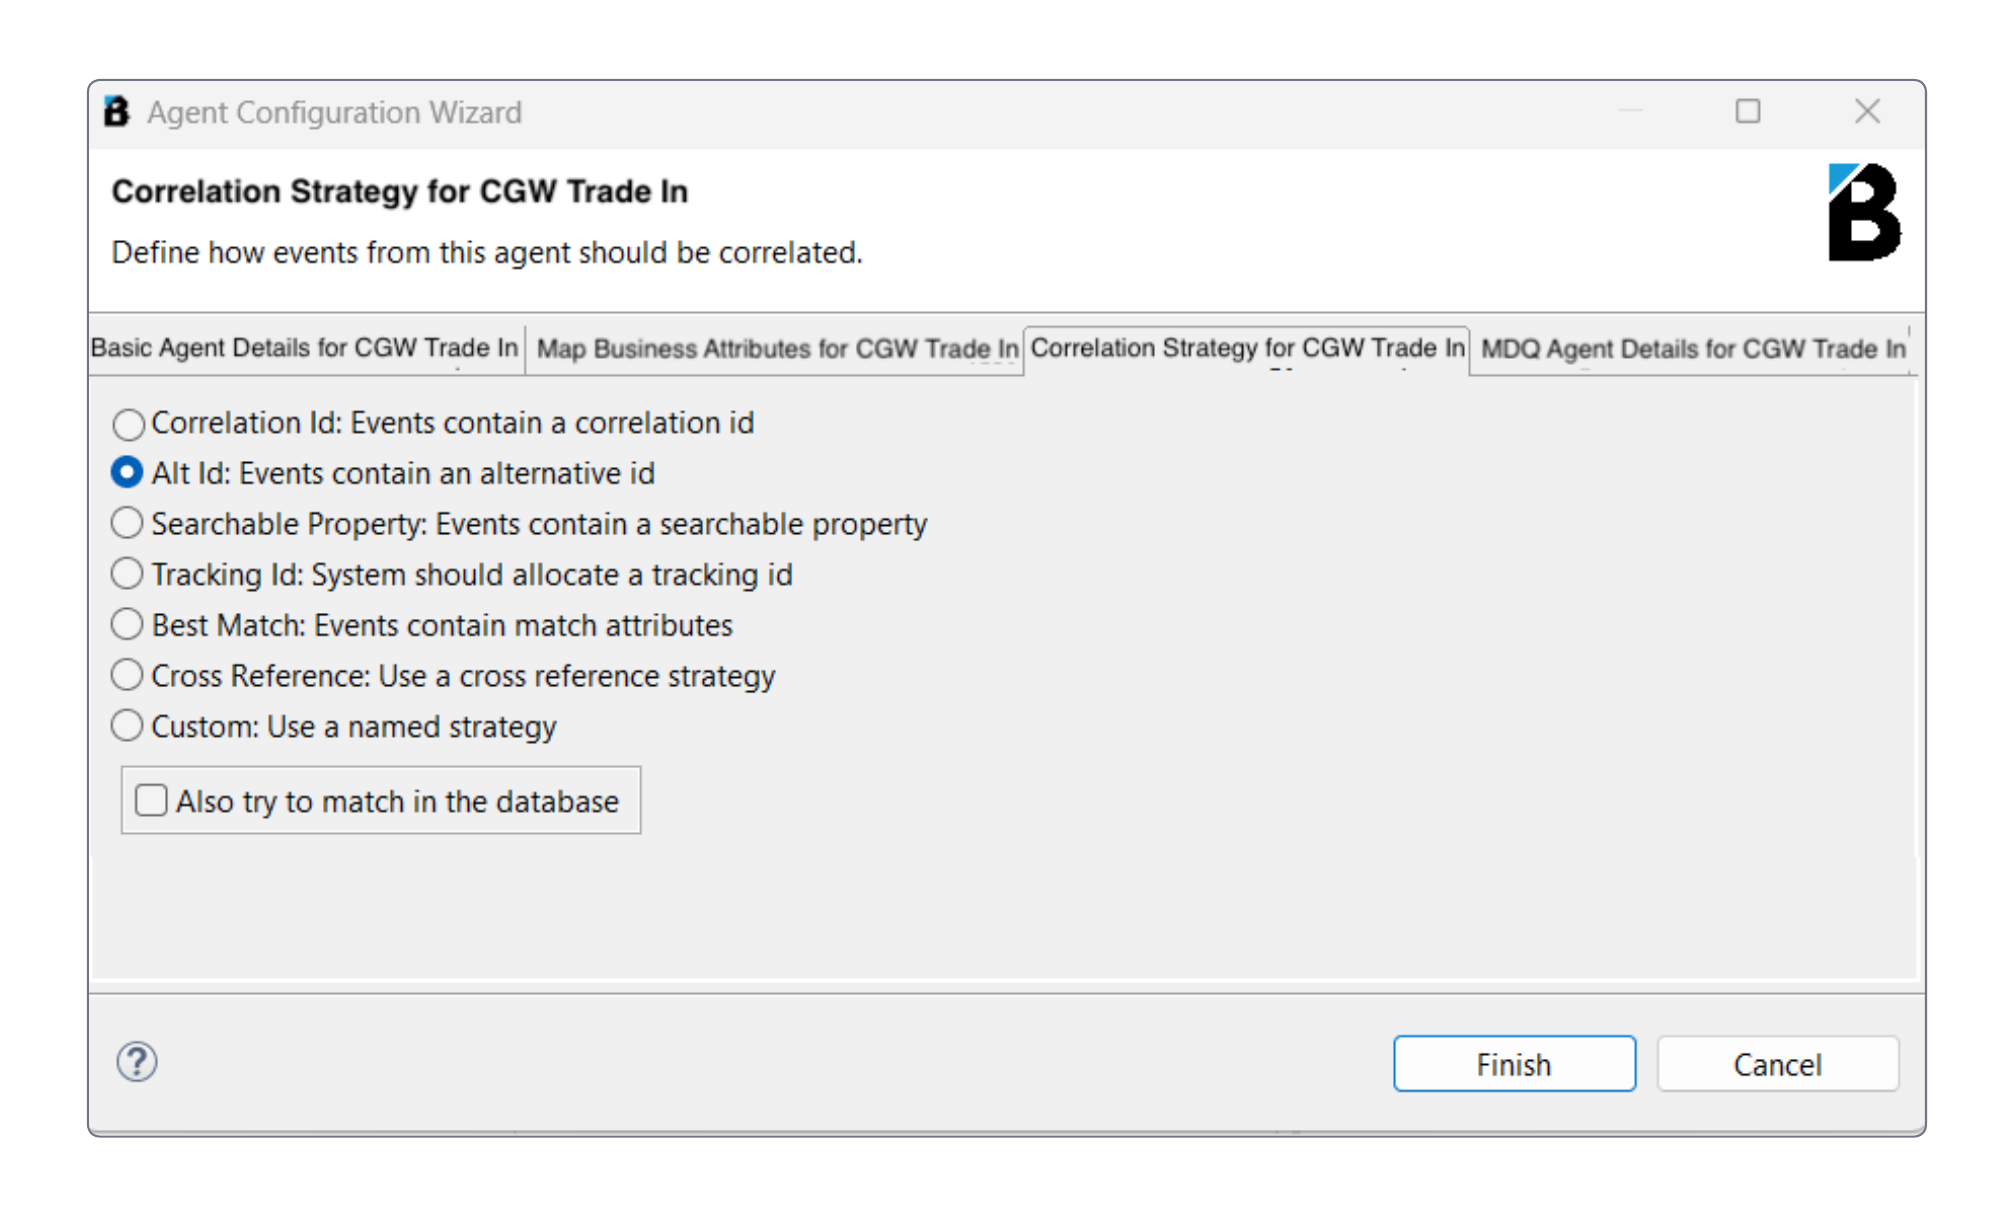
The Correlation Strategy tab allows you to select the correlation strategy used for this flow at this Agent Point. Choose from a range of strategies.
In this example, the Agent Point CGW Trade In uses the clientTradeId to identify messages for a given trade.
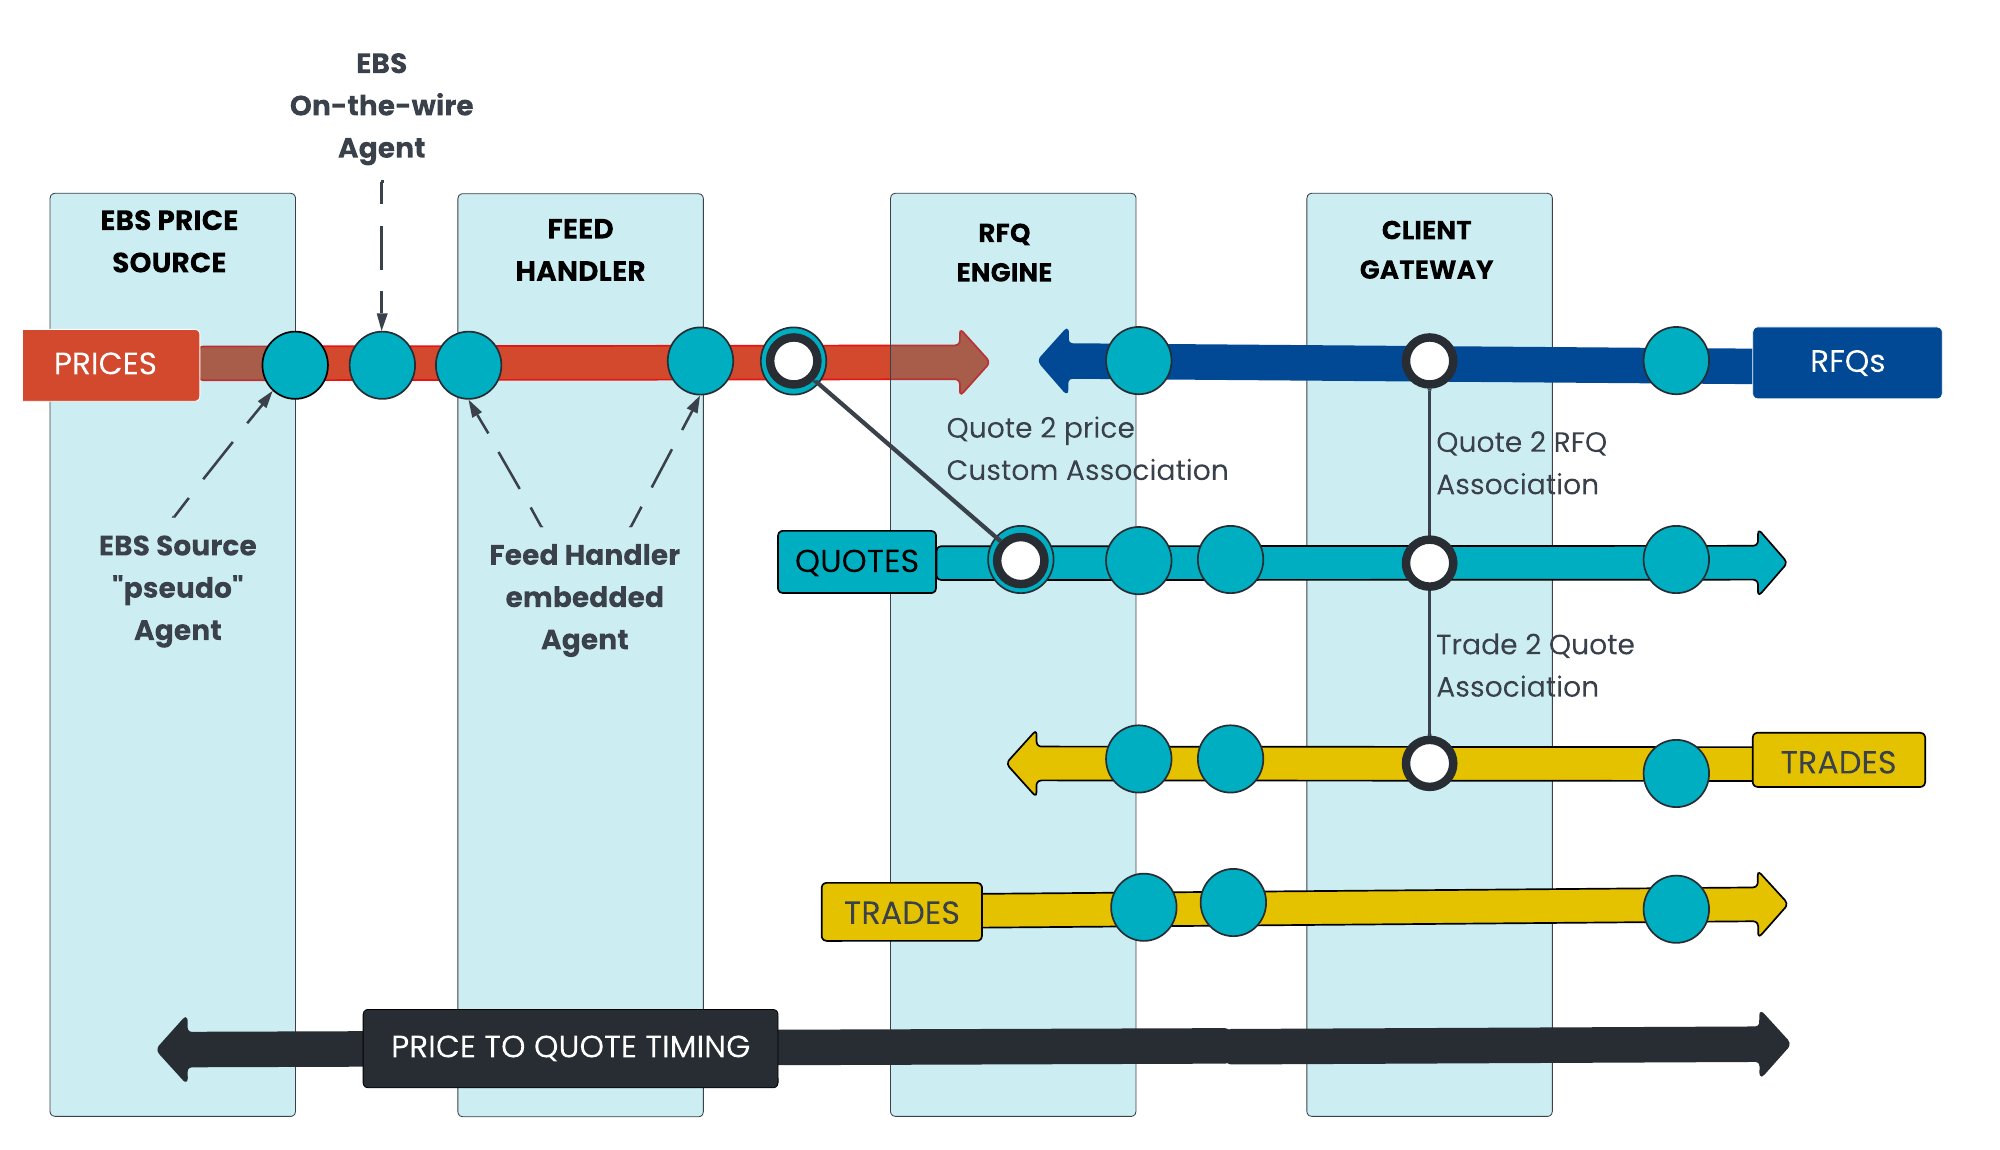
Correlation strategies differ depending on the Agent Point. The following diagram shows how correlation strategies varies across the different Agent Points used for the Trades flow:
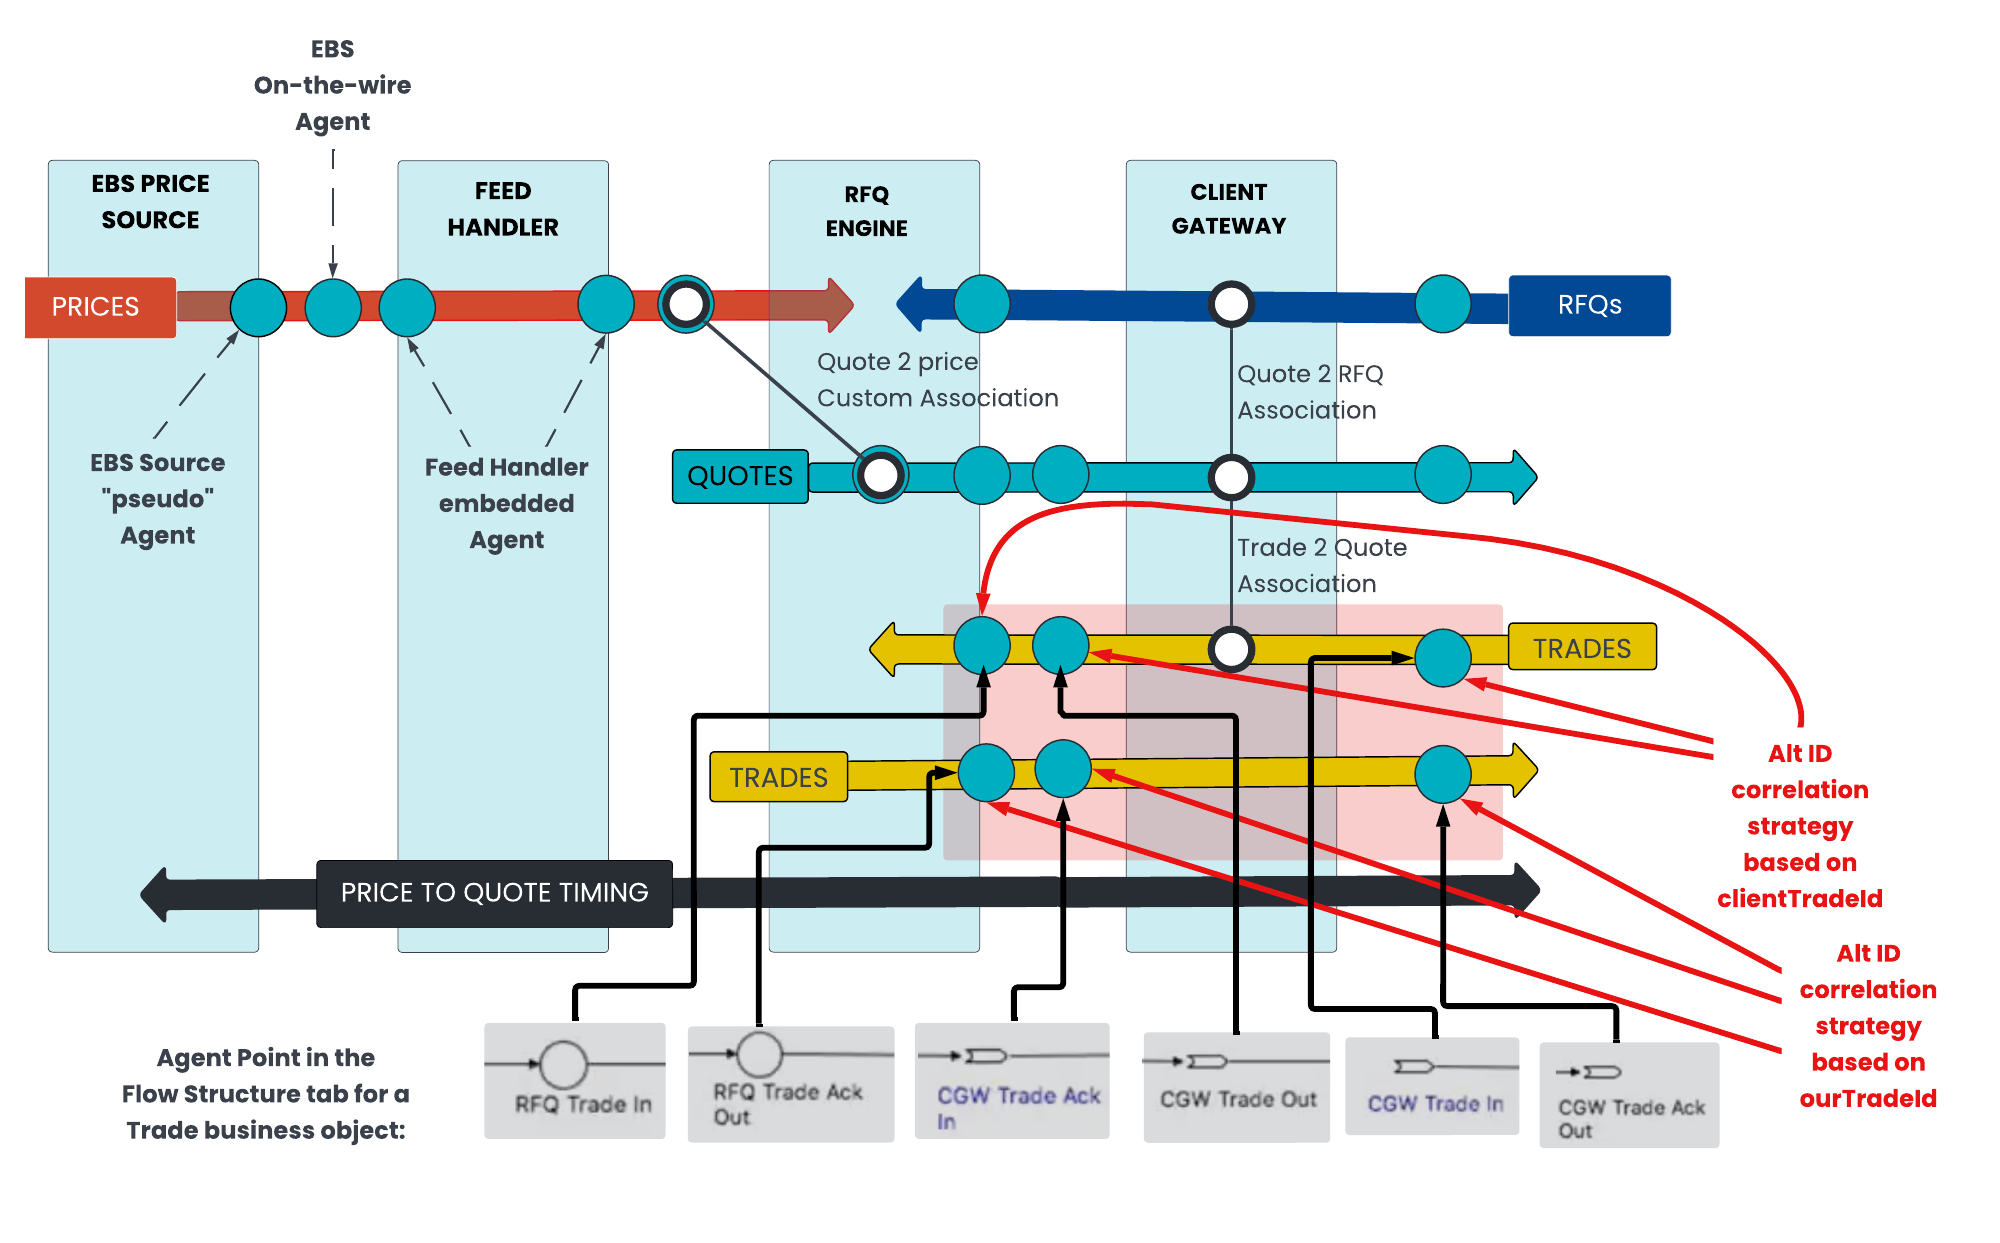
We can use two different correlation strategies within the same flow. The Correlation ID is only present in the return traffic back to the client, but in its absence we can use an alternative ID for the initial traffic from the client.
Note also that we can pick up different business attributes at different points of the flow and build a composite picture of what the trade looks like as it moves across the network, even if the information contained at each individual point in the flow is incomplete.
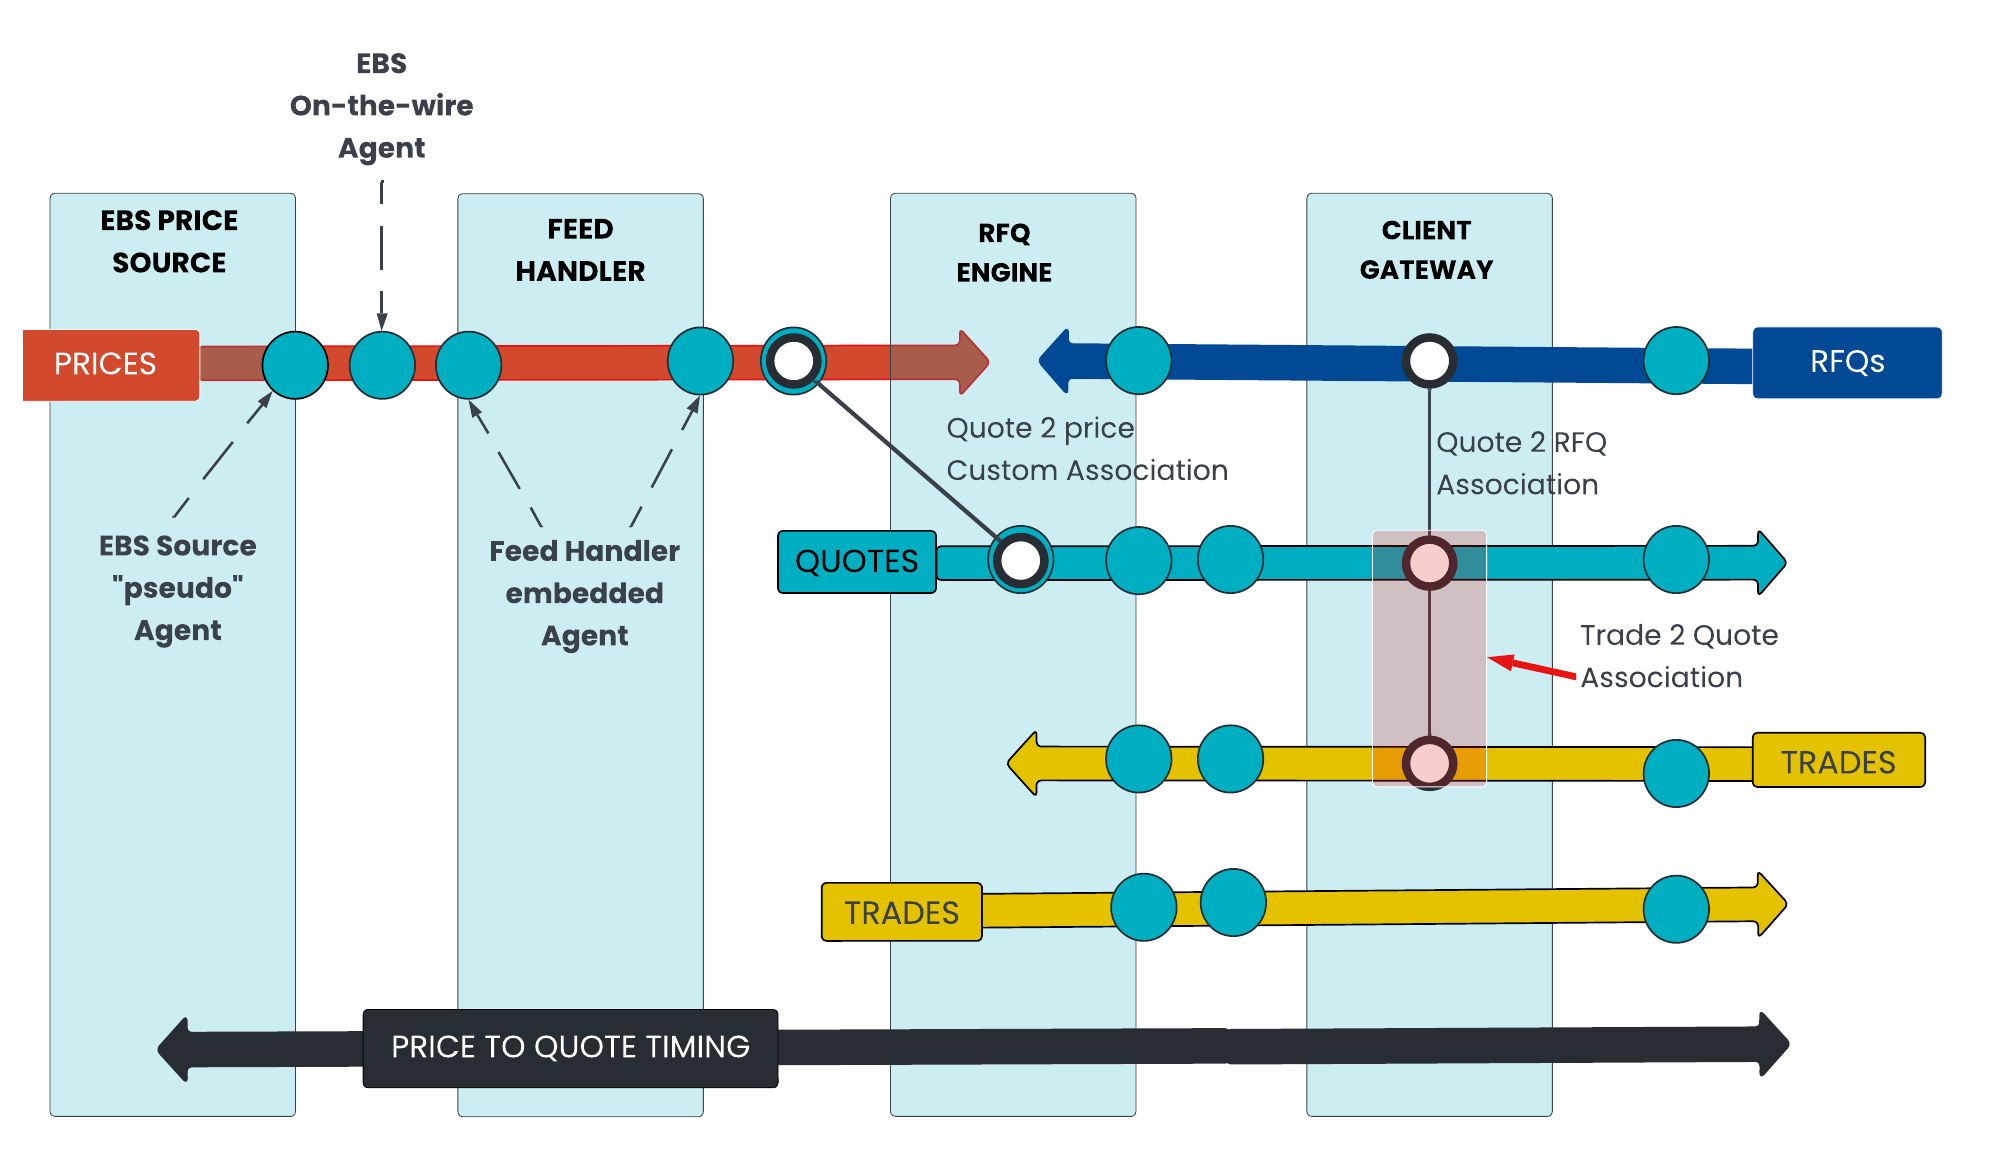
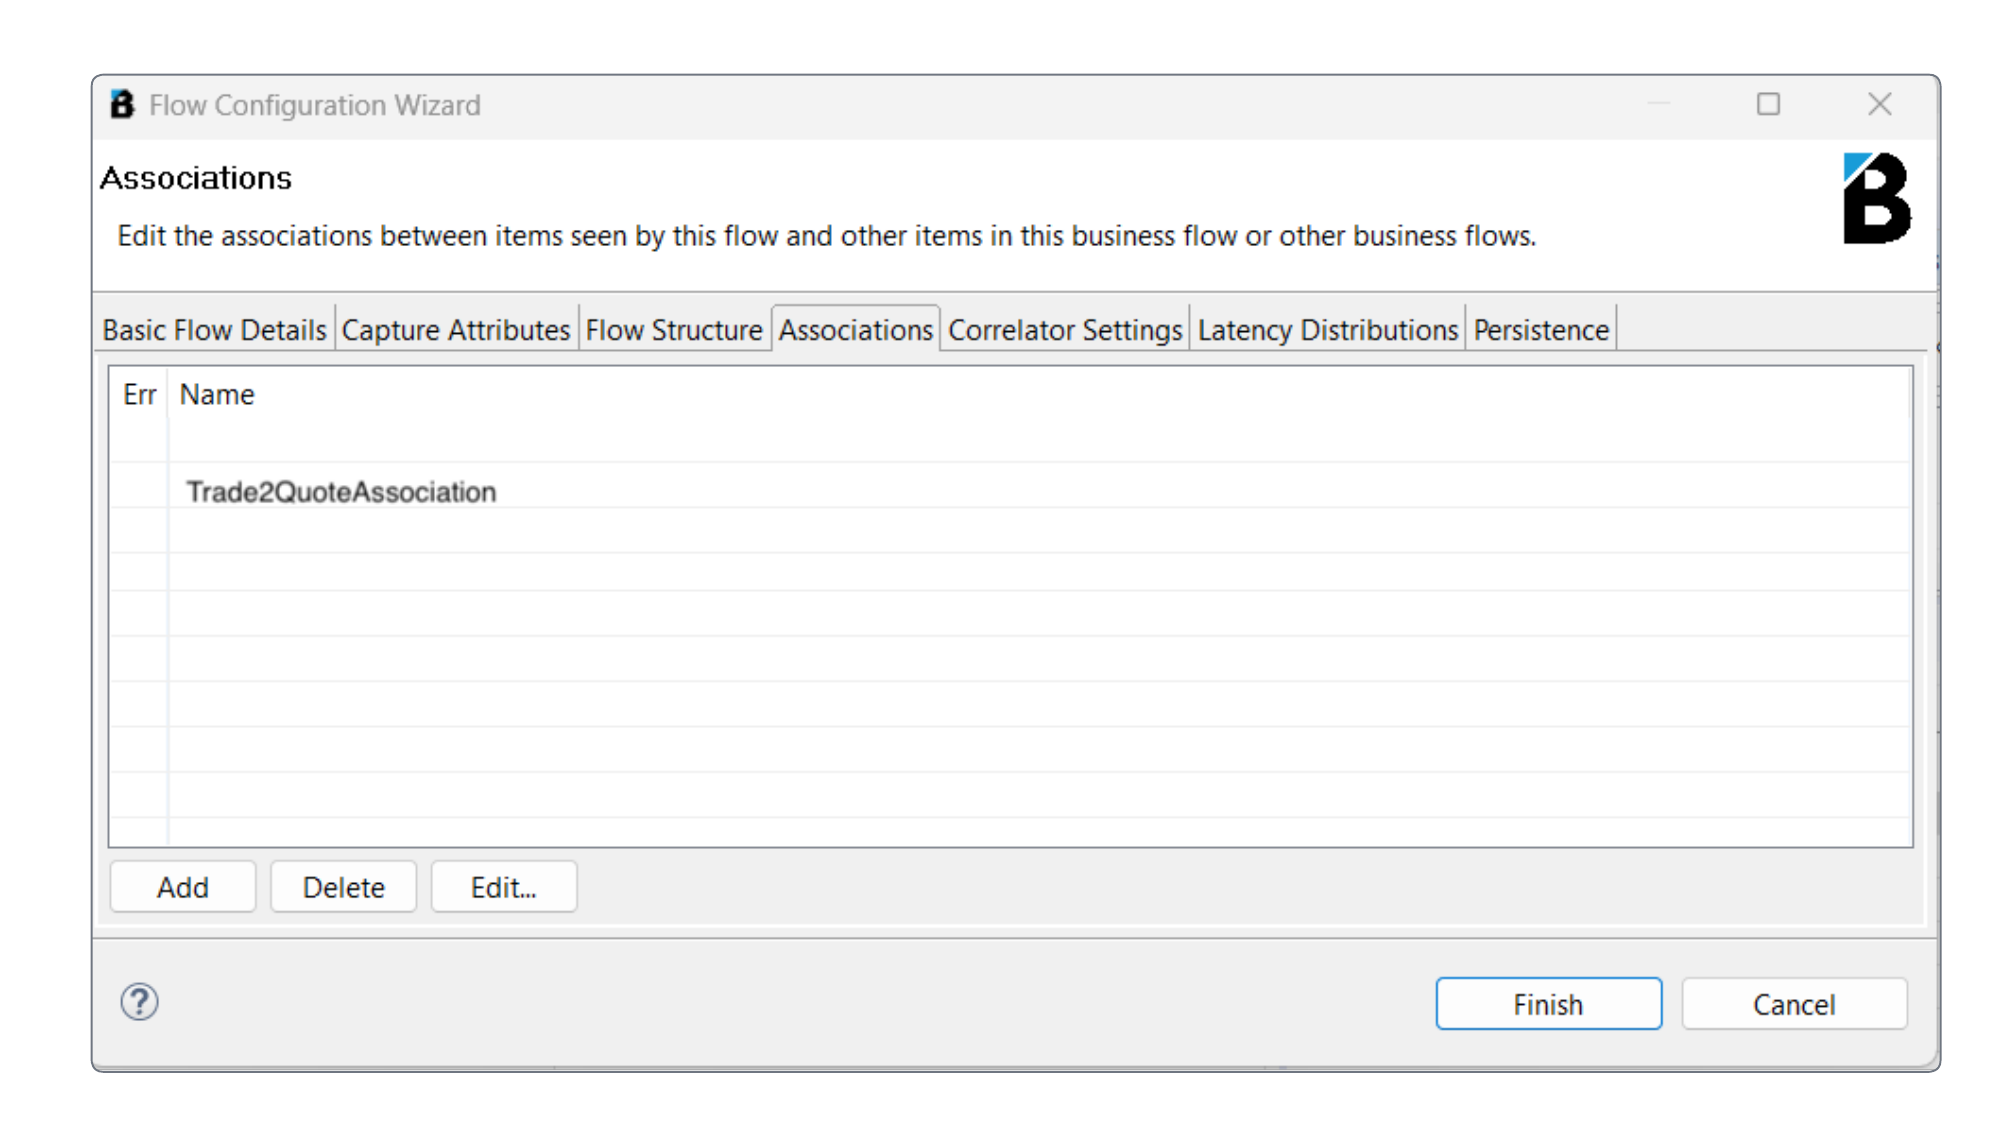
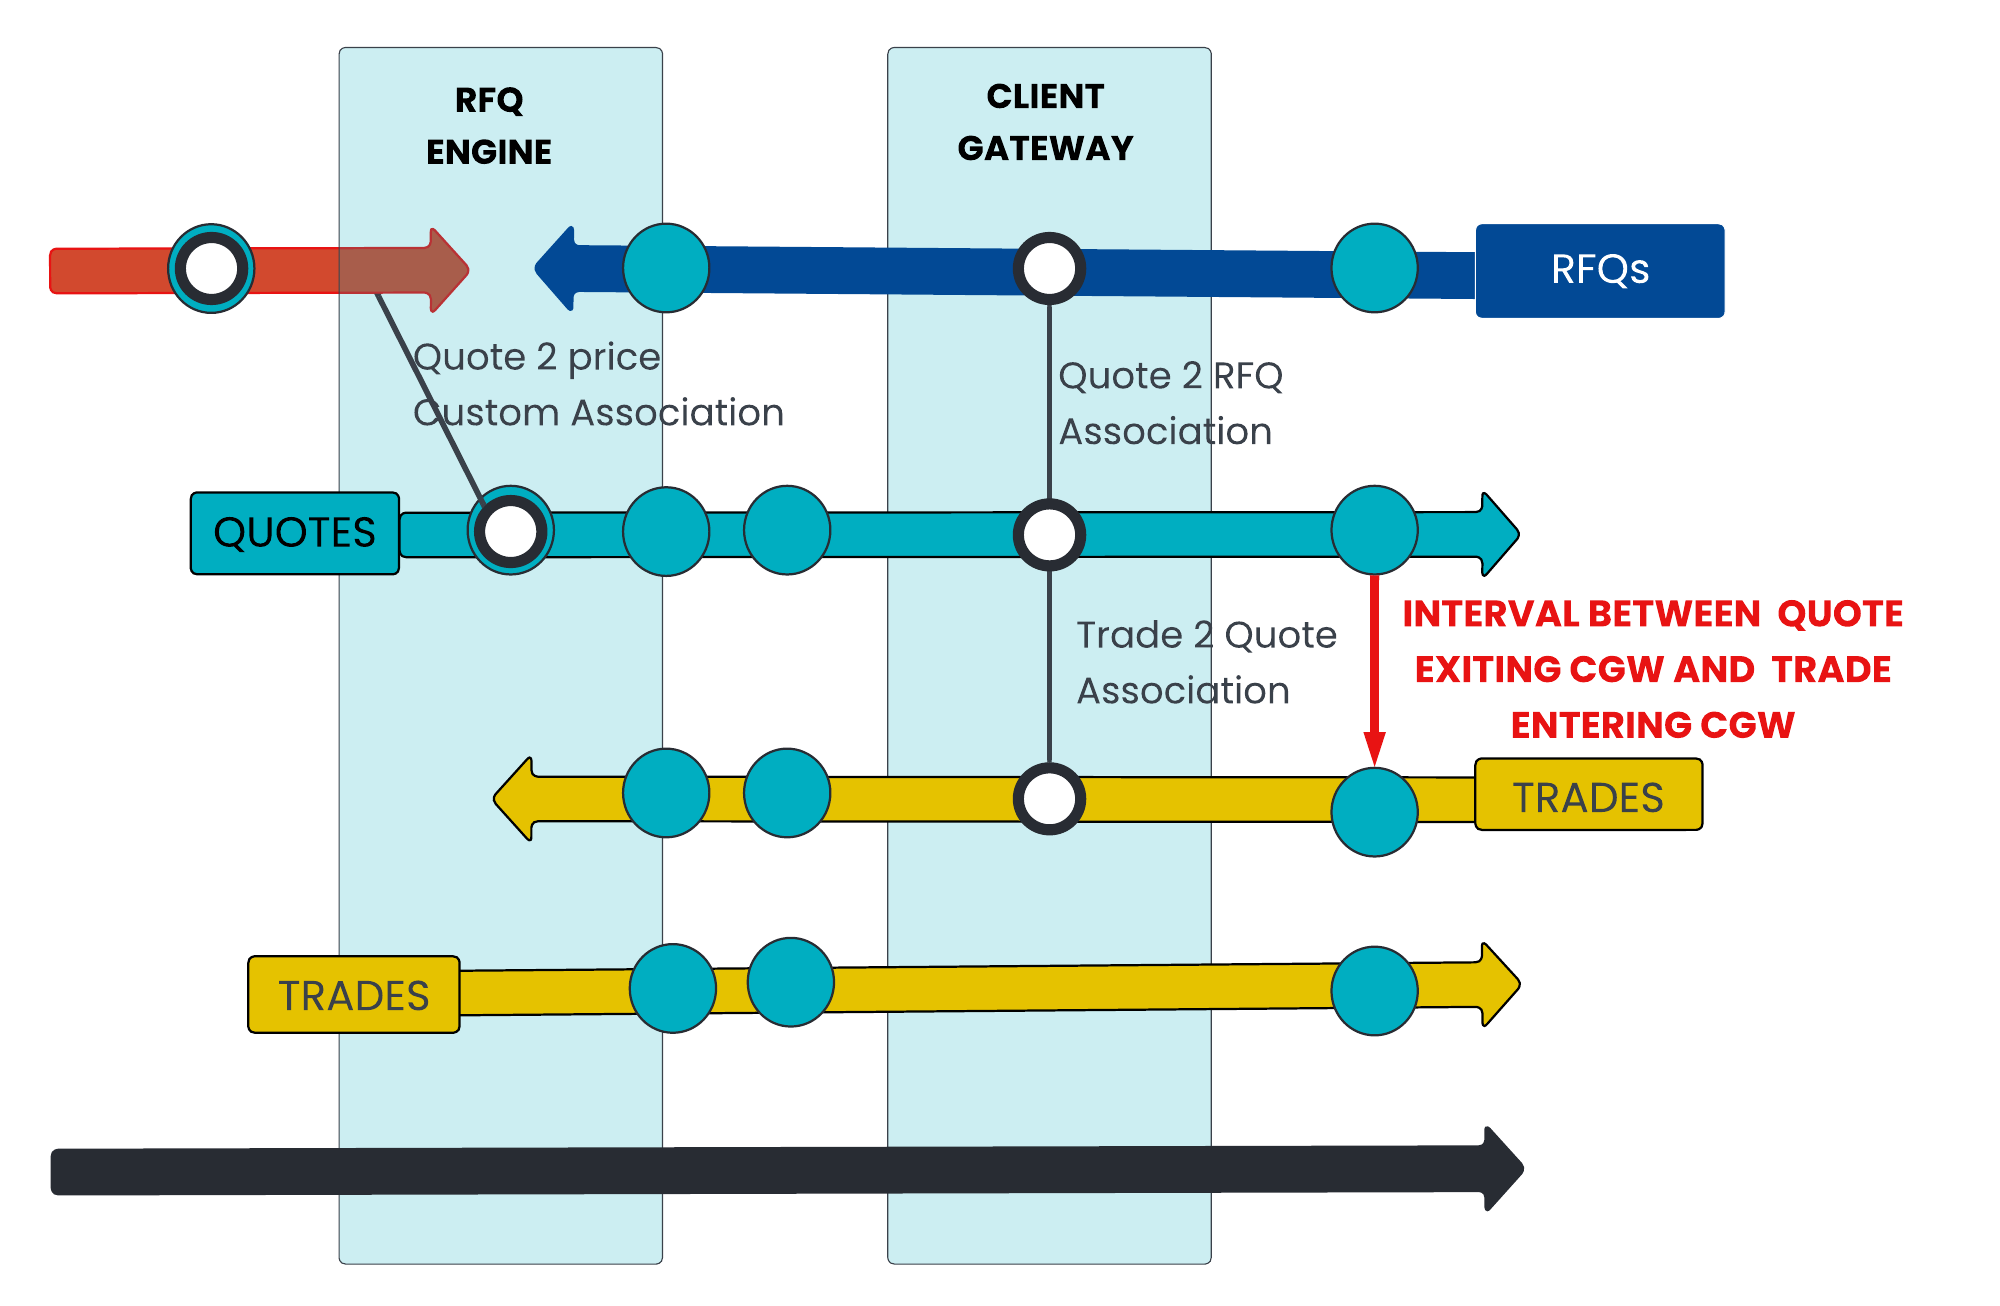
Defining Associations between the Items seen by this flow
In the diagram, you can see an Association that allows Trade objects to be linked back to earlier Quote objects.
This is defined as a rule in the Associations tab of the Flow Configuration wizard.
Double-click on a rule to open the Configure Association modal, which displays the configuration for the Association:
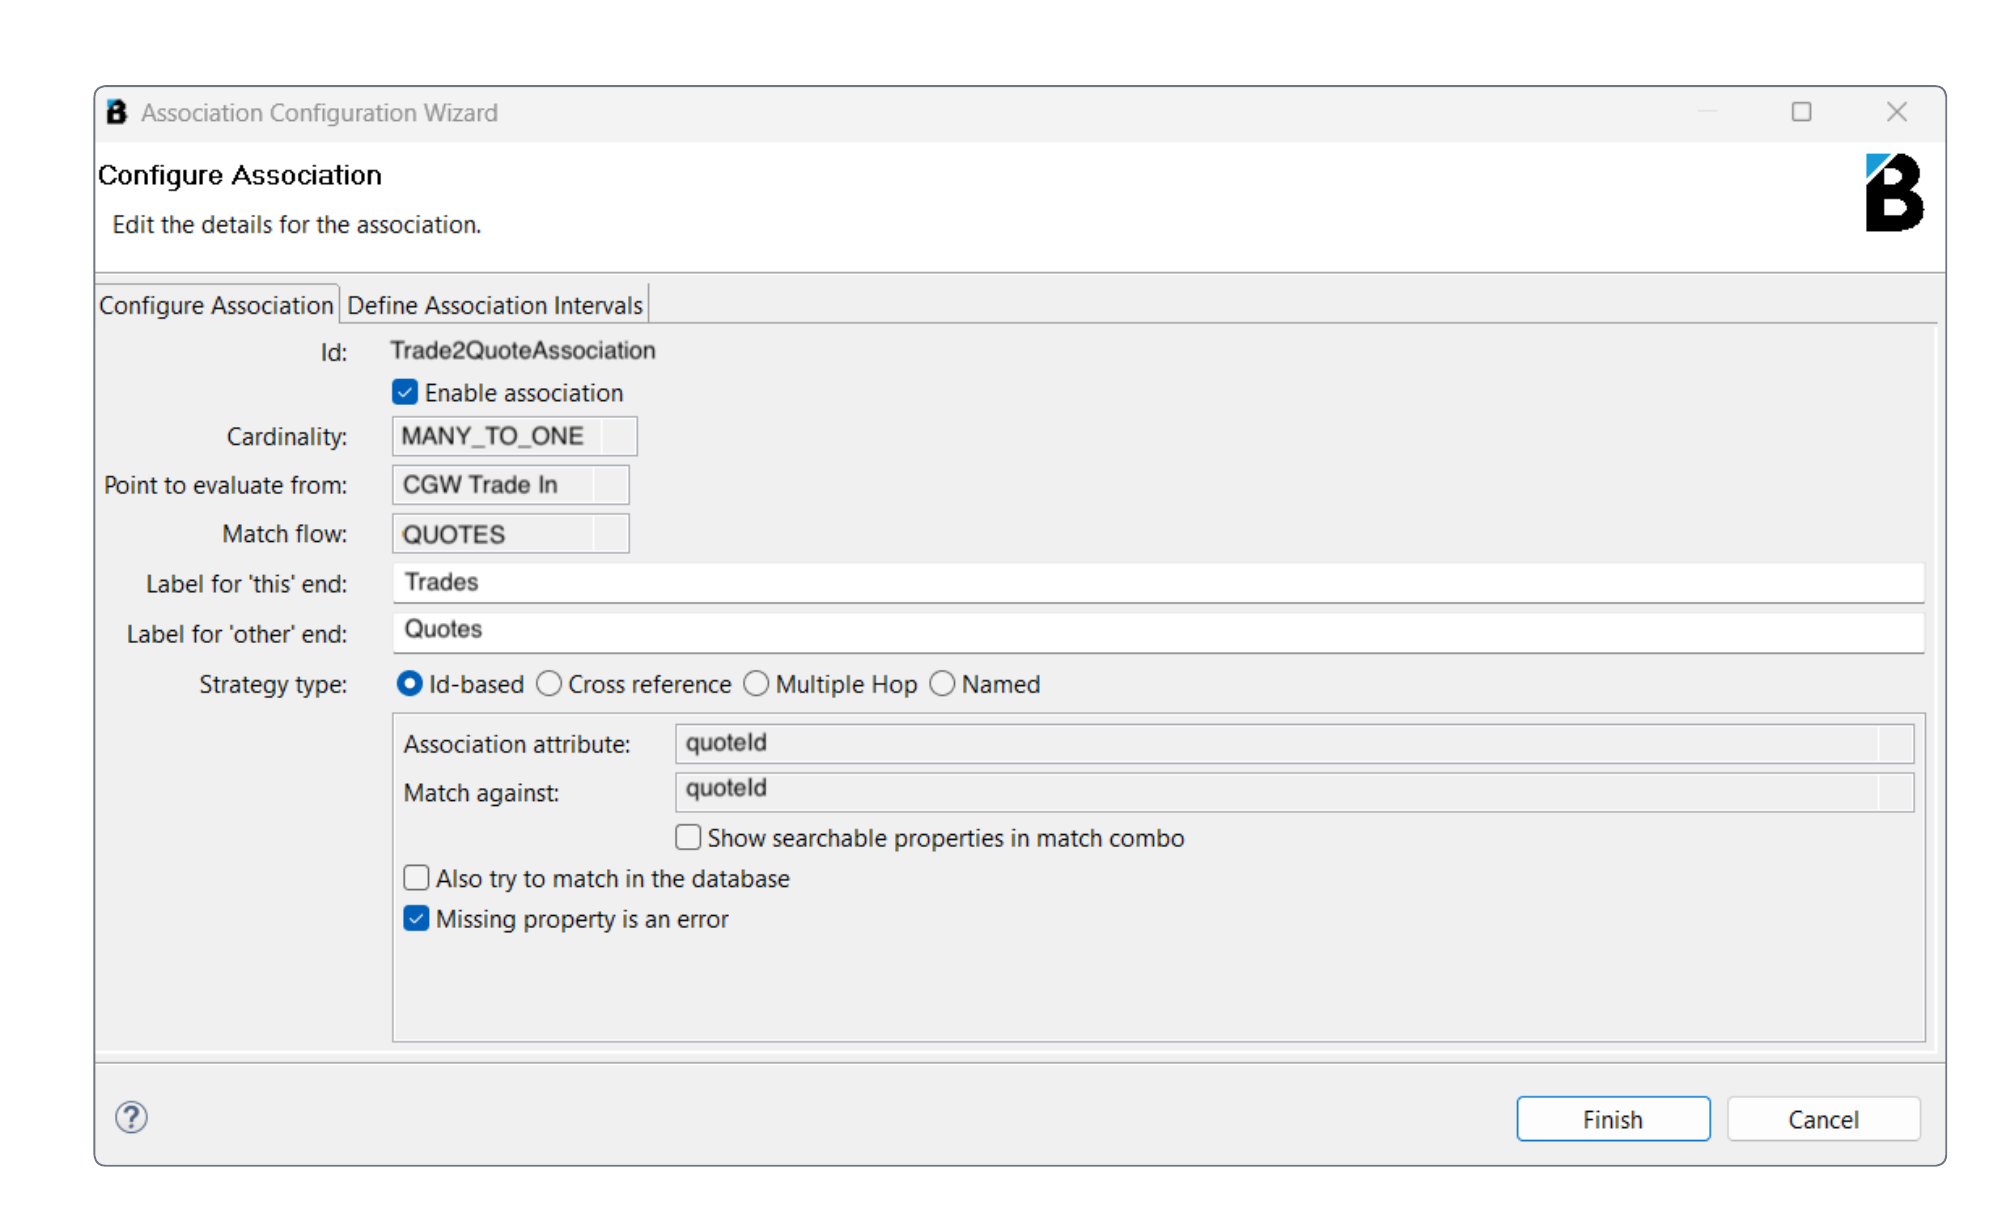
Associations are characterised by having different types of cardinality. It can be a one-to-many, many-to-one, or one-to-one relationship. In our example, there may be many quotes to a single trade item, i.e. many-to-one.
Flexible correlation cardinality allows us to model things like Fan Out and Fan In relationships very simply.
See the Beeks document Beeks Analytics Concept Guide for further information about Fan Out/In support.
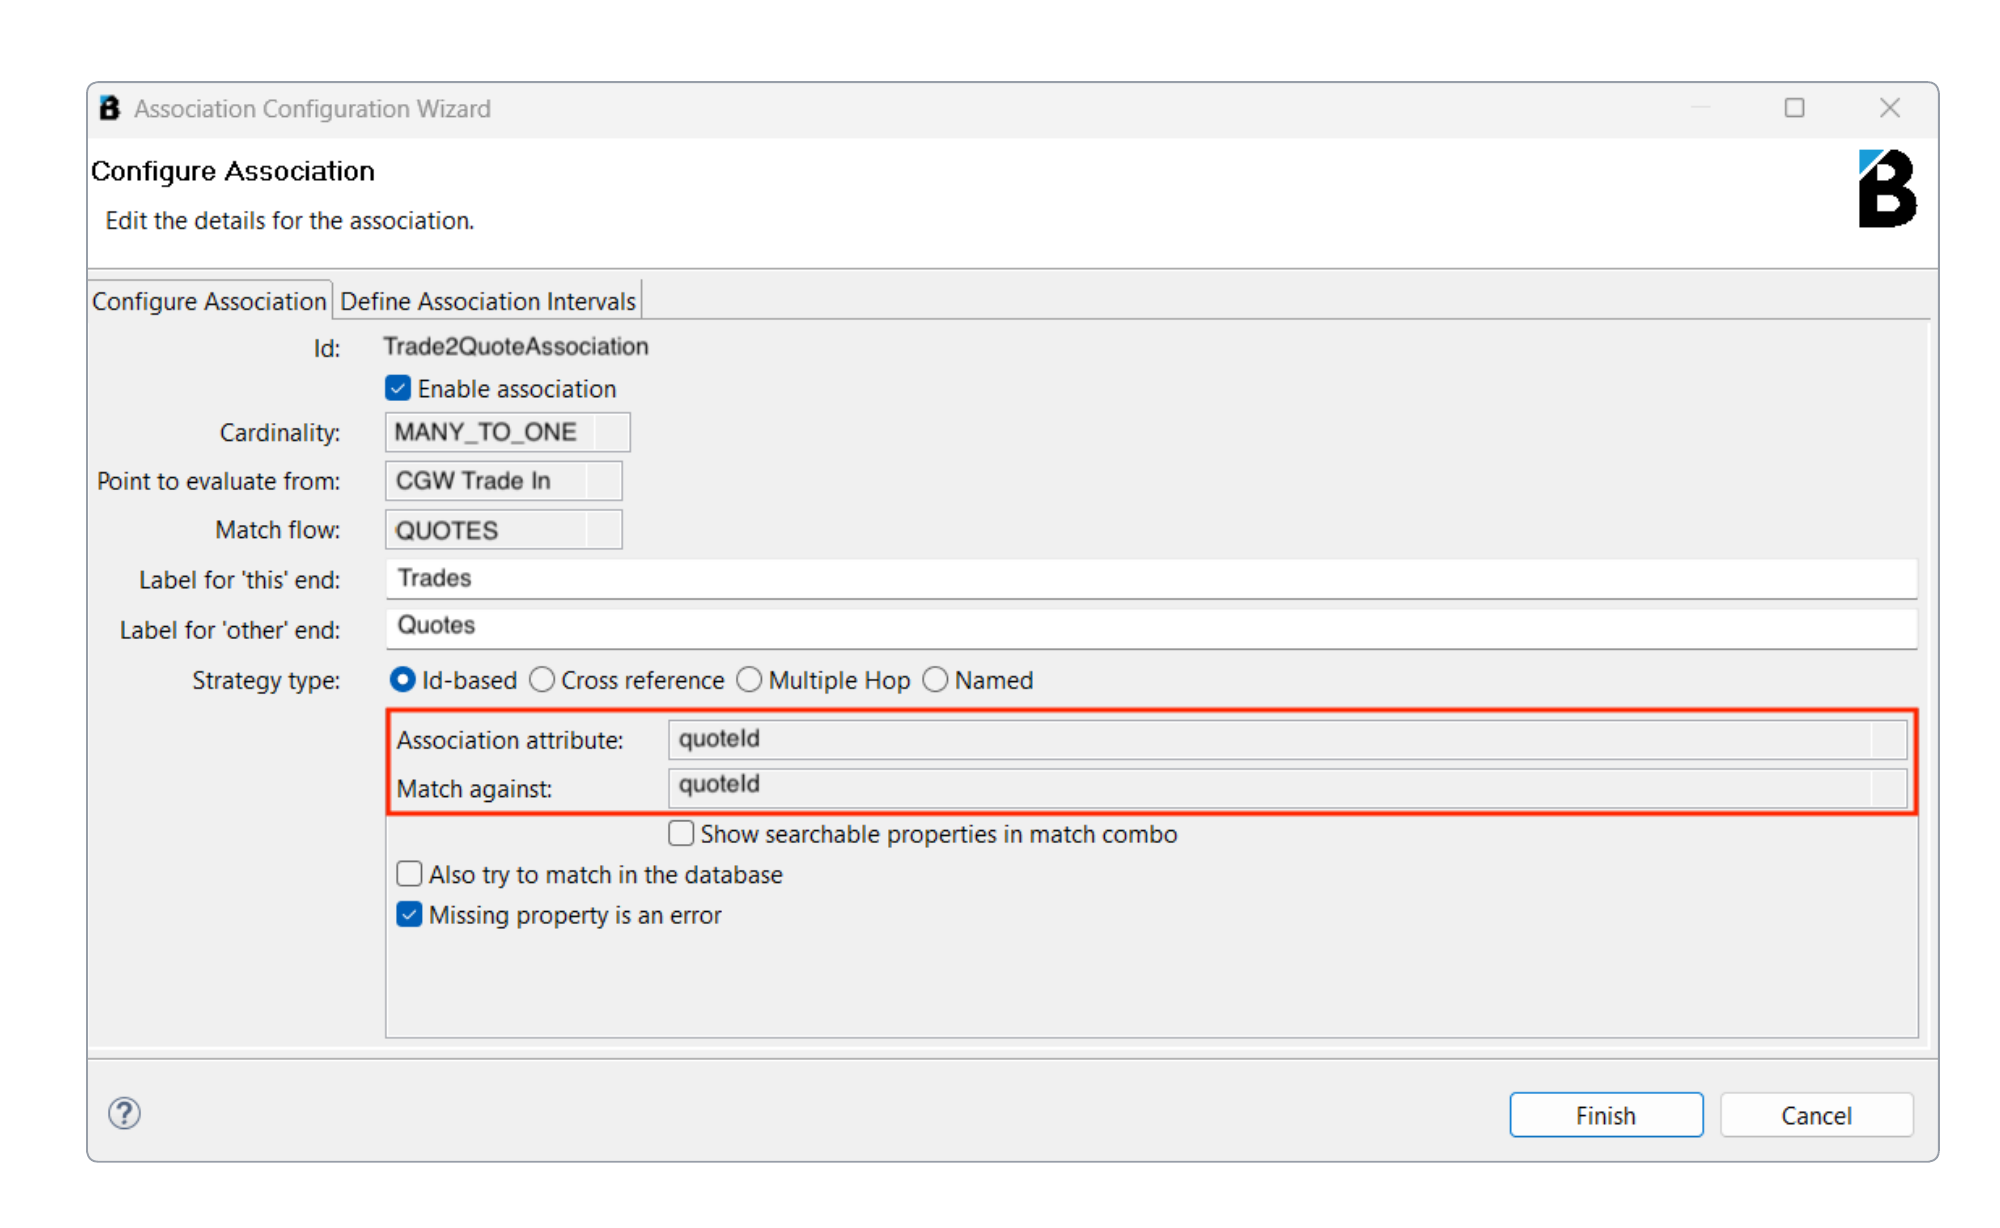
In our example, we would like to link back to the Quote from the point at which the Trade enters the Trade flow at the CGW Trade In Agent Point, and match the Trade against attributes that are in the Quotes flow. We’ll use an Association strategy to accomplish this. Beeks Analytics supports a range of Association strategies but for the purpose of this example, we’ll use a very simple Id-based strategy that links the quoteId in the Trade flow with the quoteId in the Quote flow.
Now that the Association between these flows is configured, open the Define Association Intervals tab, where you can define the specific timings (“Intervals”) that you want to measure. Create as many Intervals between any two Agent Points in the two flows as needed:
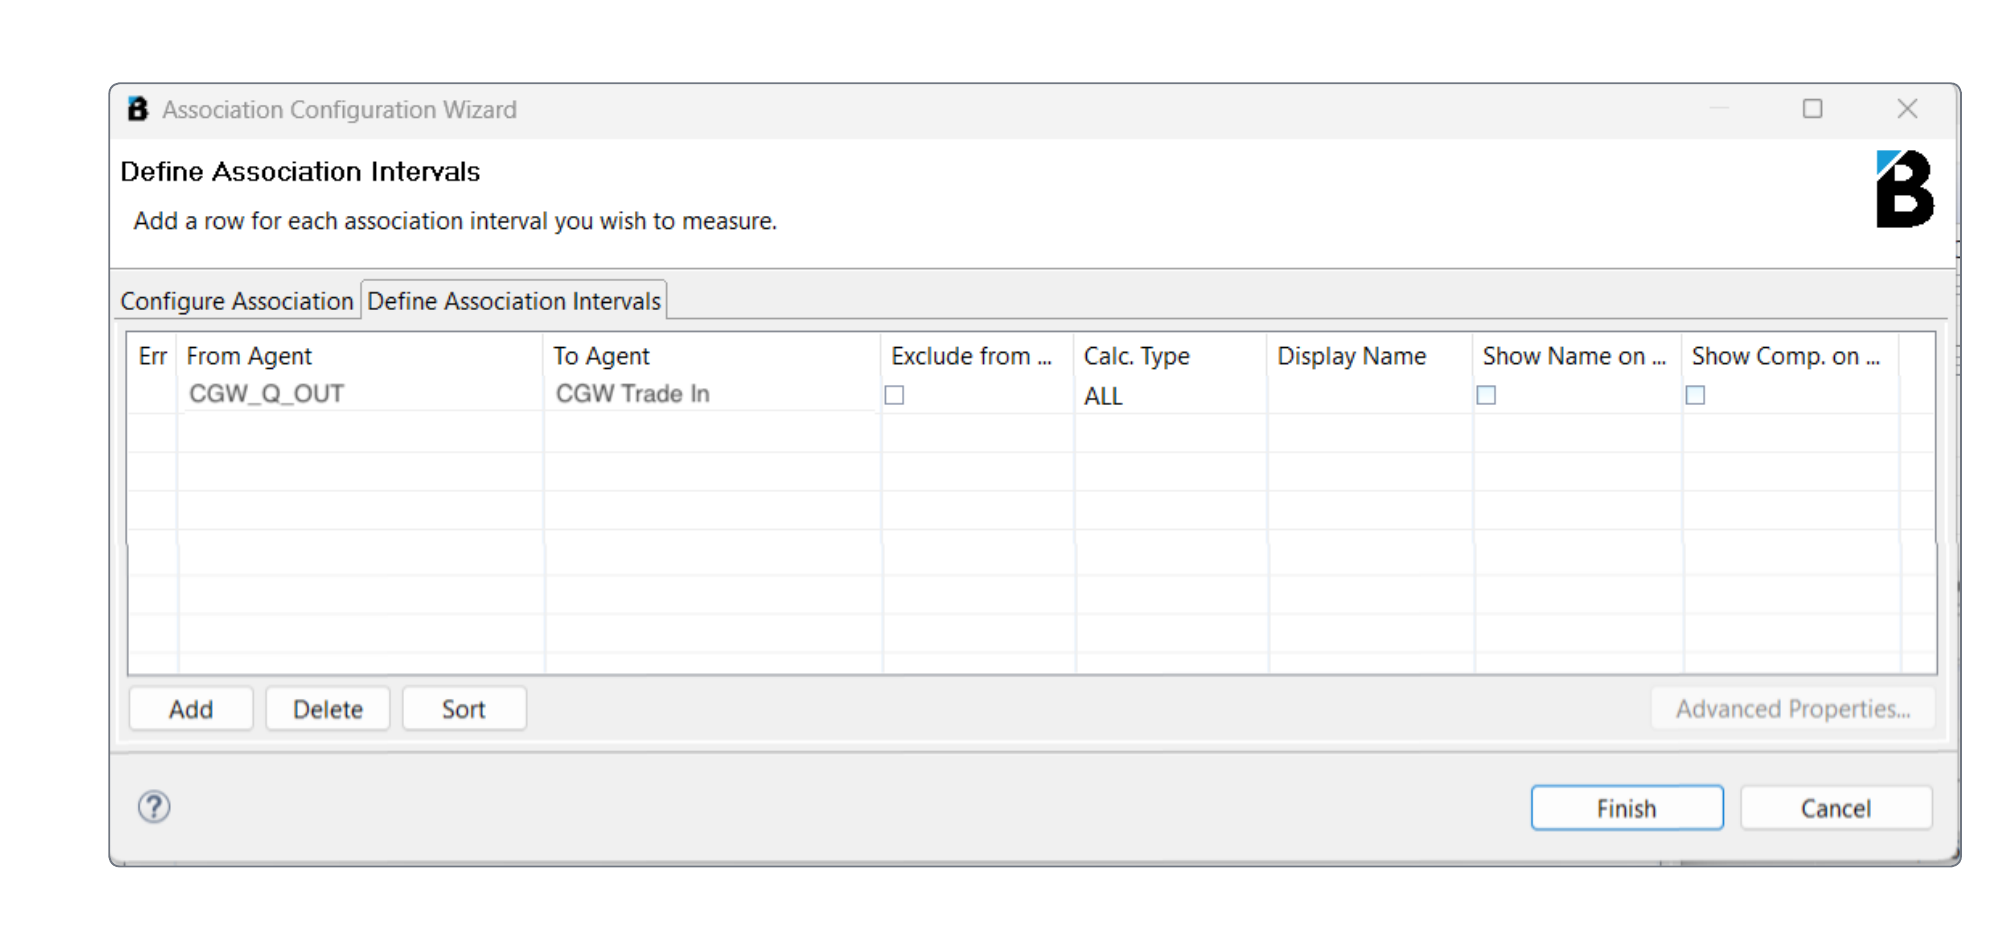
In our particular example we've set up an Interval that starts when the quote went out of the Client Gateway and measures the time taken for the trade to come in from the Client, i.e., it measures how long it took the Client to like the quote and decide that they were going to trade against it.
Viewing the results of the Flow in VMX-AdminConsole
Once you’ve configured the flow, you can inspect the results in VMX-AdminConsole.
Default Aggregators
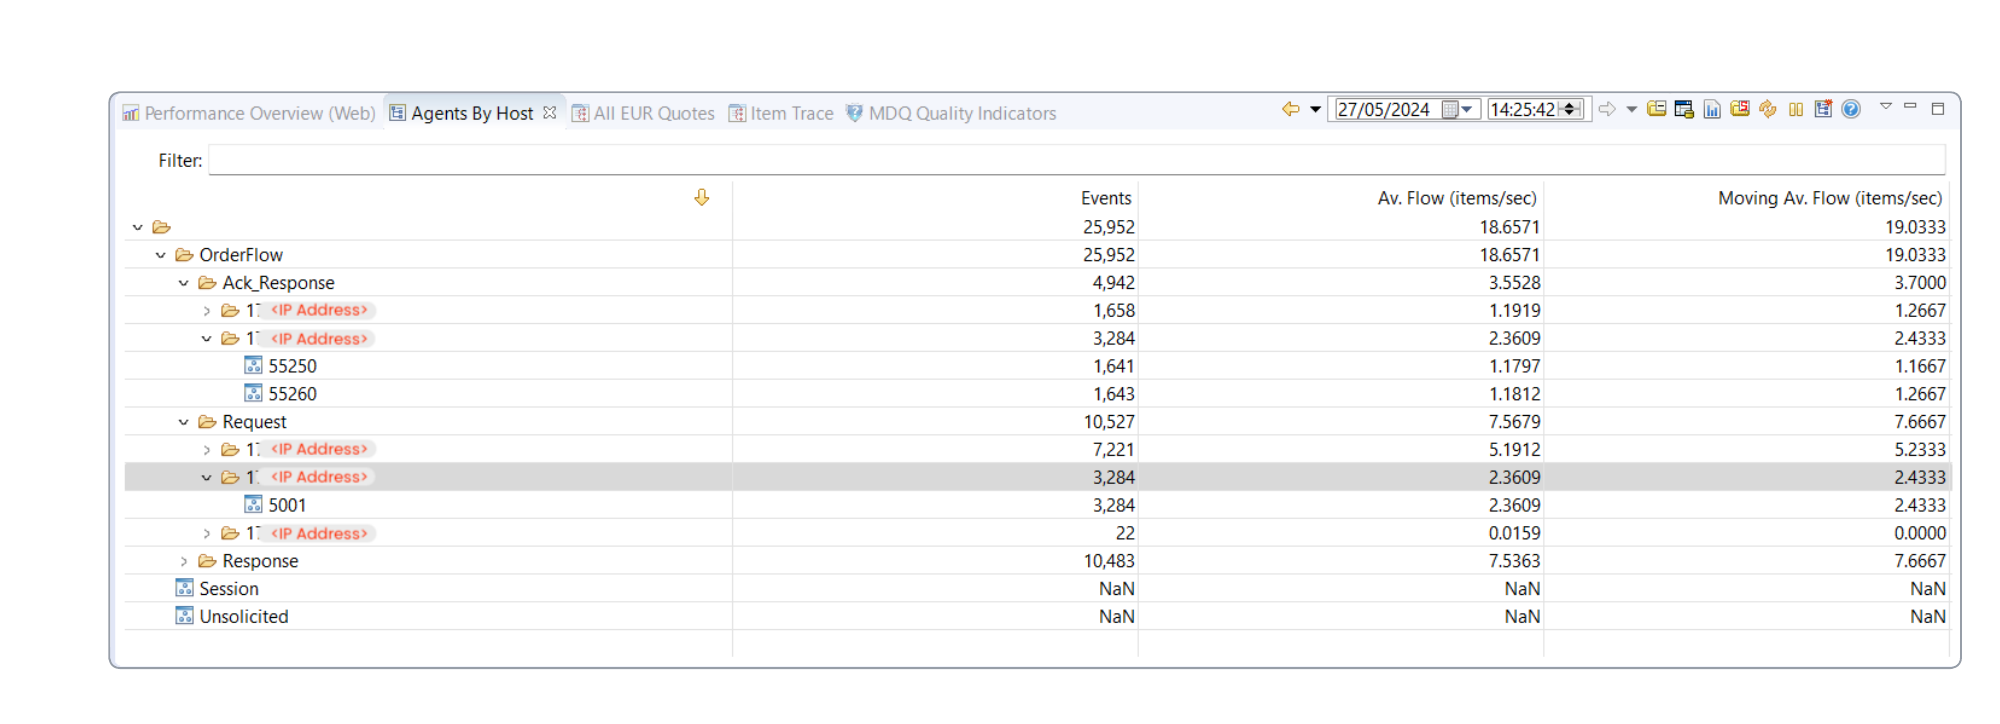
Each flow that you create will automatically generate two default Aggregators, which you can use to track how much data is being recorded for that flow:
The Agent per Host Aggregator looks at all of the Agent Events that we pick up in the Trades flow. It measures these at each Agent Point. The top level of the Aggregator shows the total number of Agent Events seen for this Flow, and the next level of the Aggregator breaks these events down by each logical Agent Point that you configured. The next level shows the statistics broken down by the actual physical Client Gateway or RFQ engine.
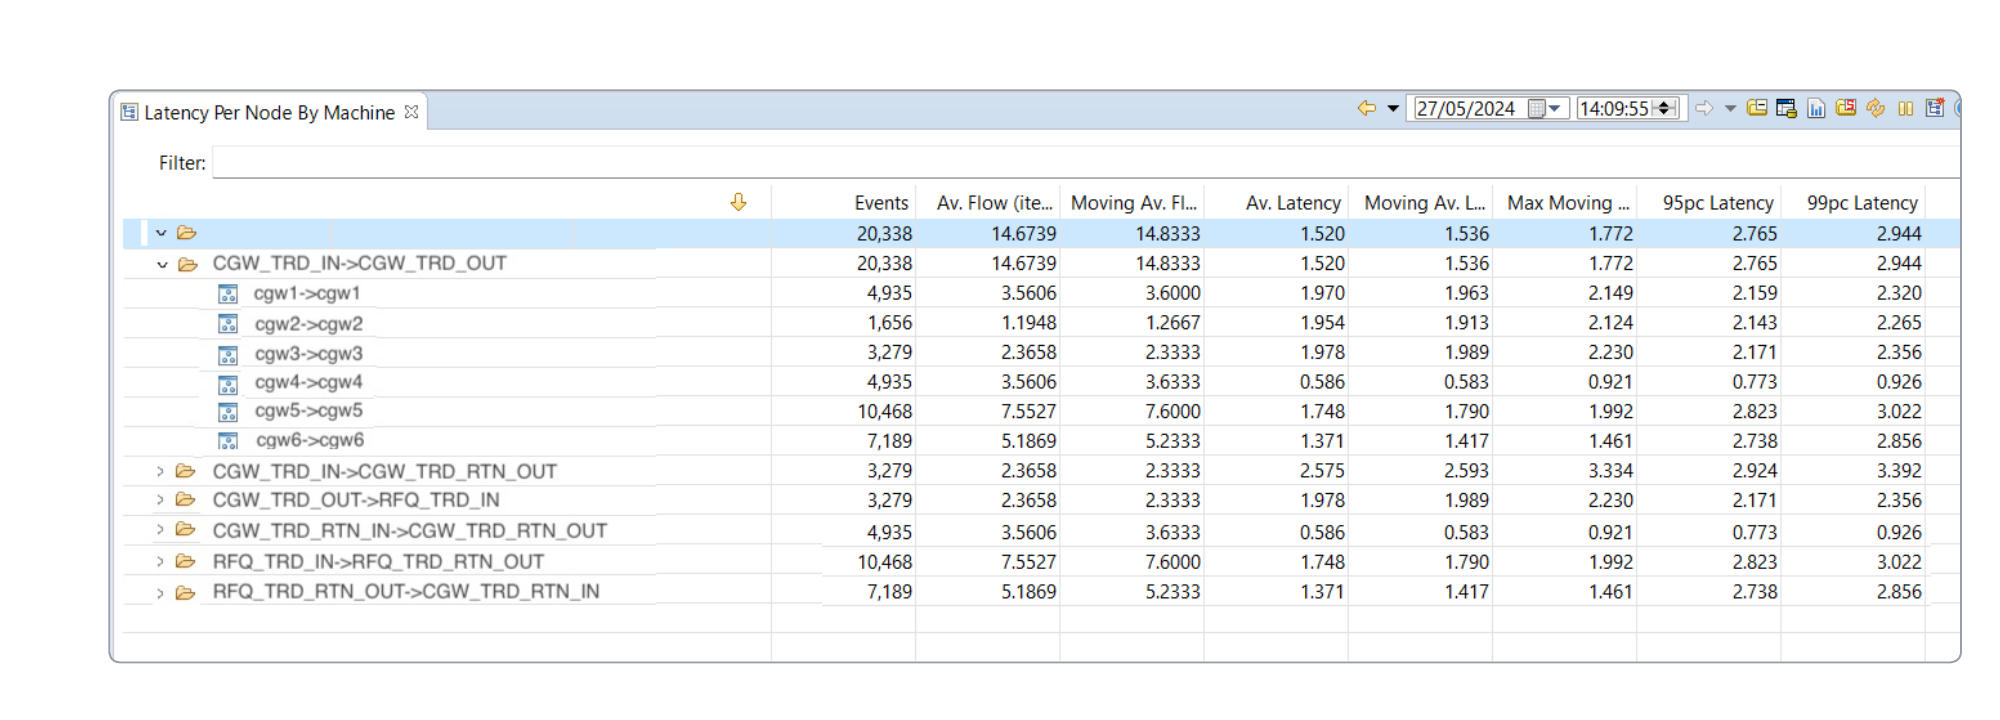
The Latency Per Node by Machine Aggregator shows the latency statistics between any two Agent Points in the flow.
Custom Aggregators
In addition to the standard two aggregators for each flow, you can create your own custom aggregators for the Flows and view the results in them. In the following example, the top-level of the Aggregator breaks out the data per client:
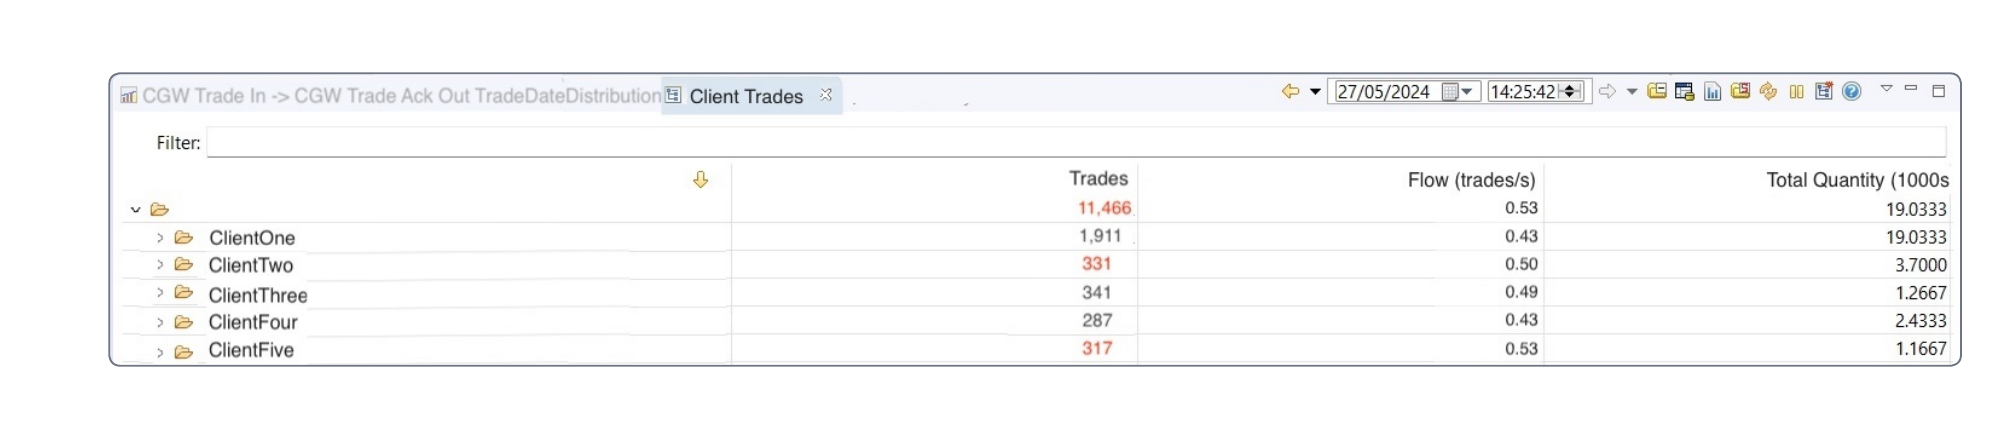
Aggregators can be as complex or simple as you need, for example, an aggregator might simply display how many trades you did. Since we configured Price and Quantity capture attributes for this Flow (which means we capture the values for price and quantity in the messages), we can install calculators here that show us the total quantity and notional value of the business that we're doing right now, live and per client.
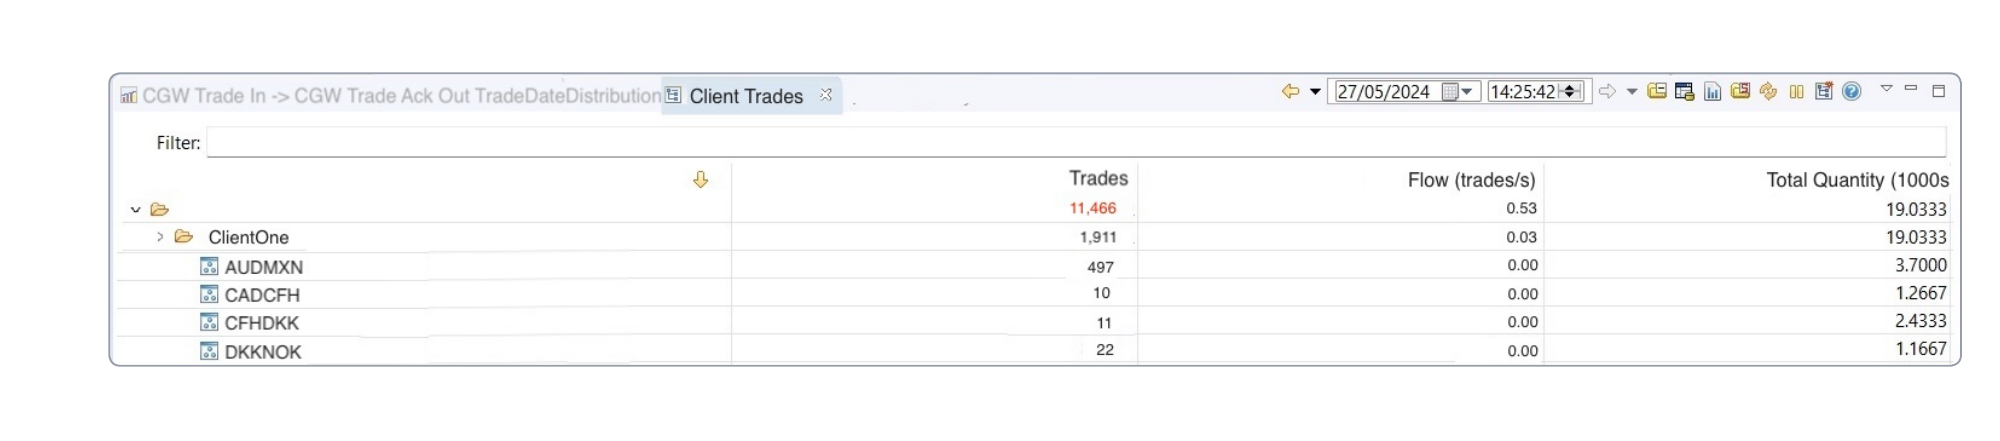
If we drill down to the next level down in our example custom Aggregator, we can see that it breaks the latency measurements down per currency pair, for each client:
To create a custom Aggregator:
Open the Aggregator Set Configuration wizard:
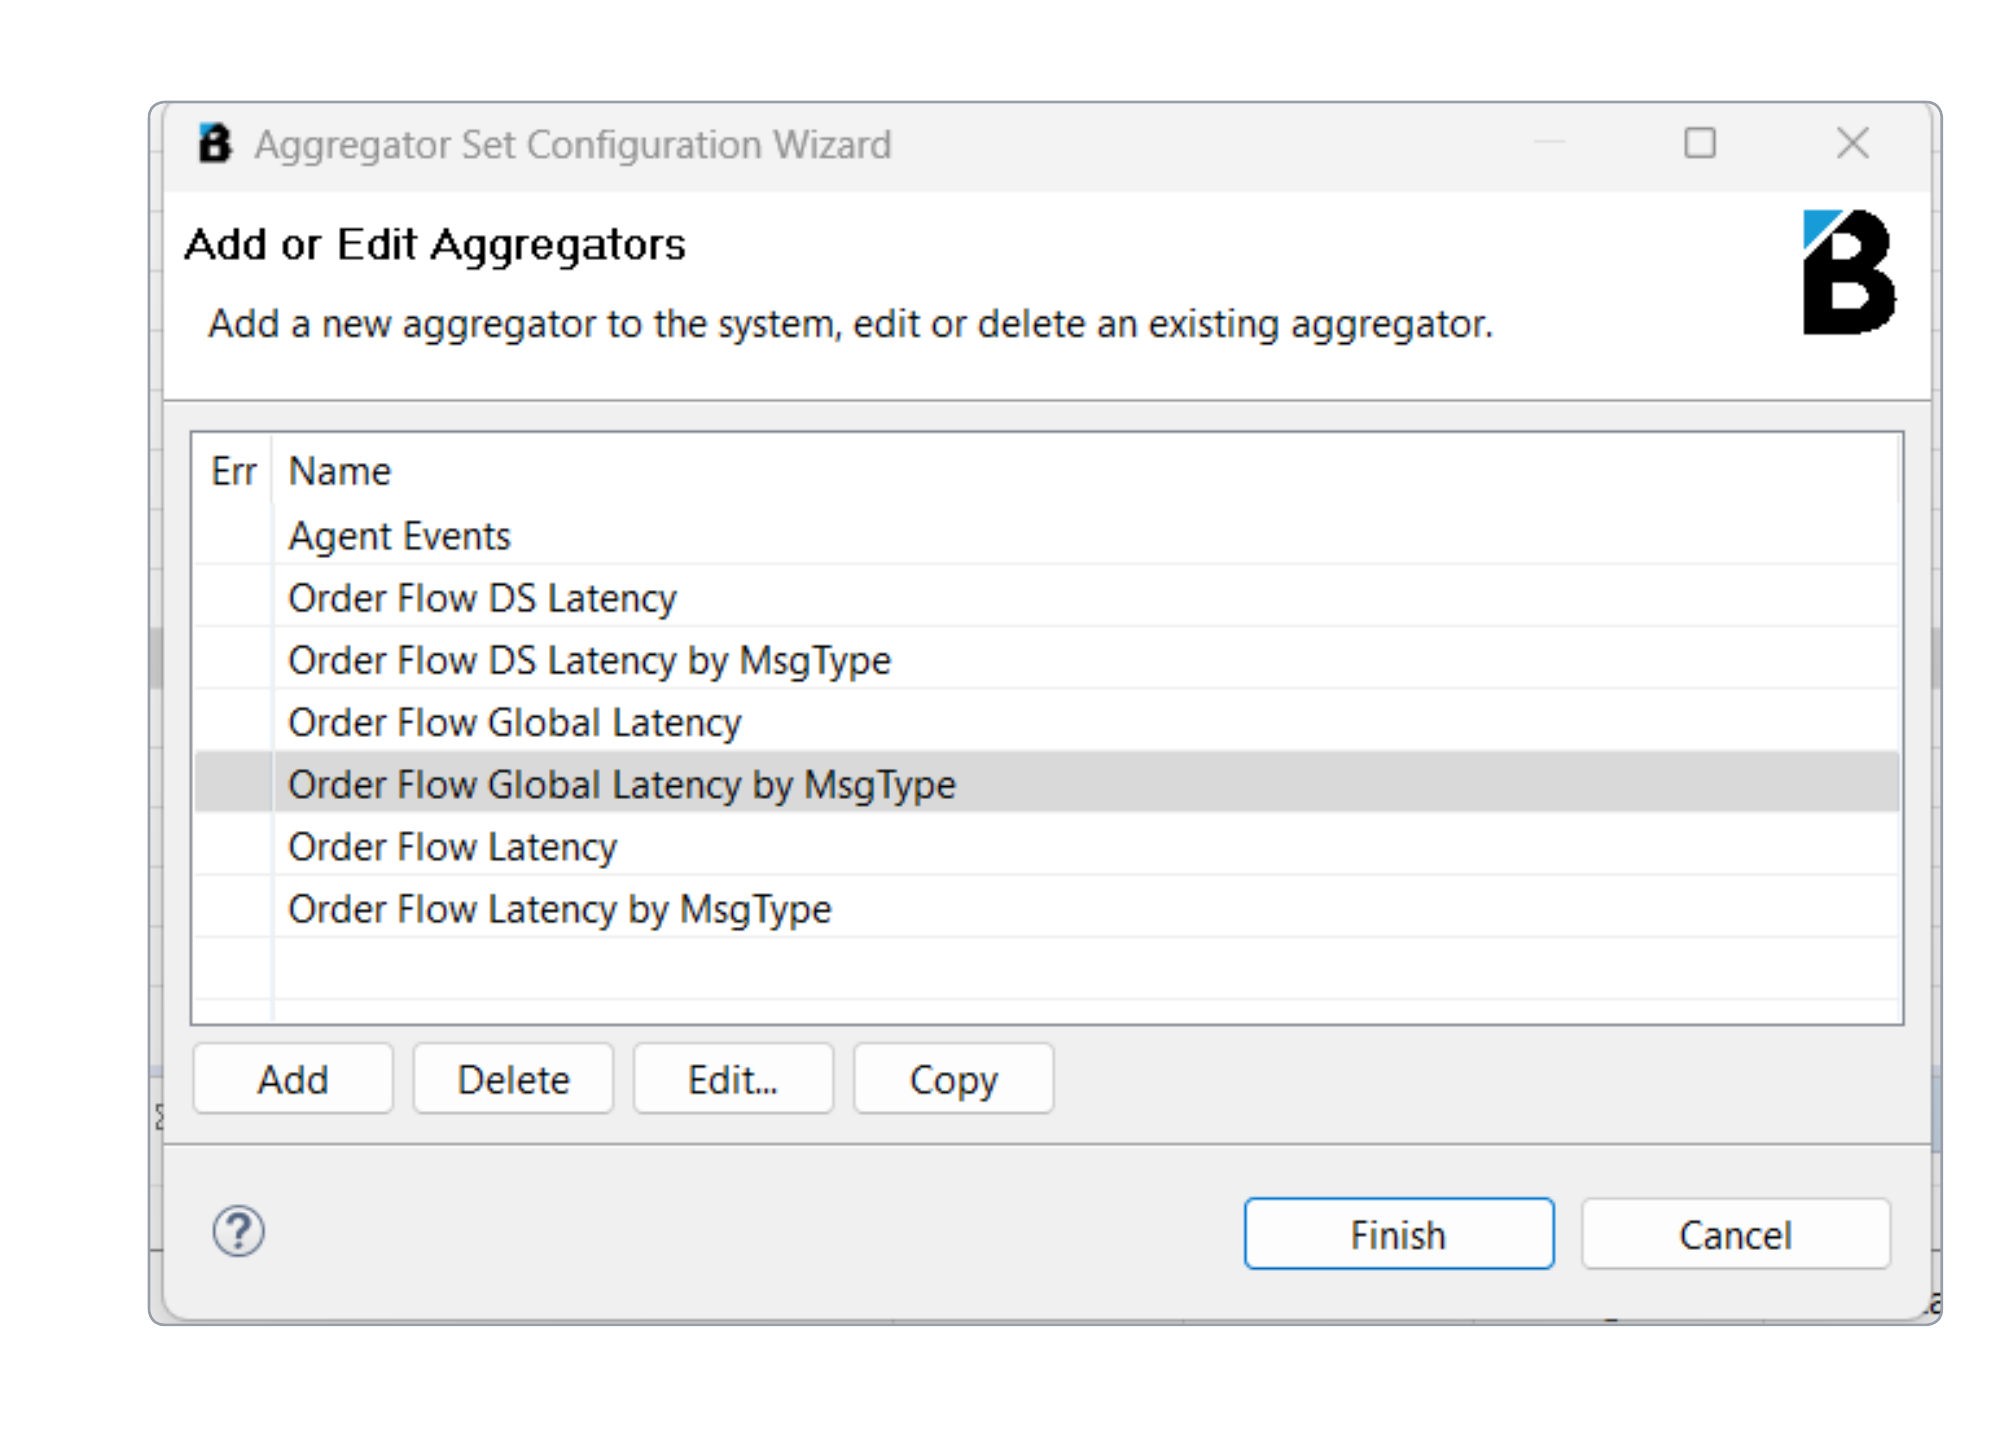
Select Add and enter the name of the new Aggregator into the General tab.
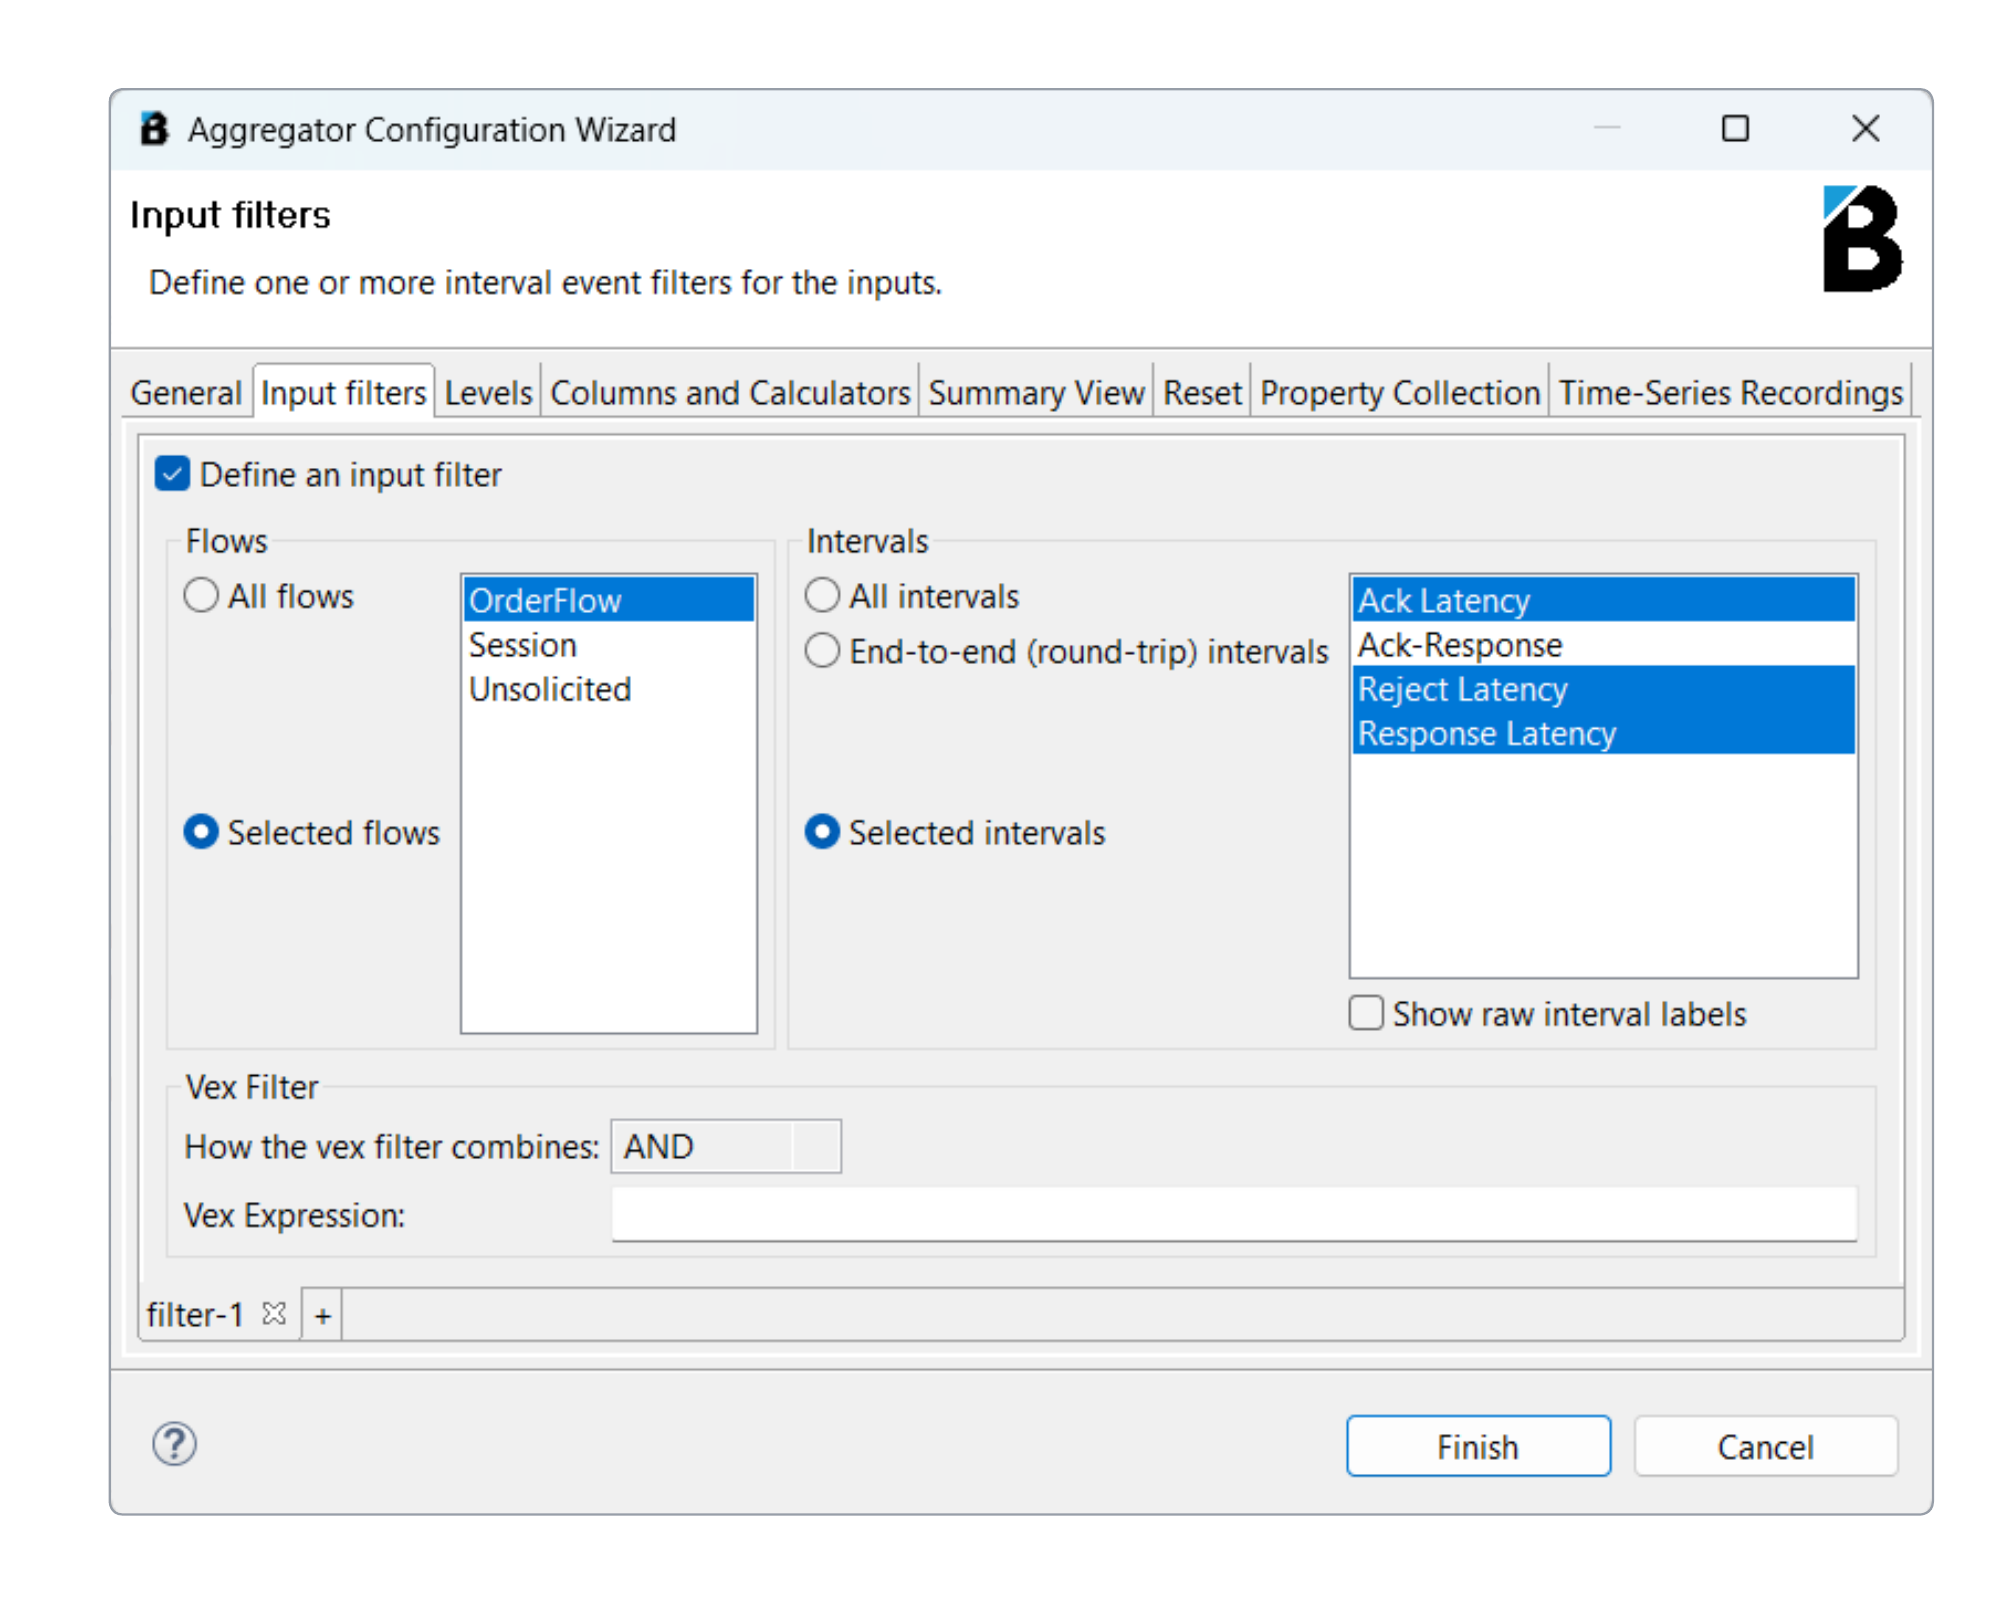
To define input filters, select the Input Filters tab and complete the fields:
Define an input filter checkbox
Select the flow from the Flows list.
Select the intervals from the Intervals list.
Enter a VEx expression if required.
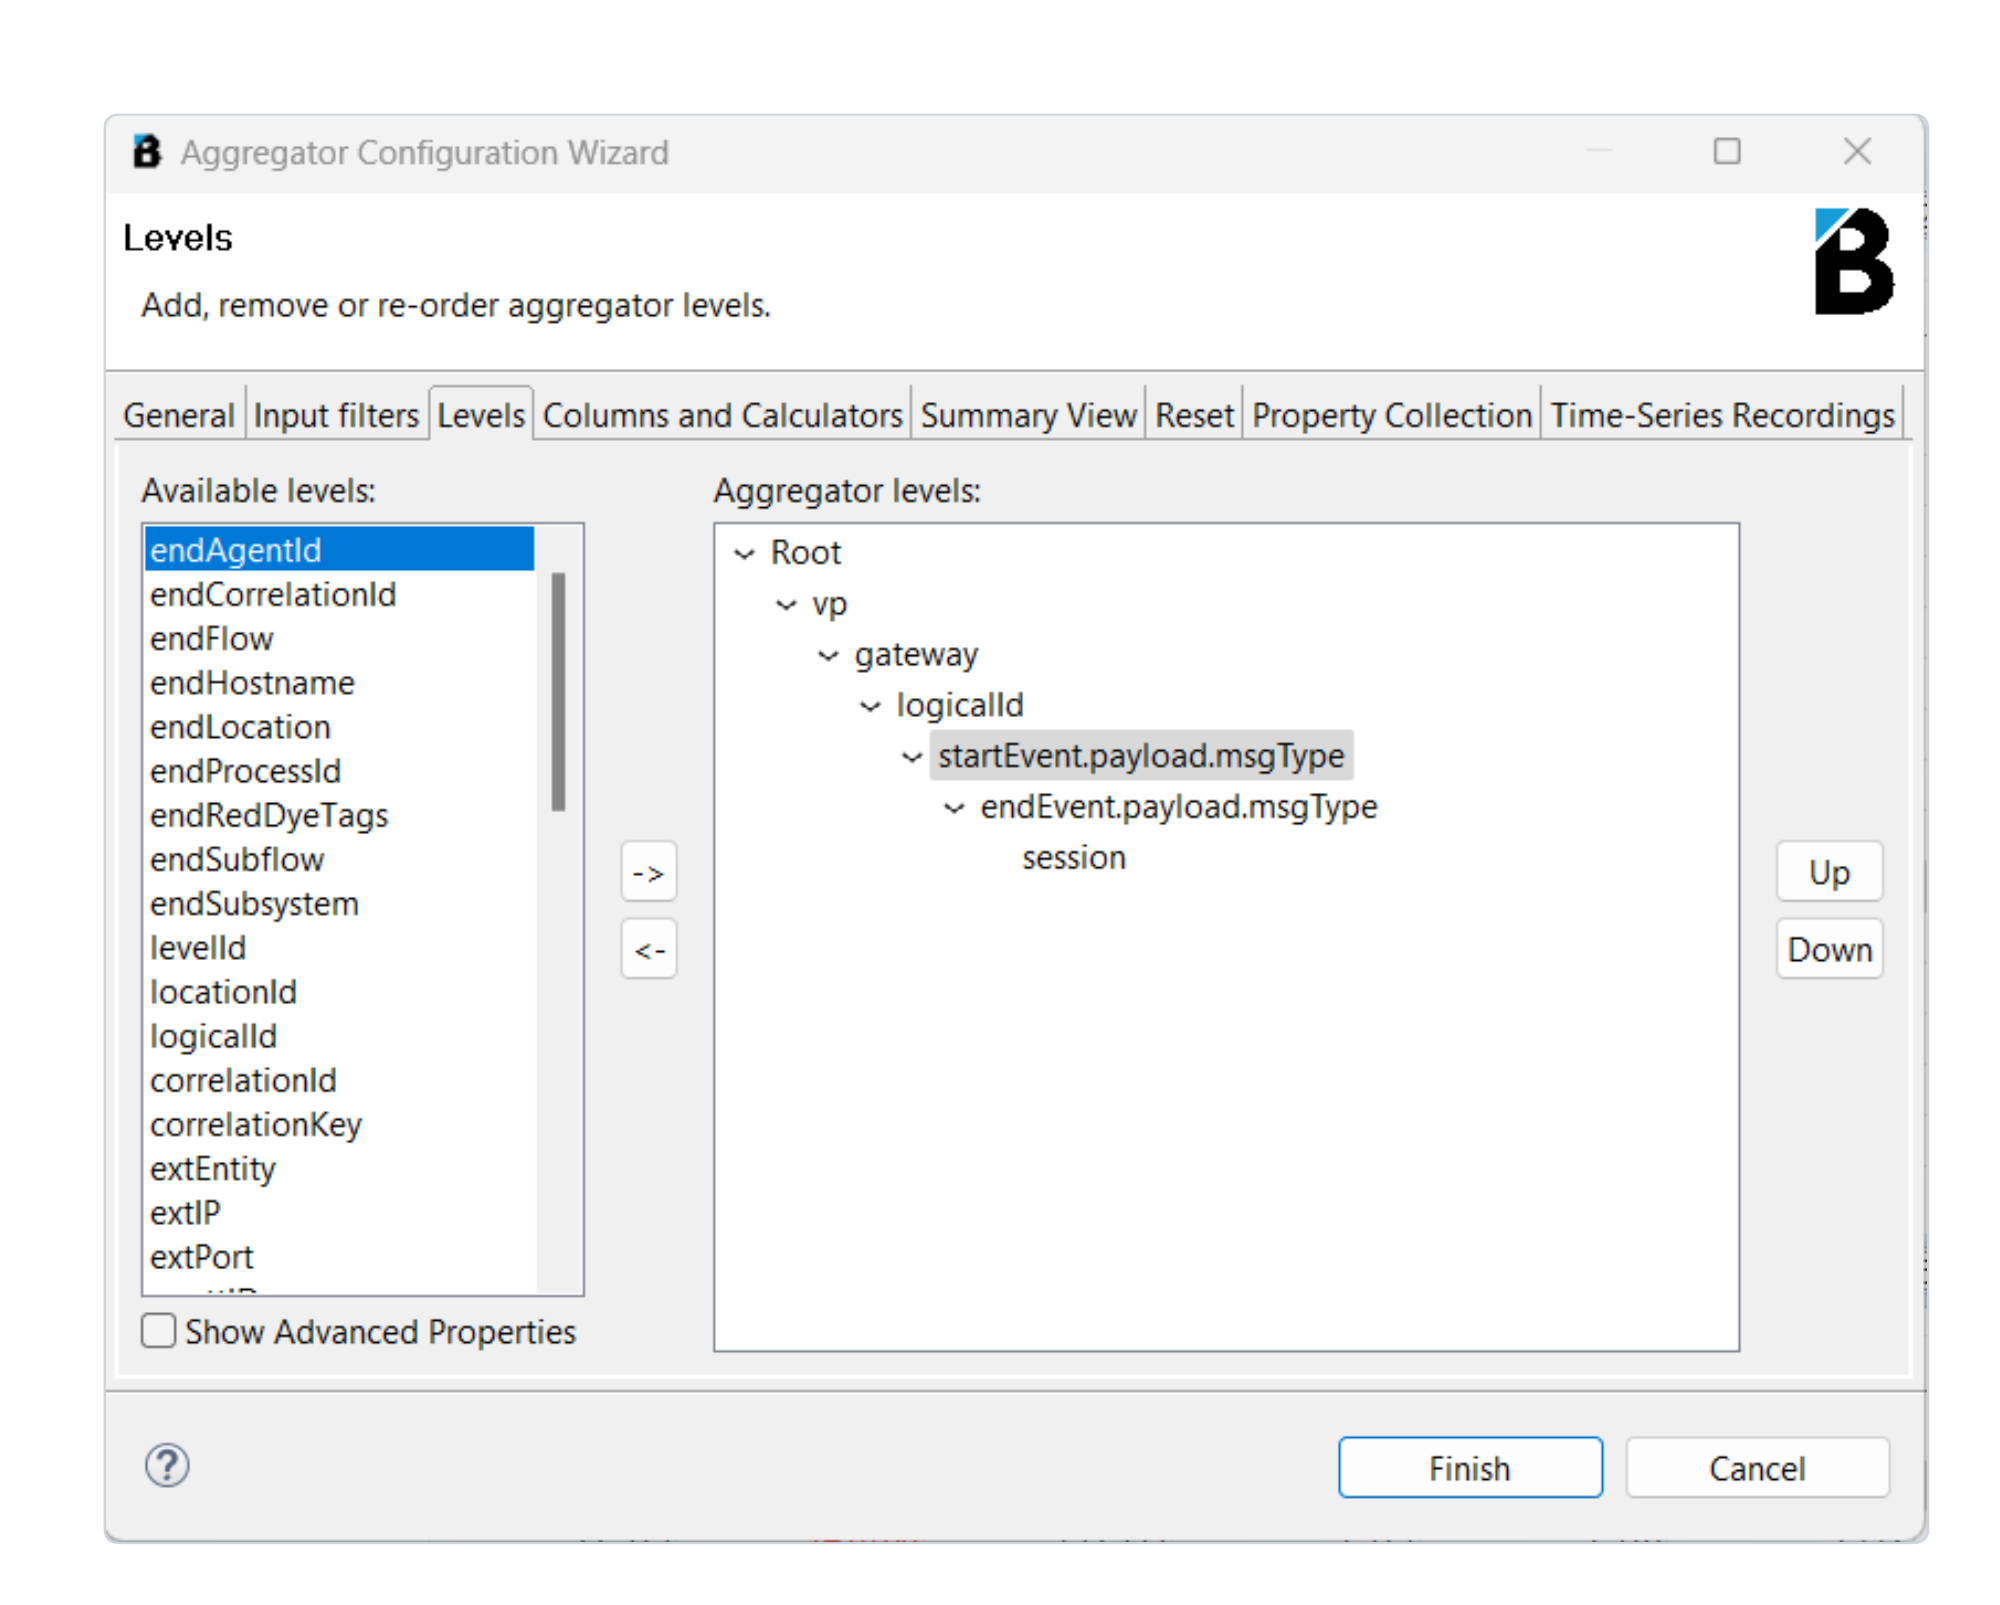
Configure the Aggregator levels in the Levels tab:
Complete the rest of the tabs as required.
Select Finish.
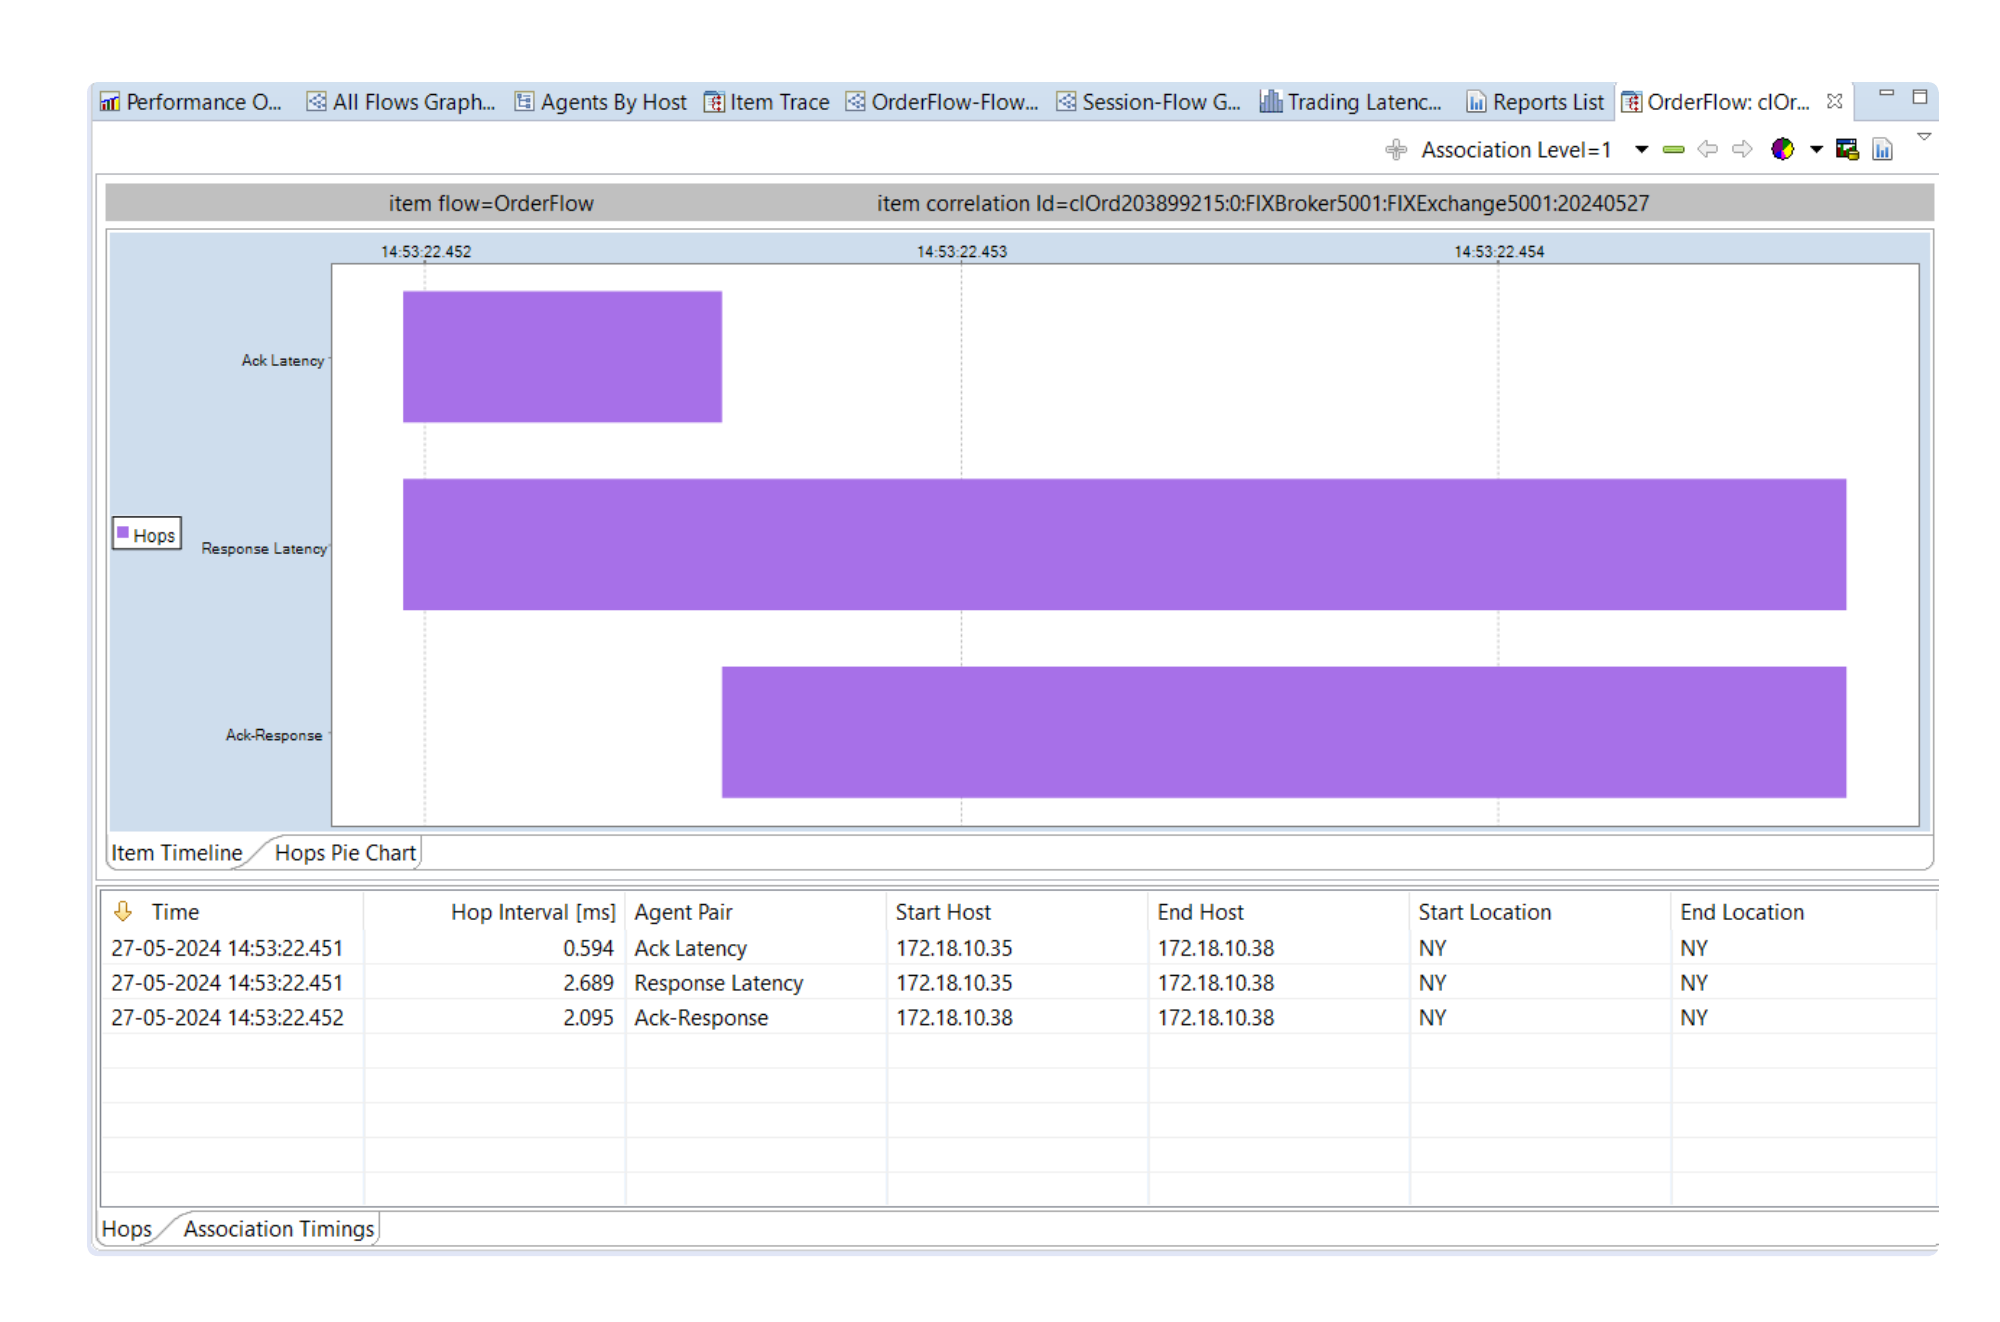
Viewing individual Items within the flow
The Item Trace view can be used to retrieve individual items that are recorded as part of each Flow. You can search by Flow, or by any of the other searchable attributes.
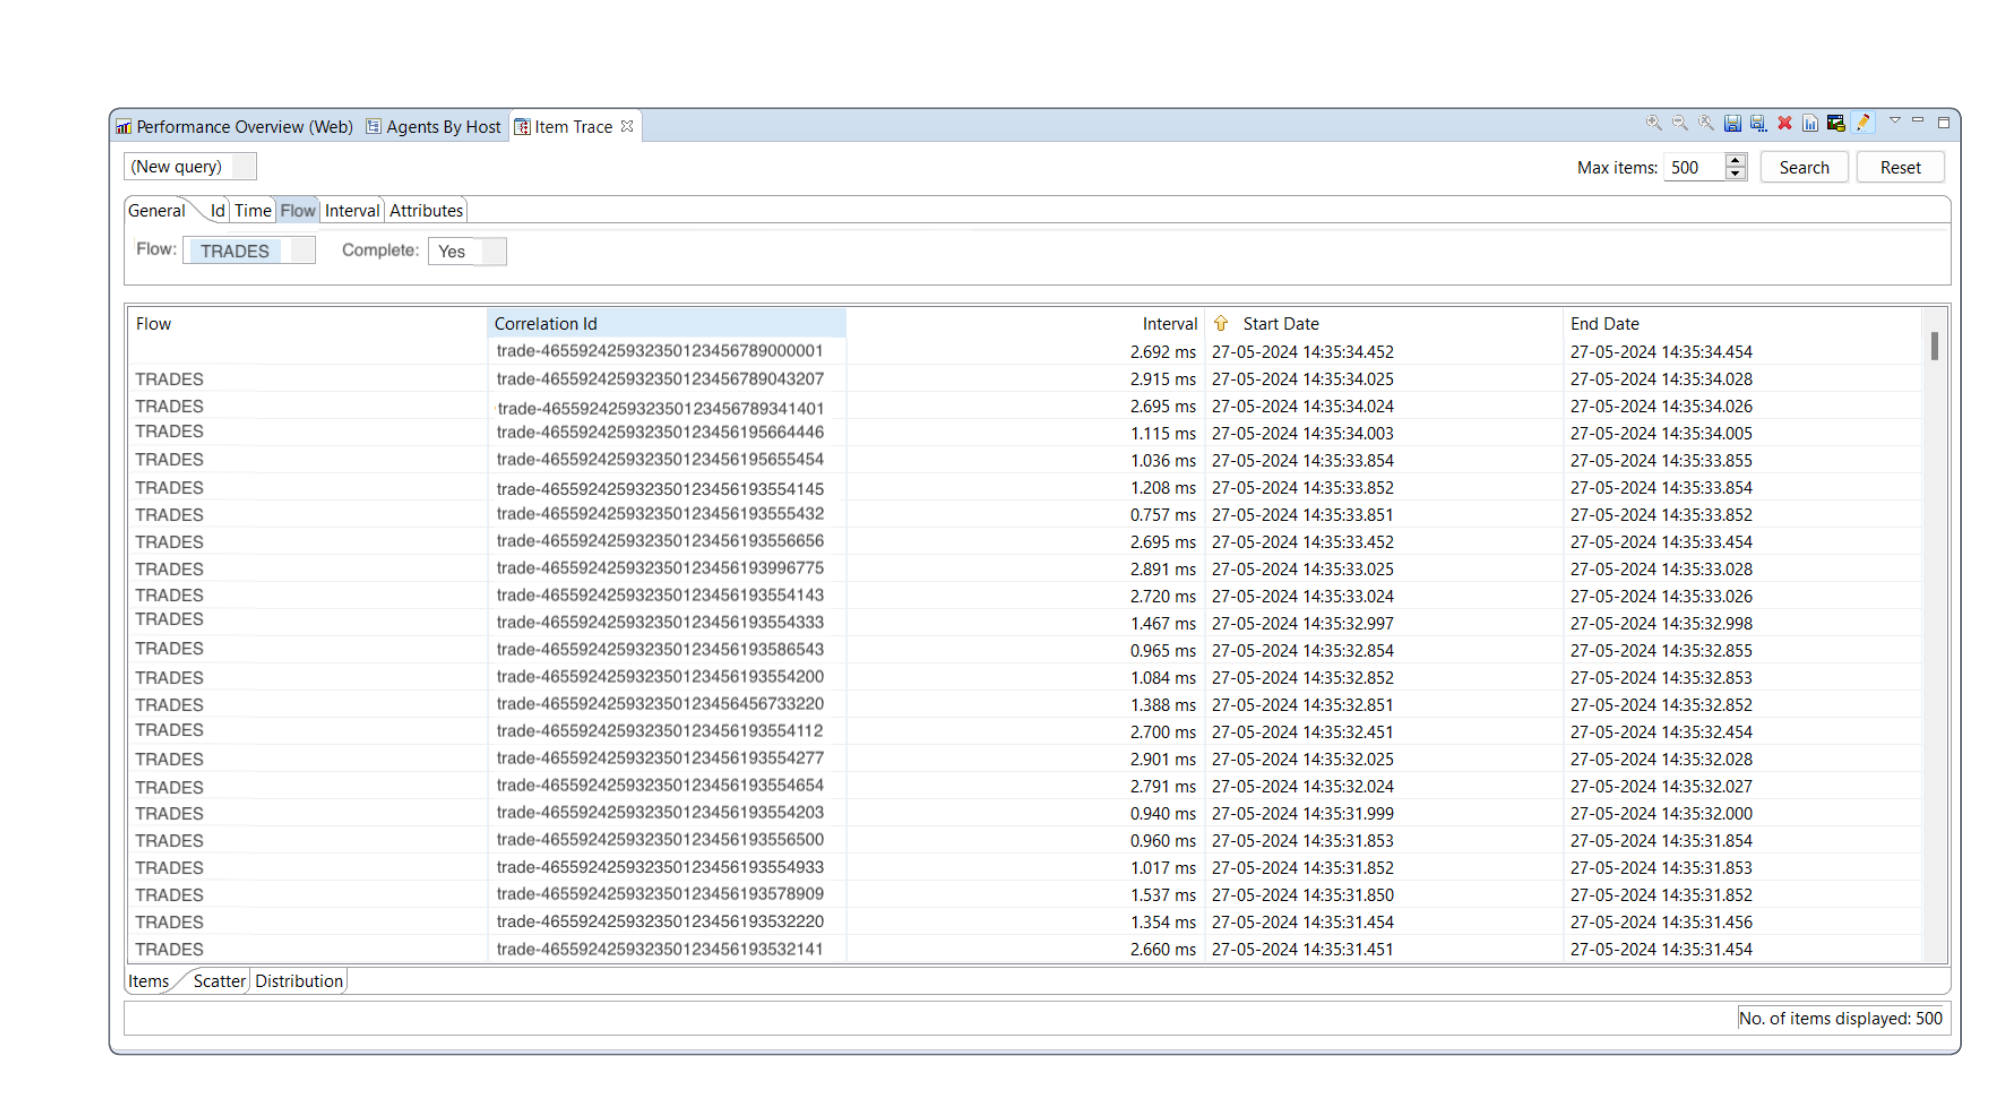
To list Trades, open the Item Trace view, select the Flow tab, choose Flow: TRADES and select Search.
The Trade Items are listed, initially showing the Flow that the Item belongs to, its Correlation ID, the Interval, and Start and End dates. If required, you can display additional columns by selecting them from a menu.
Properties view
Double-click on a Trade to display all of the properties of that trade in the Properties view. In the example below, the Properties view lists all the properties (capture attributes) that were captured as the Trade passed through the Agent Points, for example, the symbol, when it happened, the quote ID, the quantity and the price, as well as seeing this composite view of what the trade looks like.
In the Properties view, select the event chain to display the data that was captured at each Agent Point. This can be useful for support or troubleshooting an issue.
You can also display a Gantt visual display of the Item. This helps to visualise the different Intervals involved in the different stages of the workflow.