Beeks Analytics architecture is engineered to deliver on the four critical pillars of modern observability infrastructure: Open Architecture, Open Scaling, Open Consumption, and Open Data. Our goals are:
To operate with an open architecture, which provides the benefit of multiple high volume integration points with your organisation’s own systems.
Allowing your organisation to fully own the data produced by the Analytics system.
Enables the organisation to run the Analytics software on their own hardware.
To allow open scaling, which allows the capacity of the system to handle load to scale up with commercially available server hardware improvements.
To be modular and licenced to support open consumption.
This means that, for example, if you only need the high performing VMX-Capture layer and don’t require the in-depth analytics that the VMX-Analysis layer provides, we’ll ensure the software is licensed and priced accordingly.
It also means that we’re transparent about the drivers of our pricing - core count required for the analysis, which we make clear in our transparent performance metrics.
To support open data by ensuring that you have full access to, and control over, all monitoring data generated by the platform.
Rather than locking data into proprietary interfaces, our architecture emphasises direct and flexible data accessibility.
Our Advanced Configurable Decoder™ (ACD) ensures an agile, lower-cost way to monitor internal messaging data on the wire.
The Kafka-based Core Data Feed provides robust scalability and fault tolerance even under high message rates to provide lossless, low latency data streams. Use of Kafka frees you from vendor lock-in, since Kafka connectors exist for virtually every modern data processing framework, making it straightforward to combine Beeks Analytics output with your broader enterprise data.
For more information about the Beeks Analytics architecture as a whole, see the Analytics Concepts Guide.
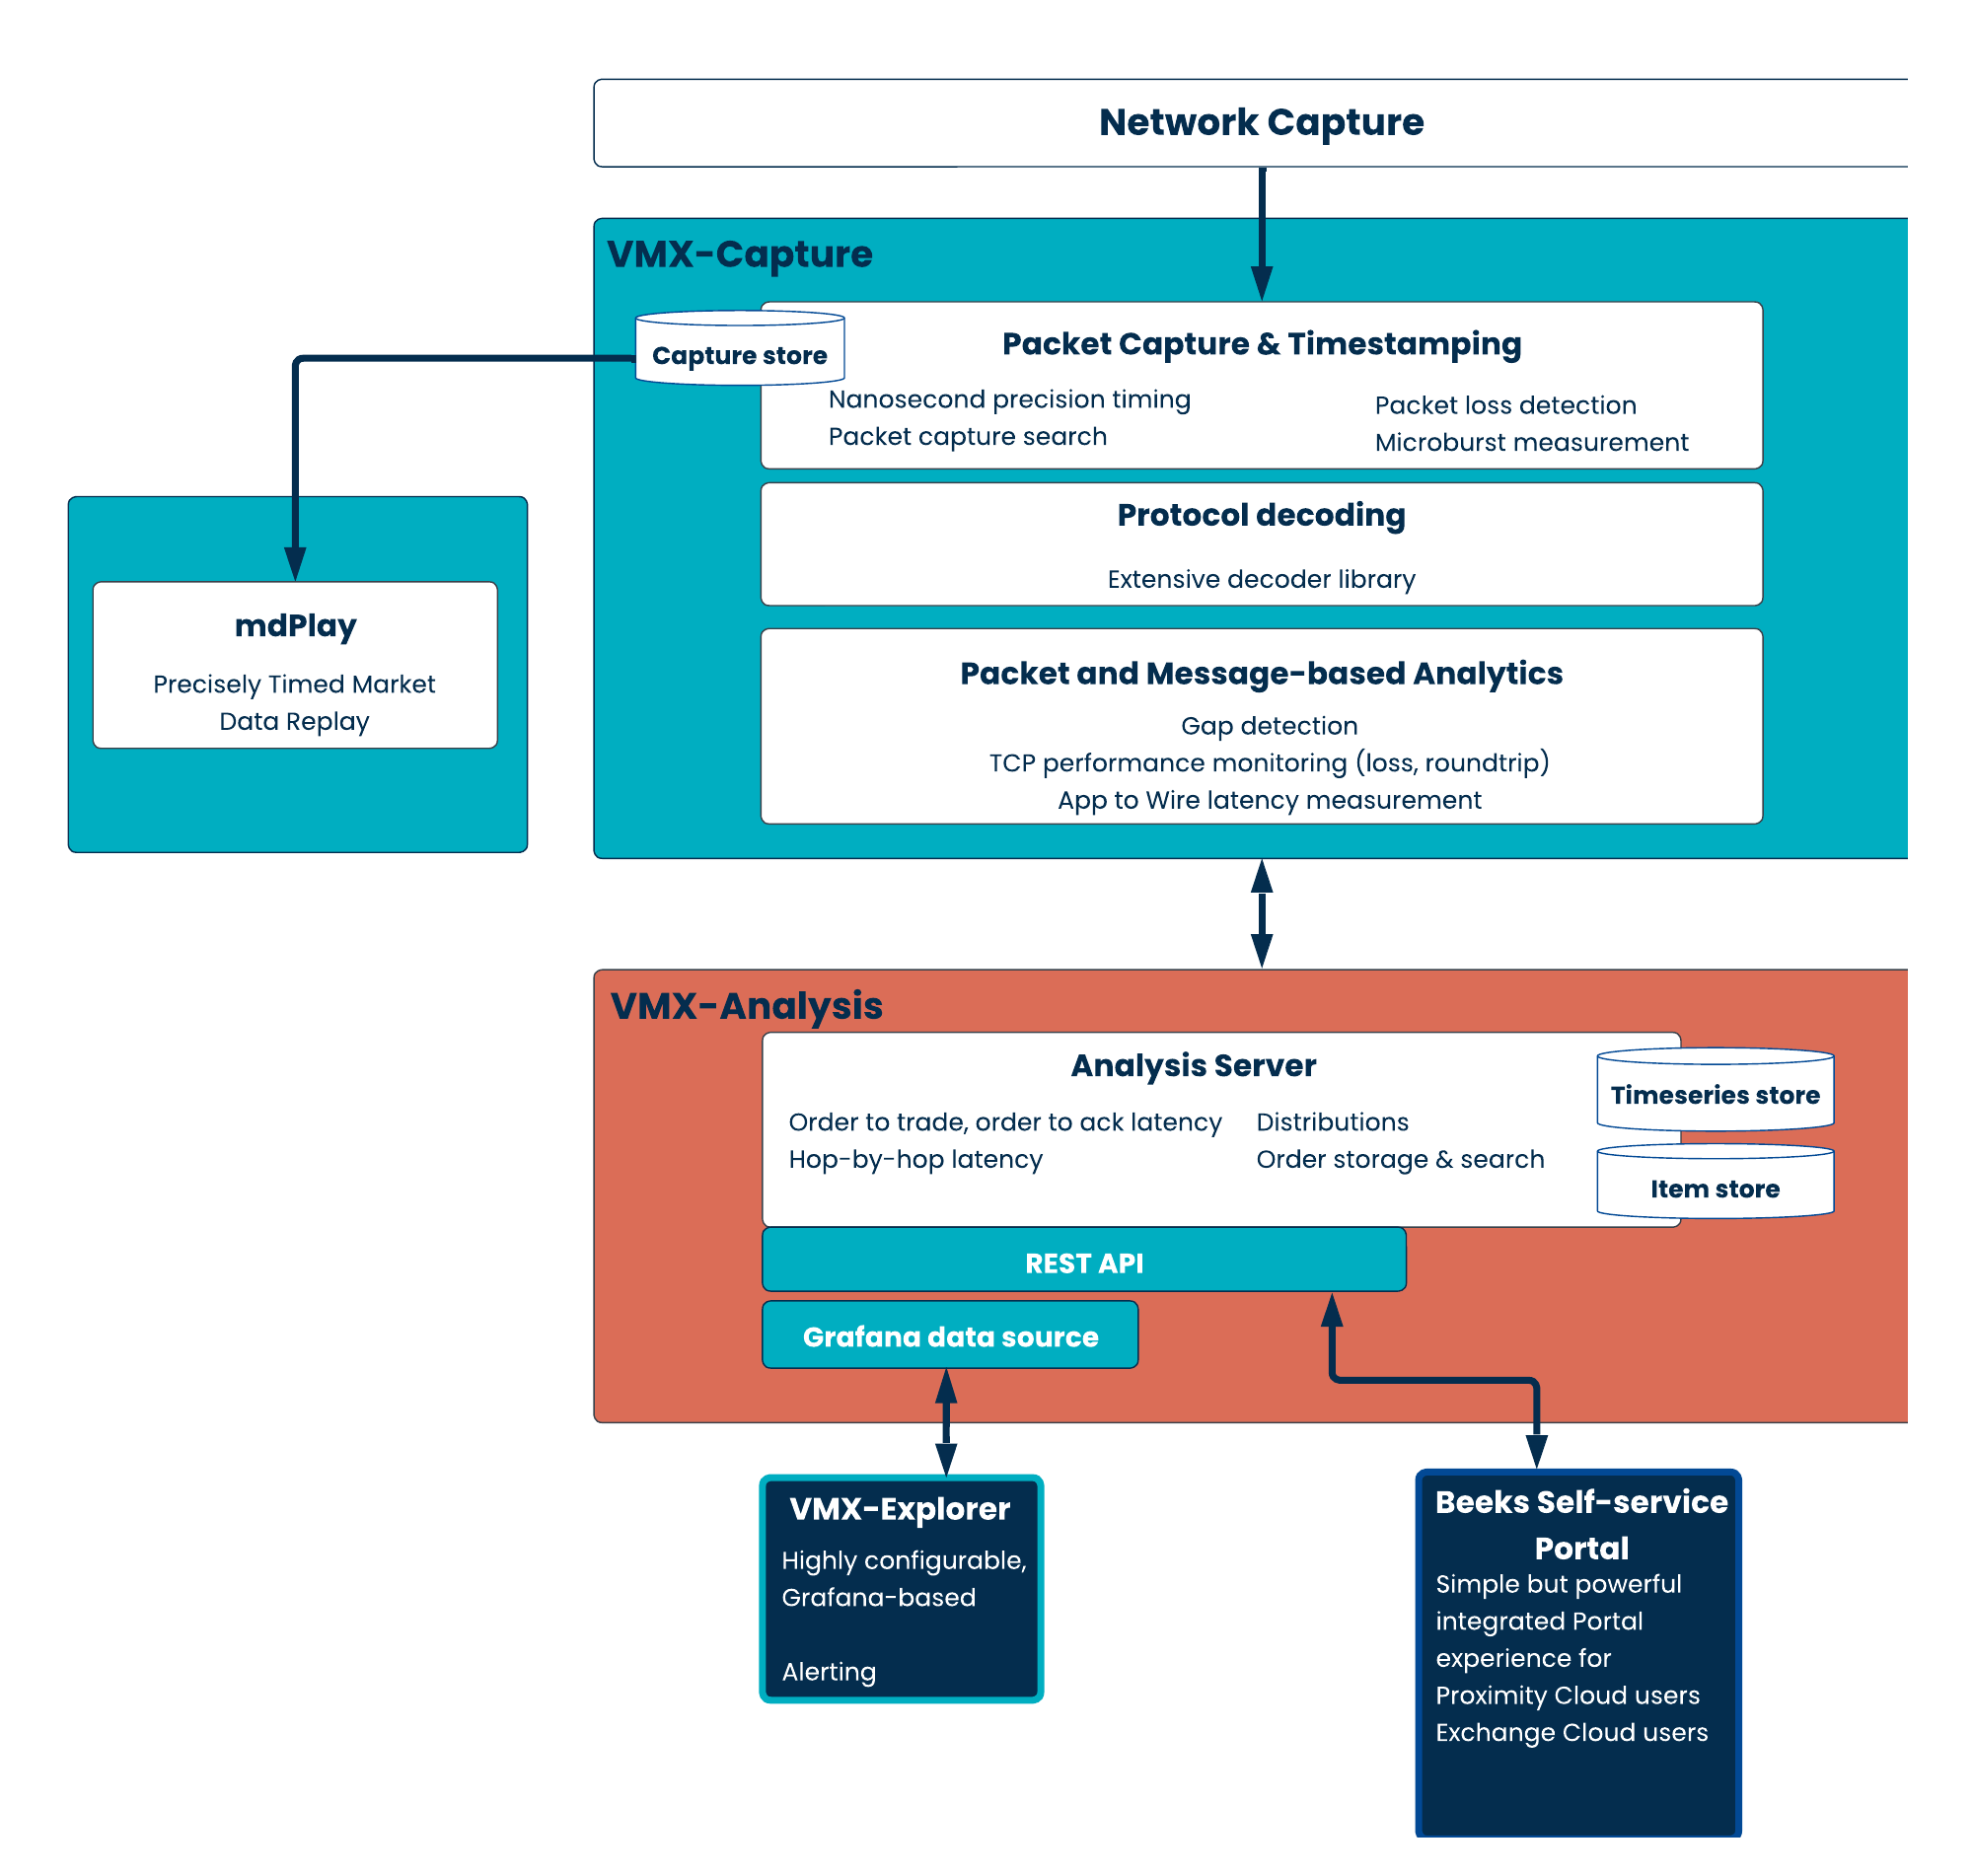
VMX-Capture
In Beeks Analytics, VMX-Capture is the layer responsible for data capture and decoding.
VMX-Capture is a set of software components that are specifically designed for high-performance packet capture, decoding, high-volume real-time analysis. It can produce a message output, statistical calculations based on the data, or an output of market data anomalies.
VMX-Capture is most commonly deployed on a Beeks Analytics appliance. However, it can also be installed on the client’s own hardware or on a cloud compute instance.
The simplest task that you can perform with Beeks Analytics is to use it as a packet capture appliance - that is, writing packets to disk and making them available for search and retrieval. This ability to capture high volumes of packets without dropping data acts as the building block on which higher-level services are built.
VMX-Analysis
In Beeks Analytics, VMX-Analysis is the layer that analyses the data from VMX-Capture to produce reports and views, and passes aggregated data and individual business items to VMX-Explorer for visualisation.
VMX-Analysis also presents a REST API to users to provide programmatic access to Beeks Analytics data.
Note that:
The REST API is a request/response API. Beeks Analytics also makes available a public/subscribe API called the Core Data Feed which can be more suited to interfacing with VMX-Capture layer directly, or for maintaining a streaming list of updating information from the VMX-Analysis server. The Core Data Feed is outside of the scope of the current document.
Although the REST API is presented by the Analysis Server (part of the VMX-Analysis architectural layer), the REST API is also used to query data from the VMX-Capture architectural layer.
Clients can deploy appliances which are exclusively for packet capture and/or streaming of decoded data to their own systems. These systems do not have the overhead of running a full VMX-Analysis instance running on them. In these cases, a thin deployment of VMX-Analysis which provides a more limited REST API and Grafana data source can be installed on the appliance.
VMX-Analysis can implement a rich item model which can allow multiple different messages to be correlated together. For more information about Items, see the Analytics Concepts Guide.
VMX-Explorer
VMX-Explorer is fed by the Beeks Analytics REST API.
VMX-Capture and VMX-Analysis - on a single appliance or scaled out for distributed capture
Another key element of the open architecture of Beeks Analytics is the scalability of VMX-Capture and VMX-Analysis. These components can both be deployed on the same hardware, or for higher scale deployments, VMX-Capture can run separately from VMX-Analysis. This allows, for example, VMX-Capture to be scaled locally (close to where the data is captured), with just a subset of the statistics being passed to a central VMX-Analysis server for analysis. VMX-Analysis will then only retrieve full packet data from VMX-Capture on request when a particular timeframe is investigated, reducing the amount of hardware that needs to deployed in order to manage high traffic volumes. This leads to the distributed capture paradigm allowing flexibility in building a capture and aggregation layer. Instead, clients can choose to have multiple capture points – while handling the analysis locally.
Related services
Market Data Packet Capture Services
Beeks Market Data Packet Capture Services enables exchanges to offer a service where their clients can access nanosecond-accurate packet captures of the exchange’s historical market data. These packet captures provide unparalleled precision and historical insights.
Built around the core VMX-Capture component of the Beeks Analytics architecture, Beeks Market Data Packet Capture Services uses a series of Beeks solutions including mdArchiver, mdSeed, mdVault, and mdPortal.
Beeks Market Data Packet Capture Services also use the mdPlay software (see above) to provide an mdPlay and (for exchanges who take the Beeks Exchange Cloud service) mdStream packet capture replay services, as optional extras to the service.
You can learn more about Beeks Market Data packet capture services, archiving, and storage in Beeks document BKDA017 From Capture to Client: Rethinking Exchange Packet Data.
Market Edge Intelligence
Market Edge Intelligence™ is a world’s first AI/ML analytics platform built for colocated capital markets infrastructure. It runs right where your trading happens, at the edge, delivering real-time insights when every nanosecond counts.
It turns raw infrastructure data into clear, actionable intelligence so you can spot issues, predict problems, and find hidden trading opportunities that traditional monitoring can’t detect, before they cost you.
Unlike closed, appliance-based platforms, Beeks embraces an open, modular architecture. The platform delivers real-time anomaly detection, forecasting, and predictive maintenance via GPU-accelerated models, while giving firms full ownership and accessibility over their data. Integration with open standards like Kafka and QuestDB ensures seamless ingestion, portability, and high-speed access for machine learning pipelines.
Market Edge Intelligence can be deployed as part of a Beeks Analytics deployment, or as standalone software.
Request the Edge Intelligence White Paper for further information about Beeks Market Edge Intelligence.
The QuestDB timeseries database and VMX-Explorer dashboards are the main integration points between Beeks Analytics and Market Edge Intelligence.