Purpose
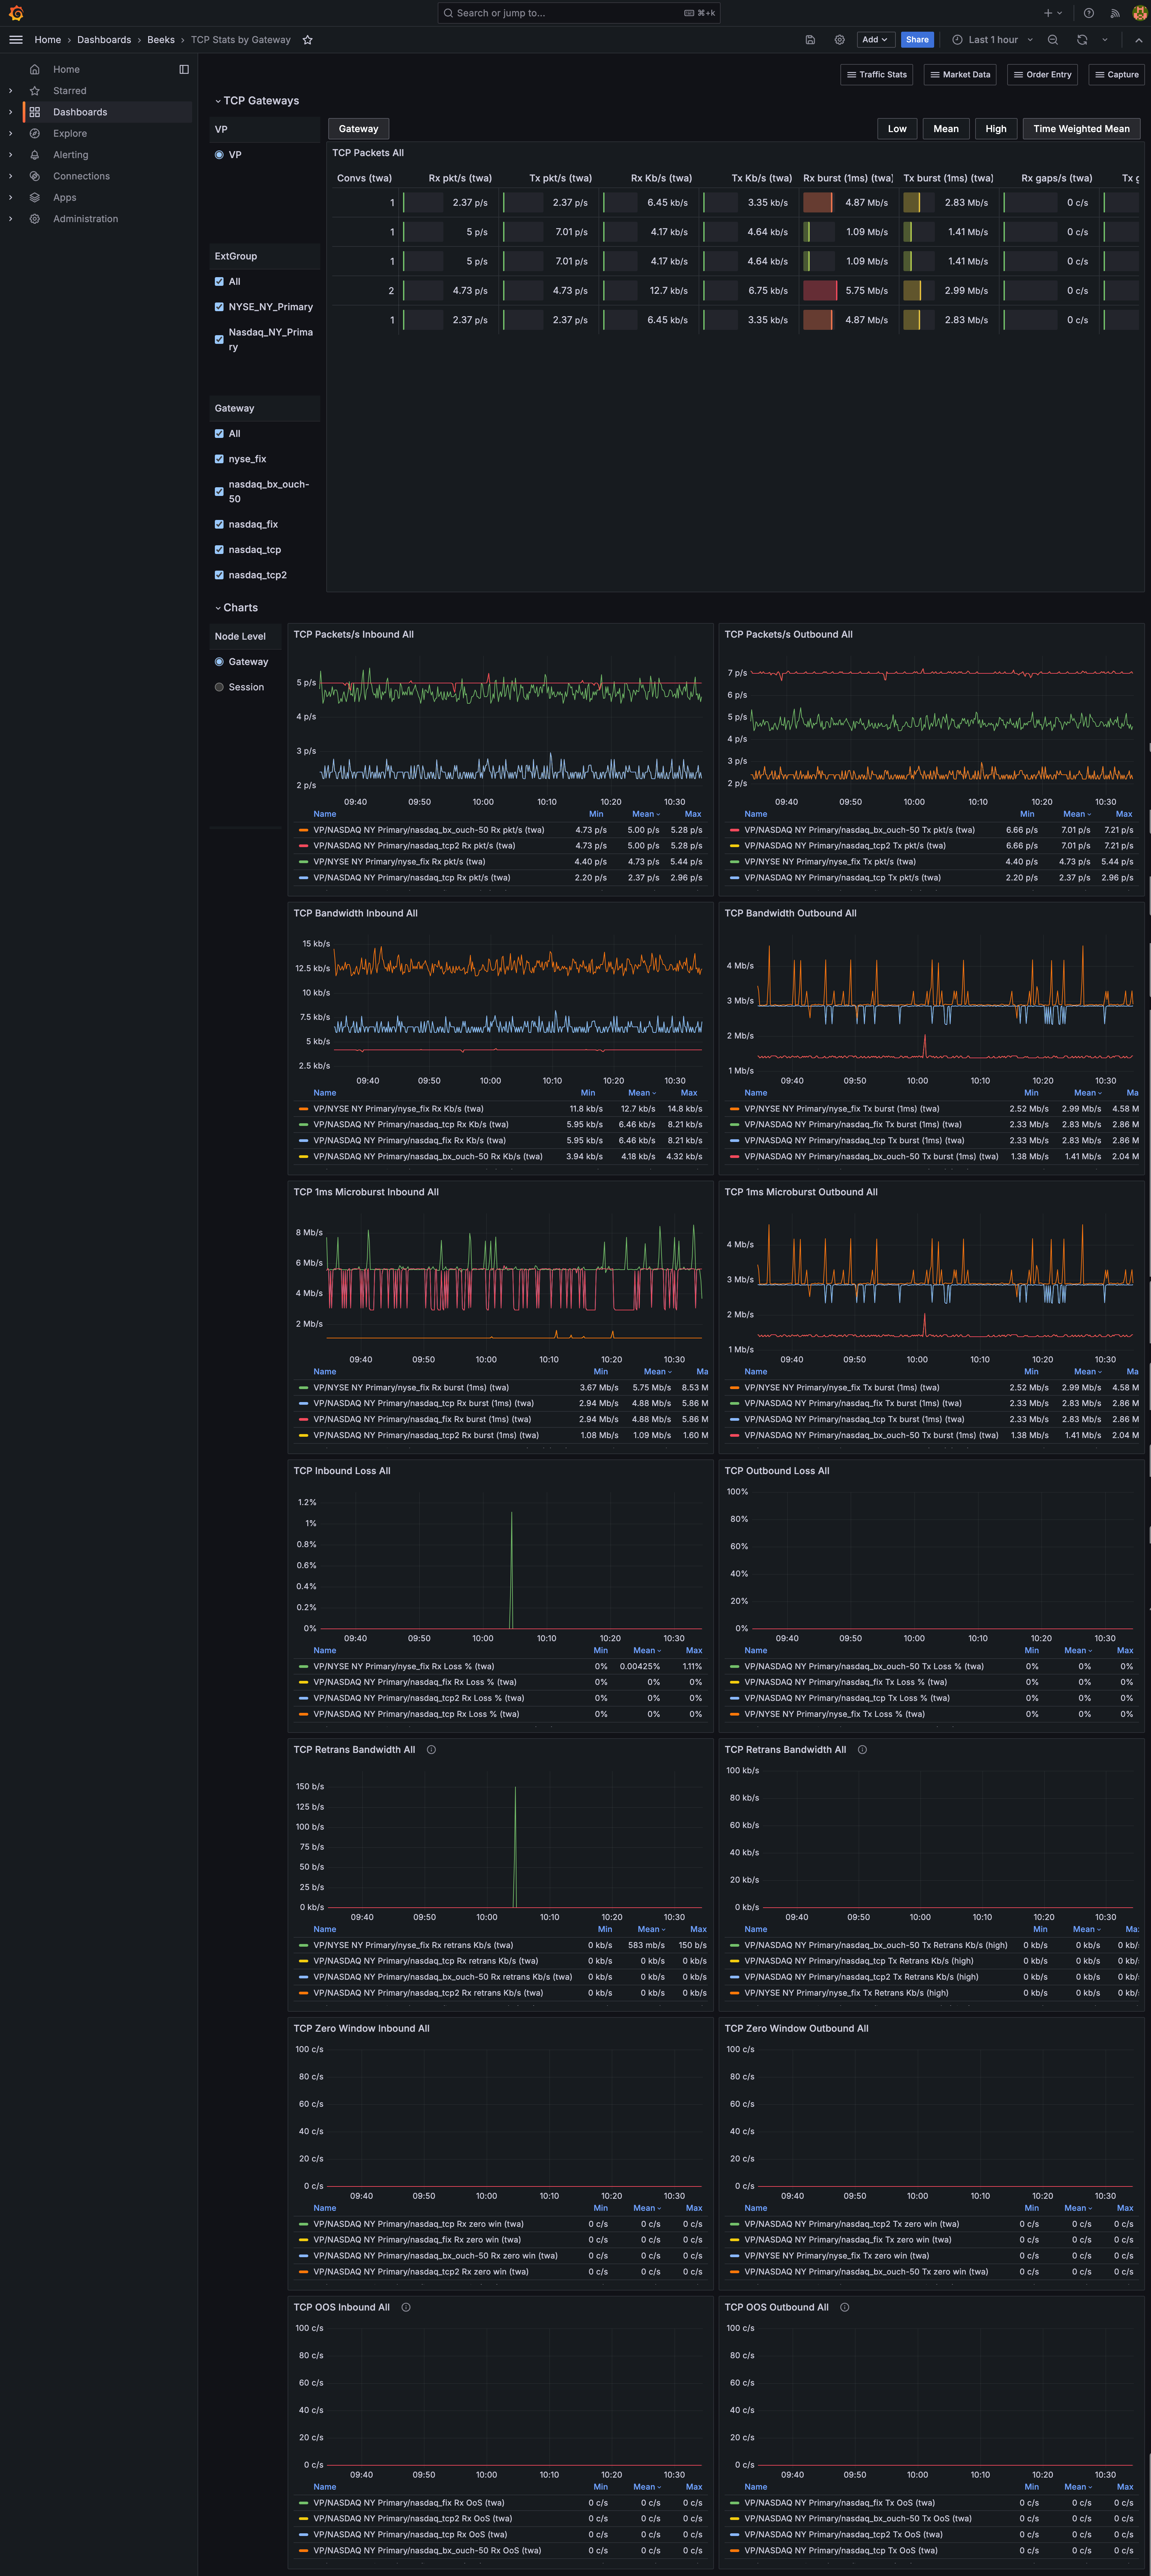
This dashboard shows the TCP statistics by gateway. Please see the Common Use Cases section in Beeks Document BKDA004 VMX-Explorer User Guide for an example of use.
Usage instructions
The user can switch between Visibility Points and select the set of ExtGroup’s and Gateway’s to view.
In the visualisations, you can switch between Gateway and Session views.
You can also switch between Low, Mean, High, Time Weighted Mean, Difference and Range to view different aspects of the data.
Panel overview
The TCP Gateways panel is:
TCP Packets All
The Charts panels are:
TCP Packets per second Inbound All
TCP Packets per second Outbound All
TCP Bandwidth Inbound All
TCP Bandwidth Outbound All
TCP 1ms MicroBurst Inbound All
TCP 1ms MicroBurst Outbound All
TCP Inbound Loss All
TCP Outbound Loss All
TCP Retrans Bandwidth All
TCP Retrans Bandwidth All
TCP Zero Window Inbound All
TCP Zero Window Outbound All
TCP OOS Inbound All
TCP OOO Outbound All