Key appliance logfiles can be viewed in VMX-Explorer (version 17 and later).
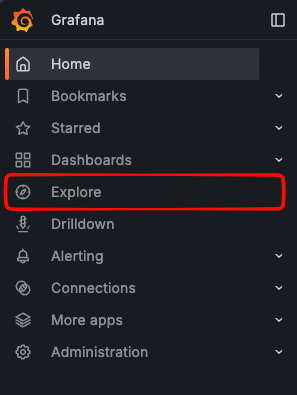
In VMX-Explorer, open the left-hand side menu and select Explore.
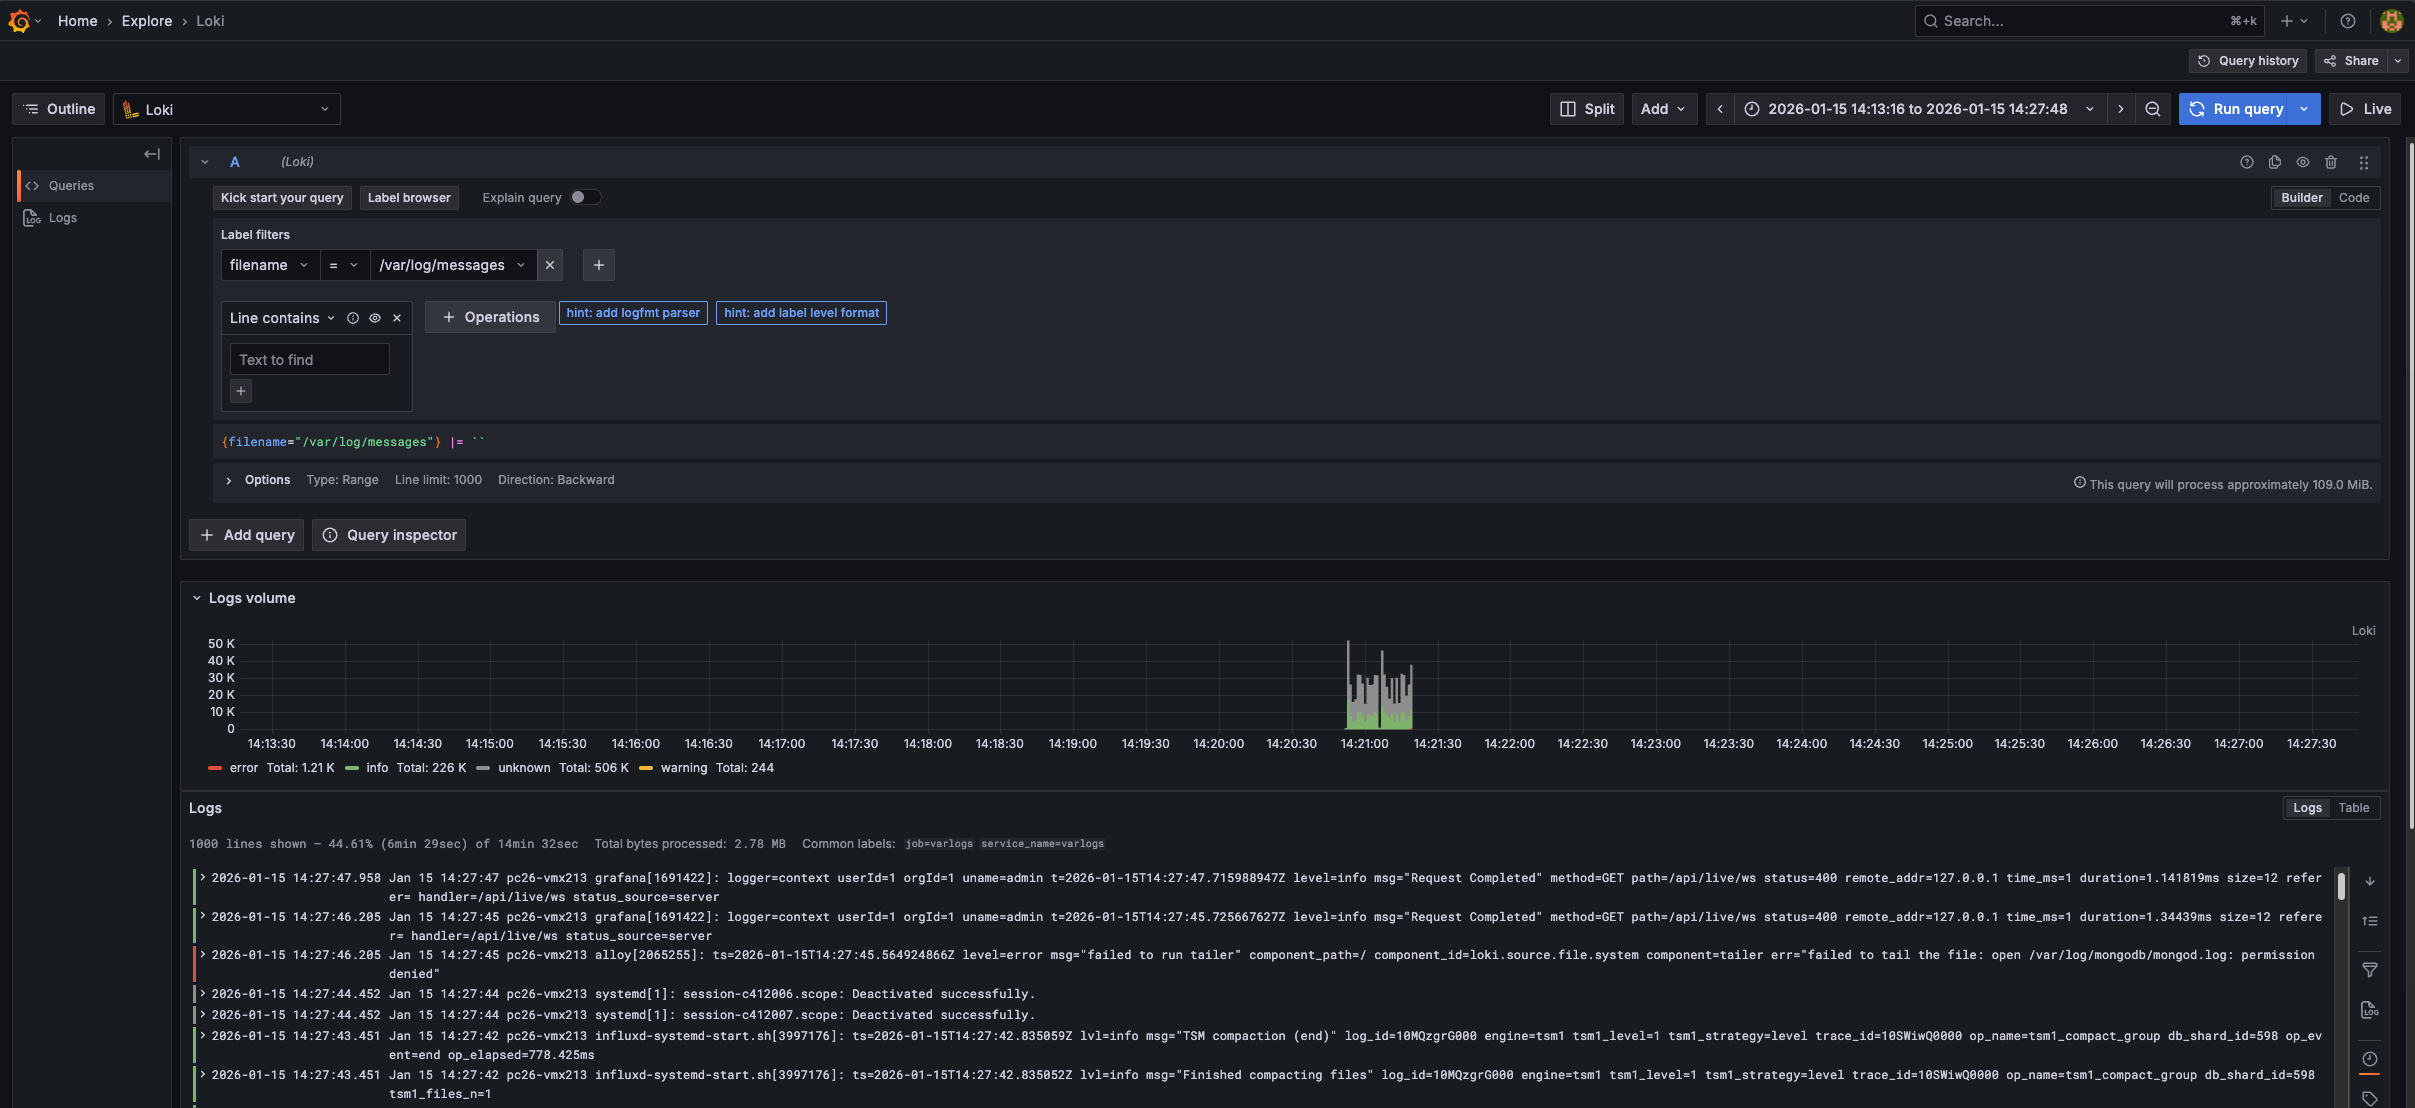
In the Label filters, select filename and then choose the appropriate filename from the list.
The logfiles will display in the panels below:
Available options include the following:
Logfile | Purpose |
|---|---|
/var/log/keycloak/keycloak.log | Logs related to auth/login via Keycloak |
Operating system and package management logs: /var/log/dnf.log | Record operating system package management activity, including software installs, removals, and updates performed on the appliance. Usually not required unless requested by Beeks Support. |
Apache web server logs:
| Record incoming web and API requests to the appliance, along with errors, authentication failures, and SSL/TLS issues. They are primarily used to troubleshoot UI access problems, API errors, or certificate-related connectivity issues. |
/var/log/grafana/grafana.log | Logs related to the grafana service |
/var/log/messages | Additional rsyslog output, extremely verbose |
/var/log/mongodb/mongodb.log | Mongo DB log (unlikely to cause/report an appliance breaking issue) |
/var/log/tipoff.log | Check here for tipoff process errors, e.g. pmux (stack probes, capture probes & mappers) & p3’s |
/vmx/db/questdb/<questInstance>/questdb-rolling.log.<datestring> | Check here for errors on the QuestDB instance |
<logdir>/velocimetrics.log | Check outcome of starting vmx-server. Logs any errors related to server startup. |
<logdir>/webConsole.log | Check here for API or auth errors (often errors on the PRISM dashboard, that dont pass auth will show up in this log rather than prism.log) |
<logdir>/prism.log | Check here for errors with the PRISM process. |
Learn more about Grafana logfile exploration in the Grafana documentation.