In this section, we describe the architecture and workflow in the Beeks Analytics solution in the Beeks Analytics product suite.
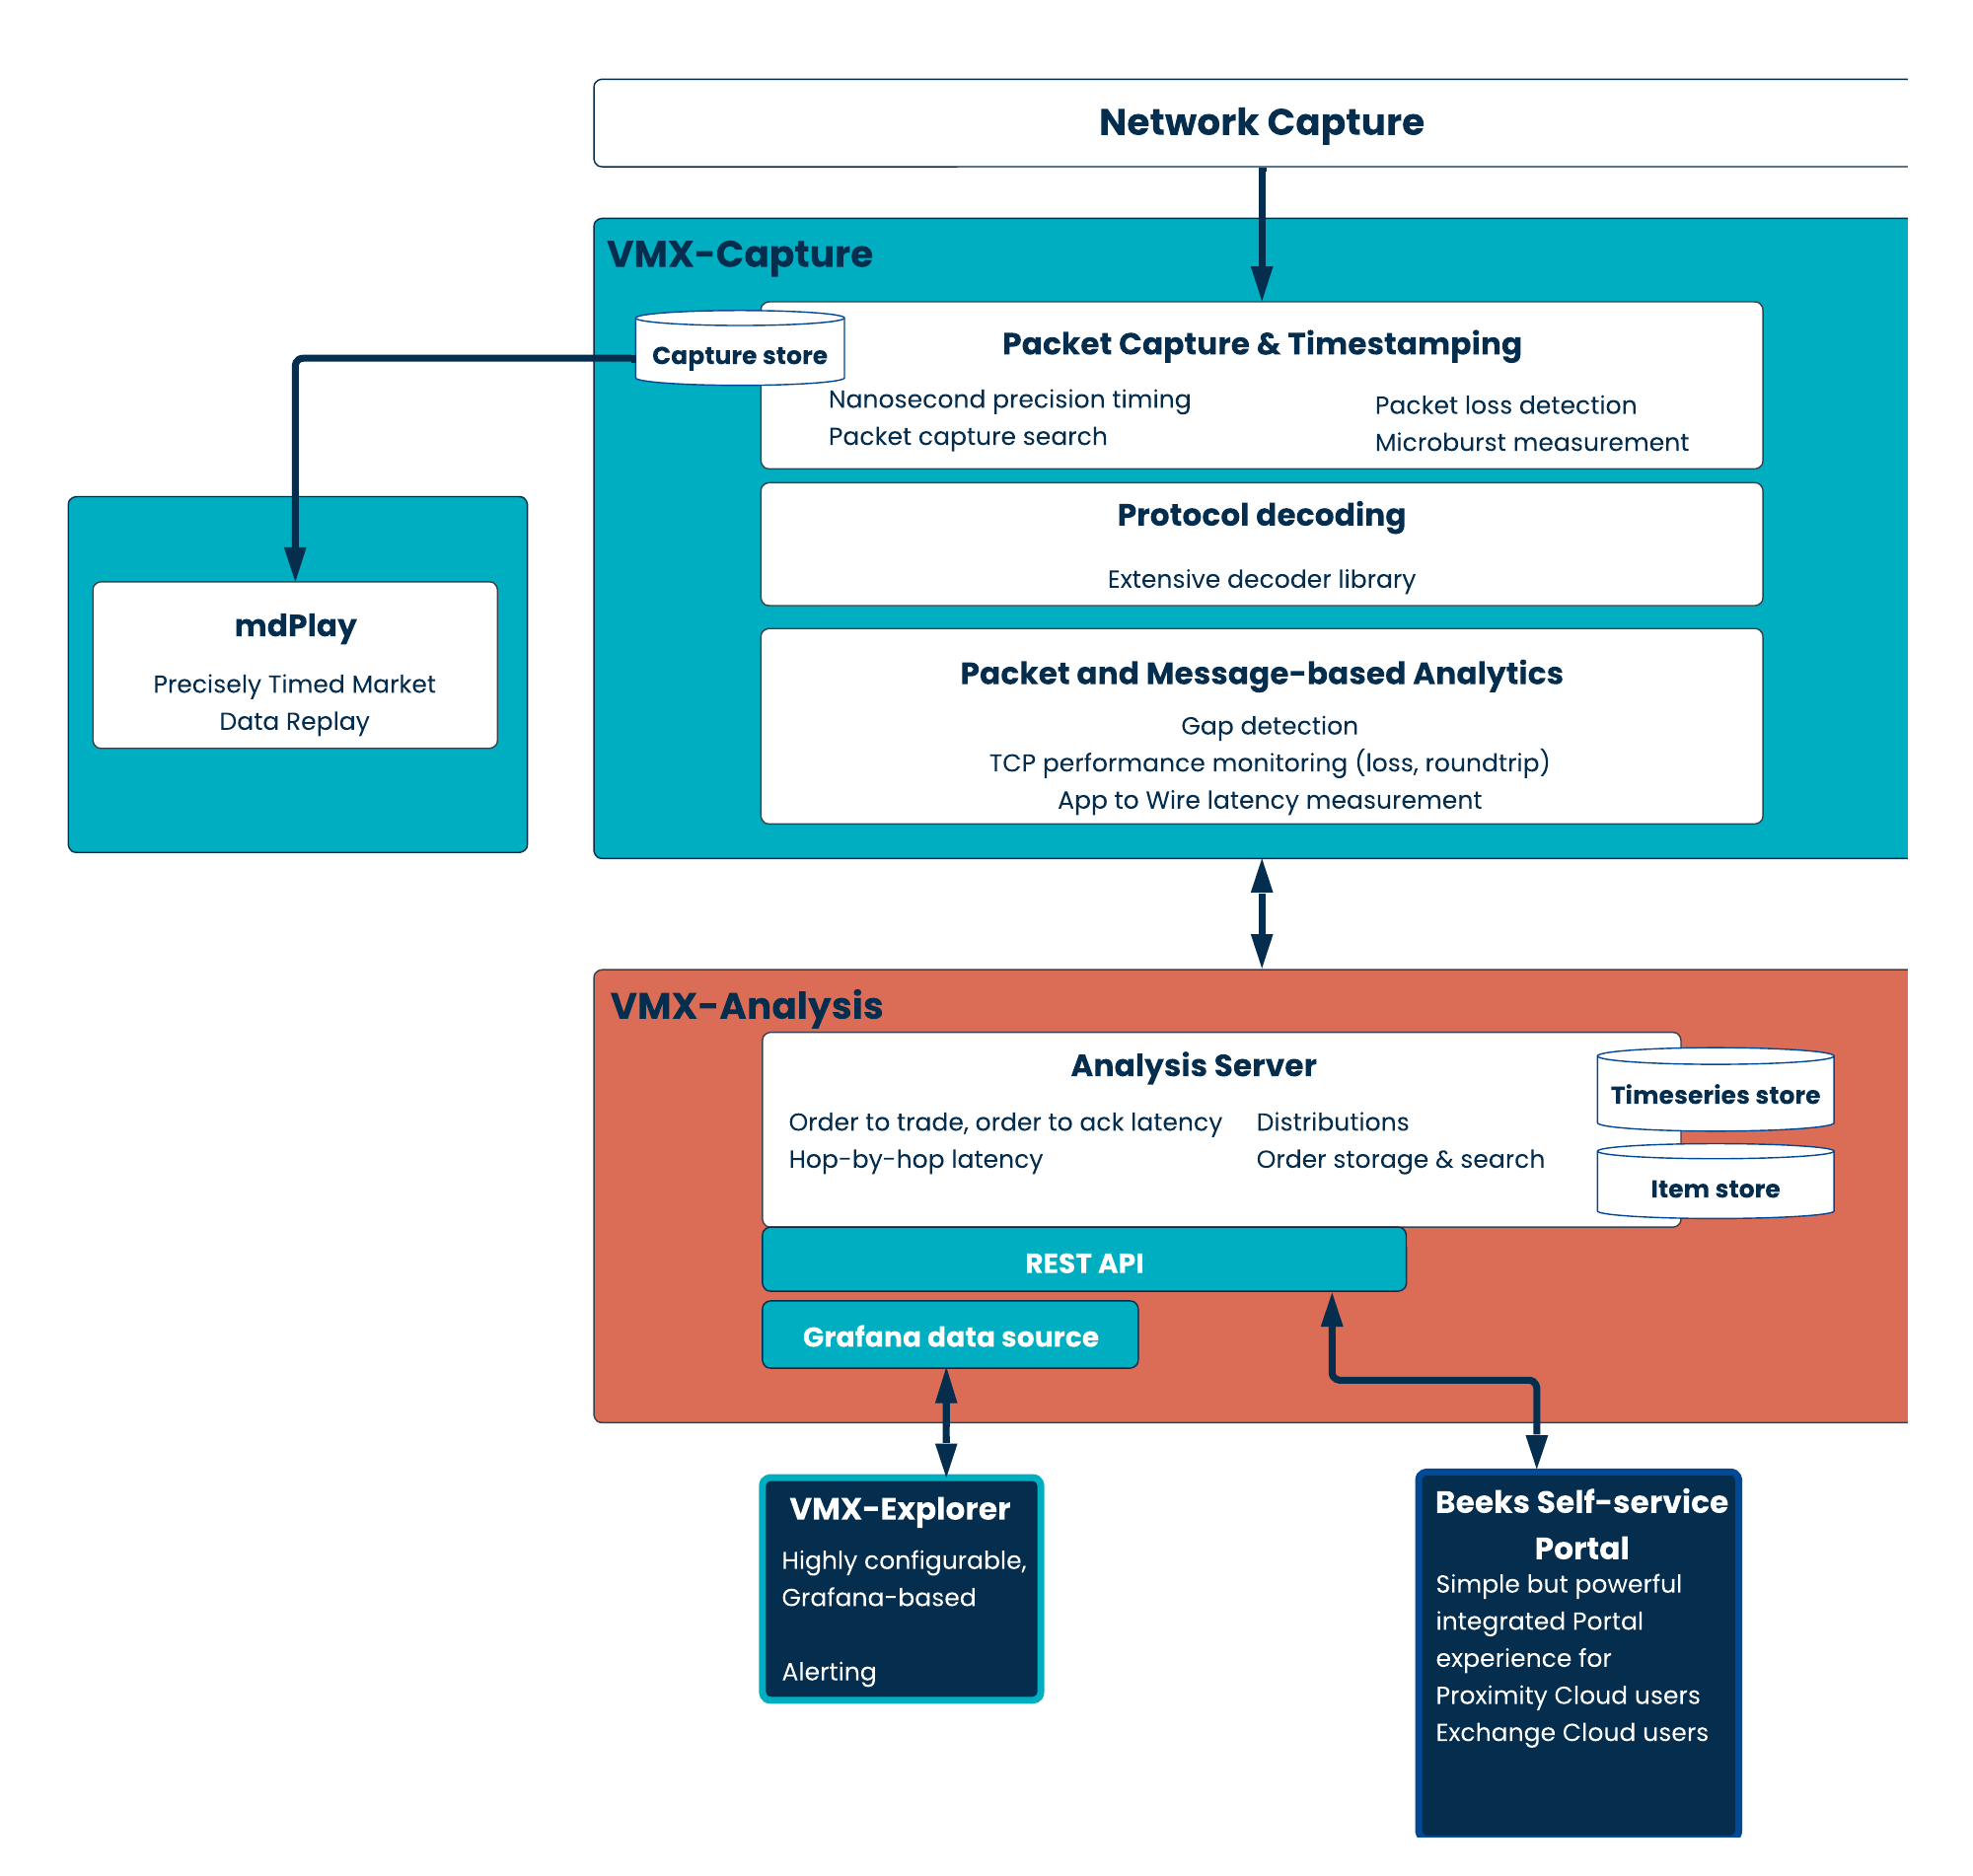
The diagram below is a high-level view of the main components and workflows in Beeks Analytics.
For a more detailed introduction to Beeks Analytics architecture, see the Analytics Concepts Guide.
The goals behind the Beeks Analytics architecture are as follows:
To operate with an open architecture, which provides the benefit of multiple high volume integration points with your organisation’s own systems.
Allowing your organisation to fully own the data produced by the Analytics system.
Enables the organisation to run the Analytics software on their own hardware.
To allow open scaling, which allows the capacity of the system to handle load to scale up with commercially available server hardware improvements.
To be modular and licenced to support open consumption.
This means that, for example, if you only need the high performing VMX-Capture layer and don’t require the in-depth analytics that the VMX-Analysis layer provides, we’ll ensure the software is licensed and priced accordingly.
It also means that we’re transparent about the drivers of our pricing - core count required for the analysis, which we make clear in our transparent performance metrics.
To support open data by ensuring that you have full access to, and control over, all monitoring data generated by the platform.
Rather than locking data into proprietary interfaces, our architecture emphasises direct and flexible data accessibility.
Our Advanced Configurable Decoder™ (ACD) ensures an agile, lower-cost way to monitor internal messaging data on the wire.
The Kafka-based Core Data Feed provides robust scalability and fault tolerance even under high message rates to provide lossless, low latency data streams. Use of Kafka frees you from vendor lock-in, since Kafka connectors exist for virtually every modern data processing framework, making it straightforward to combine Beeks Analytics output with your broader enterprise data.
Key Architectural Components
The main elements in the Beeks Analytics architecture are:
VMX-Capture is the layer responsible for data capture and decoding. It uses stack probes to monitor traffic, and can scale horizontally per CPU by segregating traffic load to different CPUs.
VMX-Analysis is the layer that analyses the data from VMX-Capture to produce reports and views, and it makes 'business sense' of the VMX-Capture information by presenting the information as business-level flows. These business-level flows can form the basis of more complex correlations than VMX-Capture can perform.
Learn more about VMX-Capture in the Beeks Analytics Configuration Guide for VMX-Capture.
Learn more about VMX-Analysis in the Beeks Analytics Configuration Guide for VMX-Analysis.
Beeks Analytics User Interfaces
The following user interface tools are available to view your Beeks Analytics data:
In Beeks Analytics, VMX-Explorer is a Grafana-based web user interface, and is where Beeks Analytics visualises the analytics provided by VMX-Analysis. VMX-Explorer is fed by the Beeks Analytics REST API.
For users of Beeks Proximity Cloud or Exchange Cloud, we’ve also built visualisations of some standard Beeks Analytics metrics into the Beeks Portal.
Learn more about VMX Explorer in the Beeks Analytics User Guide for VMX-Explorer.
Learn more about Beeks Analytics within the Portal in the Customer Portal User Manual.
Beeks Analytics Data Interfaces
As part of its open architecture, Beeks Analytics offers many different points for you to access analytics output. This flexibility provides Beeks Analytics users with the following benefits:
Match the interface to your requirements
Use a RESTful API for request/response access to analytics or use a publish/subscribe streaming interface for consumption of individual messages or ongoing big data system integration.Consume high-volume data as close to the source as possible, with minimal processing overhead
If you want to consume high-volume data cost-effectively (e.g., near real-time message decodes or notifications of gaps), you’ll need to be able to scale your costs and deployments linearly, as opposed to the wasteful step costs involved in appliance-based licencing models.Perform interactive analysis directly within the analytics platform using SQL
Use the new Beeks Analytics CDF-Q interface to query decoded messages and statistics in situ from the QuestDB timeseries store, ideal for dynamic exploration, rapid prototyping, or building ad hoc dashboards without needing to egress the data.