Aggregators define how data in Beeks Analytics is “sliced and diced” for use in analytics. This section describes some of the Aggregators available in the Beeks Analytics for Markets template. Each Aggregator contains a unique set of metrics that are applied to the data at different levels (or nodepaths). An example of metrics is Rx Microburst (1ms), which measures incoming microburst at the chosen nodepath.
The levels are:
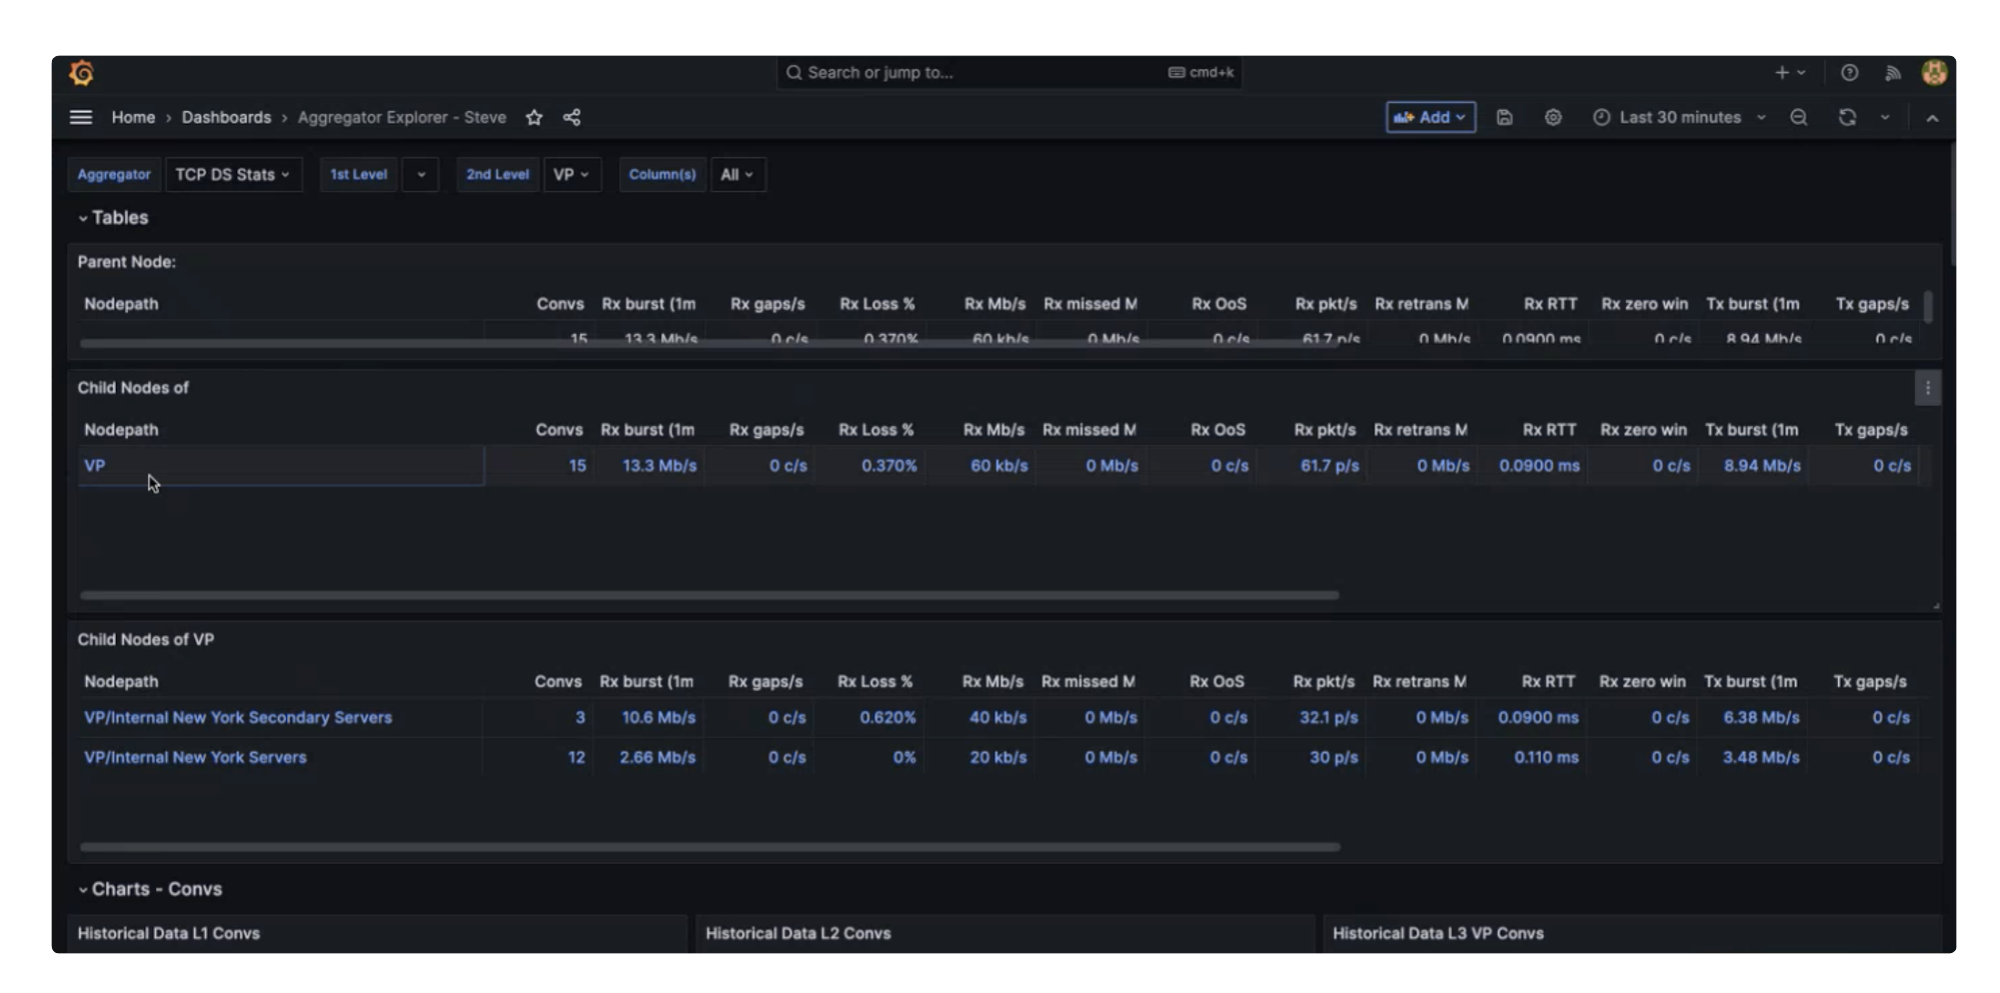
PARENT NODE
The top level nodepath. All data that is processed by this Aggregator is shown at this level. By viewing the data at the top level, you can inspect all the data that is processed by the aggregator.
> CHILD NODES OF Parent Nodepath
The data from each Visibility Point, displayed separately for each Visibility Point. By viewing the data at this level, you can inspect all the data that comes from an individual Visibility Point.
> > CHILD NODES OF Visibility Point Nodepath
The data from each Internal or External Group Group within the data from each Visibility Point. For example, for Proximity or Exchange Cloud Internal aggregators, this is from each Dedicated Server. By viewing the data at this level, you can inspect all the data that comes from an individual Individual or External Group.
Some Aggregators have an additional level which allows further breakdowns.
For example, you can view which External Groups a particular Dedicated Server is communicating within the TCP_ExtGrp_DS_stats aggregator.
Another example is the MD Stats Aggregator, which allows you to drill down into the physical port that the traffic was received from (in some cases), and the specific feed and/or channel that is published by a particular External Group.
Aggregator data can be visualised in various ways in VMX-Explorer, but if you visualise the data as a table, then each metric will be displayed as a column and the nodepath levels are the rows.
The table below describes some of the Beeks Analytics for Markets Aggregators at a high level. All of the Aggregators listed support breaking down statistics by Visibility Point.
Aggregator Type | Aggregator Name | Protocol | Nodepath | Purpose |
|---|---|---|---|---|
Network Monitoring (see Network protocols monitored by Beeks Analytics for Markets for details of the metrics available in these aggregators) | TCP_DS_stats | TCP | vp/intentity/session | View statistics about an individual Internal Group. |
TCP_ExtGrp_DS_stats | TCP | vp/extgroup/intentity/session | An extension of the TCP_DS_stats aggregator. View statistics about an individual External Group, or view DS information per External Group which that DS communicates with. | |
IP_DS_stats | IP | vp/intentity/probeName/session | View statistics about an individual Internal Group. | |
IP_ExtGrp_stats | IP | vp/extGroup/probeName/session | View statistics about an individual External Group. | |
IP_ExtGrp-DS_stats | IP | vp/extgroupDS/probeName/session | An extension of the IP_ExtGrp_stats aggregator. View statistics about an individual External Group, or view DS information per External Group which that DS communications with. | |
Market Data Monitoring | UDP_stats | UDP | vp/extgroup/switchport/probeName/session | View statistics about an individual External Group. |
MD_stats | Market Data | vp/extgroup/switchport/probeName/side/channel | Market Data (within the Proximity Cloud context) is a class of sequenced UDP protocols, which can be decoded and understood as financial data, enabling measurements such as gap detection and App to Wire latency measurements. Market Data traffic is not recorded separately for Dedicated Servers - but market data multicast traffic will be included in the IP measurements as long as that Dedicated Server is setup in the Analytics system as a multicast subscriber to that traffic. | |
Order Monitoring | Trading_DS_stats | Trading | vp/intentity/gateway/session | Well-formatted examples of Trading protocols (e.g. FIX, OUCH) that are delivered using the TCP protocol will be decoded. Key fields within the message are analysed to enable measurements, such as App to Wire latency measurements. Any decoded message in the Trading protocol will be counted here – we do not make any attempt in these high-level statistics to distinguish between trades, cancels, orders , quotes etc. |
Trading_ExtGrp_DS_stats | Trading | vp/intentity/gateway/session | An extension of the Trading_DS_stats aggregator. View statistics about an individual External Group, or view DS information per External Group which that DS communications with. |
About the Probe Name Aggregator level
The Probe Name Aggregator level can be found at the bottom level of some of the Beeks Analytics for Markets aggregators. It is useful for internal Beeks Analytics diagnostics, but it is not intended for client use.